Hydrol. Earth Syst. Sci., 15, 603–616, 2011 www.hydrol-earth-syst-sci.net/15/603/2011/ doi:10.5194/hess-15-603-2011
© Author(s) 2011. CC Attribution 3.0 License.
Hydrology and
Earth System
Sciences
Mapping surface soil moisture over the Gourma mesoscale site
(Mali) by using ENVISAT ASAR data
F. Baup1, E. Mougin2, P. de Rosnay3, P. Hiernaux2, F. Frappart2, P. L. Frison4, M. Zribi1, and J. Viarre2
1CESBIO (Centre d’Etudes Spatiales de la Biosph`ere, UMR 5126, UPS-CNRS-CNES-IRD), 18 avenue Edouard
Belin, 31401 Toulouse cedex 9, France
2GET (G´eosciences Environnement Toulouse, UMR 5563 CNRS-UPS-IRD) Observatoire Midi-Pyr´en´ees
14 avenue Edouard Belin, 31400 Toulouse, France
3ECMWF (European Centre for Medium-Range Forecasts), Reading, Berkshire, UK
4Laboratoire des G´eomat´eriaux, Universit´e Marne La Vall´ee, Institut Francilien des Sciences Appliqu´ees,
5 bd Descartes, 77454 Marne la Vall´ee Cedex 2, France
Received: 23 July 2010 – Published in Hydrol. Earth Syst. Sci. Discuss.: 28 September 2010 Revised: 20 January 2011 – Accepted: 31 January 2011 – Published: 18 February 2011
Abstract. The potentialities of ENVISAT ASAR (Advanced Synthetic Aperture Radar) multi-angle data for mapping sur-face soil moisture (SSM) in Sahelian rangelands are investi-gated at medium scale (30 000 km2). The Wide Swath data are selected to take advantage of their high temporal repet-itivity (about 8 days at the considered scale) associated to a moderate spatial resolution (150 m). In the continuity of previous studies conducted at a local scale in the same re-gion, SSM maps are here processed over the whole AMMA Gourma mesoscale site at 1 km resolution scale. Overall, the generated maps are found to be in good agreement with field data, EPSAT-SG (Estimation des Pluies par SATellite – Sec-ond Generation) rainfall estimates and ERS (European Re-mote Sensing) Wind Scatterometer (WSC) SSM products. The present study shows that the spatial pattern of SSM can be realistically estimated at a kilometric scale. The result-ing SSM maps are expected to provide valuable information for initialisation of land surface models and the estimation of the spatial distribution of radiative fluxes. Particularly, SSM maps could help to desaggregate low-resolution prod-ucts such as those derived from WSC data.
Correspondence to: F. Baup
1 Introduction
Soil moisture monitoring over the Sahel is a major issue of the agenda of the AMMA (African Monsoon Multidisci-plinary Analysis) project which aims at a better understand-ing of the West African Monsoon and its physical, chemical and biological environments (GEWEX-news, 2006). Moni-toring the spatio-temporal variability of soil moisture is also needed to better understand soil-vegetation-atmosphere in-teractions and to address the role of soil moisture on West African monsoon dynamics (e.g. Monteny et al., 1997; Clark et al., 2004; Taylor and Ellis, 2006). Moreover, surface soil moisture (SSM) is a key parameter for surface processes which govern the incident solar energy partitioning between surface heat and water fluxes.
604 F. Baup et al.: Mapping surface soil moisture over the Gourma mesoscale their different interactions with the surface components (soil
and vegetation). L-band data are less influenced by the vege-tation contribution due to a higher wave penetration into the vegetation and thus are more correlated with SSM. Although C-band data are more influenced by the vegetation canopy, they are also strongly linked to SSM in semi-arid regions where the vegetation cover is low (Ulaby et al., 1982; Wag-ner and Scipal, 2000; Zine et al., 2005; Zribi et al., 2008, Wagner et al., 2008).
The last generation of spaceborne radars, such as the Advanced Synthetic Aperture Radar (ASAR) onboard EN-VISAT or RADARSAT, provides images combining a high spatial resolution (≤150 m) and a large spatial cover (up to 500 km) at C-band frequency. Particularly, the ASAR Wide Swath mode provides images with a high temporal sam-pling (3–4 days at local scale and 8 days at meso-scale) associated to a moderate spatial resolution (150 m). Oth-ers ASAR modes such as Alternating polarisation or Im-age modes could also be used for improving SSM estimates. However, for the time being, their use is constrained by their low spatial coverage that is lower than 100 km (ENVISAT ASAR product Handbook, 2007). Besides, the Global Mon-itoring mode offers a significantly better temporal resolution (a few days) with a moderate spatial resolution (1 km). How-ever, its poor radiometric performance in terms of radiomet-ric accuracy and stability limits its use to regional to global analysis (e.g. Baup et al., 2007b; Pathe et al., 2009, Mladen-ova et al., 2010).
SSM estimation can take advantage of the multi-angular capabilities of SAR antenna providing complementary infor-mation from the surface (soil and vegetation). Indeed, the influence of the green vegetation can be either neglected or simply taken into account at low incidence angles and for low vegetation density (Leaf Area Index – LAI –<2 m2m−2)as proposed in Tansey et al., 1999 and Moran et al., 2000. At higher incidence angles, the vegetation effects on the radar signal can be corrected using the angular properties of the backscattering coefficient (Wagner et al., 2000; Baup et al., 2007a). Finally, the determination of SSM was found to be possible from ASAR data, for values higher than 4% (m3/m3). Below this threshold, the radar signal instabil-ity (±0.6 dB for ENVISAT/ASAR) combined with unknown surface temporal changes prevent from an accurate SSM es-timation (Moran et al., 2000; Mattia et al., 2006; Baup et al., 2007a; Zribi et al., 2008).
In the framework of the AMMA project, meso-scale sites have been instrumented in Mali, Niger and Benin, pro-viding ground data along the latitudinal gradient between Sahelian and Sudanian bioclimatic regions (Lebel et al., 2009; Cappelaere et al., 2009; Mougin et al., 2009a; de Rosnay et al., 2009).
The aims of the present study are (1) to generalize a re-cently proposed method for SSM monitoring over sandy soils of the Sahel (Baup et al., 2007a) to soil erosion (rocky) surfaces. Both surfaces account for more than 90% of the
considered region. Here, we use data collected at a sec-ond sandy site and a rocky site located in the same region in Mali, (2) to generate time series of SSM maps at meso-scale (1◦×3◦) with the help of a soil map, (3) to evaluate the validity of the generated SSM maps at meso-scale with relevant and available SSM (Zribi et al., 2008) and rainfall products (Berg`es and Chopin, 2004).
To this end, we use HH-polarized ENVISAT/ASAR Wide Swath data which combine high spatial coverage, moderate spatial resolution and high temporal sampling. The paper is organised as follows: the data used (ground and satellite) and the overall methodology are presented in Sect. 2. Then, the performance of the algorithm is evaluated using EPSAT-SG (Estimation des Pluies par SATellite – Second Gener-ation) rainfall products, European Remote Sensing (ERS) wind scatterometer SSM products and local raingauges data (Sect. 3). Conclusions on the relevance of ASAR SSM maps and perspectives are given in Sect. 4.
2 Data and methods 2.1 The study site
The Gourma meso-scale site (1◦W–2◦W, 14.5◦N–17.5◦N) is entirely located within the Sahel bioclimatic zone (Mou-gin et al., 2009a). This region, mainly pastoral, is bracketed by the 150 and 500 mm isohyets. The rain distribution is strictly mono-modal with rainfall starting in June and end-ing in September with a maximum in August (Frappart et al., 2009). This short rainy season is followed by a long dry season during which there is no green vegetation except for rare perennial herbaceous and the foliage of some of scat-tered trees and shrubs (Hiernaux et al., 2009). Bare soils are thus very much exposed during most of the dry season with contrasted colors, textures and roughness (Fig. 1a–b).
During the wet season, rangeland vegetation is composed of a low herbaceous layer dominated by annuals and a sparse woody plant population (mean<5% cover). Annual herbs growth is governed by soil moisture regime itself driven by the pattern and magnitude of the rain events, and by run-off function of rain intensity, topography and soil texture (Case-nave and Valentin, 1989). Annual herbs germinate with the first marked rains, in June or July, and unless the plants wilt before maturity owing to a lack of rainfall, the senescence coincides approximately with the end of the rainy season, several days after the drying up of soils. Evapotranspiration over the grassland commonly ranges 1–3 mm day−1and can
reaches 3–4 mm day−1(Timouk et al., 2009). 2.2 Ground data
F. Baup et al.: Mapping surface soil moisture over the Gourma mesoscale 605
a)
b)
Fig. 1:
Views of the
Agoufou
Fig. 1. Views of the Agoufou (a), Eguerit (b) sites during the dryseason in April.(a),
Eguerit
(b) sites during the dry season in April.
2.2.1 SSM measurements
The objectives of the soil moisture stations network are to collect information about the spatio-temporal variation of soil moisture over the meso-scale window at different depths (de Rosnay et al., 2009). From April to December 2005, soil moisture was automatically recorded at 15 or 30 minutes time step at two sandy local sites, namely Agoufou (15.3◦N, 1.5◦W), and Ebang Mallam (15.4◦N, 1.3◦W) and one ero-sion surface (rocky) site: Eguerit (15.5◦N, 1.4◦W) (Fig. 2). Only measurements recorded at 5 cm depth are considered in accordance with the microwave soil penetration depth (Ulaby et al., 1981).
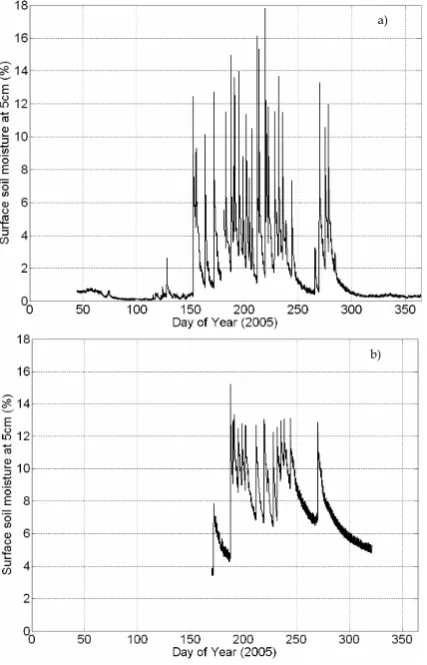
In all sites, soil moisture is measured by reflectometers (Campbell Scientific CS616). Sensors are calibrated by using in situ gravimetric measurements and estimation of soil bulk density. In this study, SSM is expressed in volumetric water content (m3/m3)in accordance with the calibration method presented in de Rosnay et al., 2009. Figure 3a and b illustrate the temporal variation of SSM for the Agoufou sandy – and Eguerit rocky- sites.
27
[image:3.595.308.544.62.389.2]645
Fig. 2: The AMMA mesoscale site in Gourma (Mali) (1°W-2°W/14.5°N-17.5°N) showing the 646
location of the soil moisture stations and automatic raingauges in 2005. 647
Fig. 2. The AMMA mesoscale site in Gourma (Mali) (1◦W– 2◦W/14.5◦N–17.5◦N) showing the location of the soil moisture stations and automatic raingauges in 2005.
During the dry season, SSM is close to 0.05% and reaches values as high as 18% at Agoufou during the wet season. At the Eguerit site, SSM values range between 3.5% and 15%. Local SSM measured by automatic stations typically range between 0.05 and 24% over the whole meso-scale site (de Rosnay et al., 2009).
2.2.2 Rainfall measurements
[image:3.595.55.281.65.412.2]606 F. Baup et al.: Mapping surface soil moisture over the Gourma mesoscale
Table 1. Raingauges acquisitions time step.
Raingauge Tin Ekia Eguerit Bangui Agoufou Hombori Kyrnia Kobou
location Tadeini Mallam
Acquisition real real 15 min real 15 min Daily real real
time step time time time time time
28
648
[image:4.595.62.276.179.512.2]649
Fig. 3: Seasonal variation of surface soil moisture (SSM) at 5cm depth at the Agoufou sandy
650
(a) and Eguerit rocky (b) sites in 2005.
651
a)
b)
28
648
649
Fig. 3: Seasonal variation of surface soil moisture (SSM) at 5cm depth at the Agoufou sandy
650
(a) and Eguerit rocky (b) sites in 2005.
651
a)
b)
Fig. 3. Seasonal variation of surface soil moisture (SSM) at 5cm depth at the Agoufou sandy (a) and Eguerit rocky (b) sites in 2005.
2.2.3 Soil map
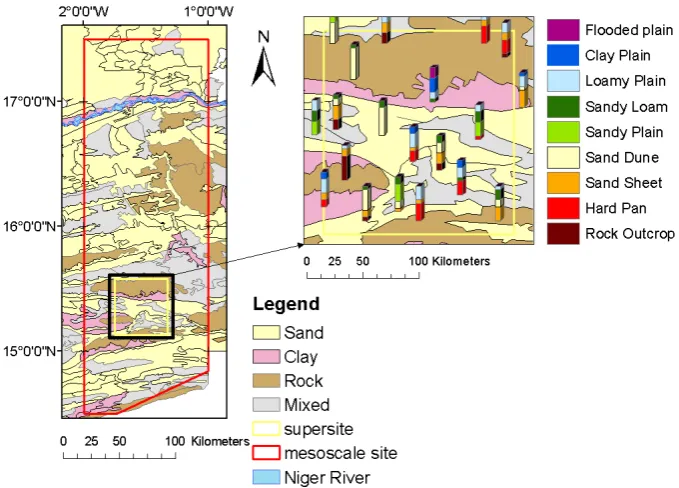
Over the Gourma region, nine soil types are mapped by vi-sual interpretation of a mosaic of Landsat TM images at a resolution of 30 m and systematic field observations (Mou-gin et al., 2009a). Soil surface types are defined according to topography, terrain morphology, top soil texture and soil surface features. Soil types (initially divided in 9 classes) are grouped in 4 dominant classes (clay, mixed, sandy and rocky) and presented in Figure 4 at meso-scale and supersite scales. For best clarity, only main classes are presented for the meso-scale site. Each class is represented by its cover
percentage varying from 0 to 100%. The sandy and rocky soil classes contribute more than 90% of the study site. 2.3 Satellite data
ENVISAT ASAR
The ENVISAT satellite was launched by ESA (European Space Agency) on 1 March 2002. The ASAR instrument is a multi-mode sensor which operates at C-band (5.3 GHz) at several polarizations (HH, VV, HV and VH), incidence angles, and spatial/radiometric resolutions depending on the functioning mode (Desnos et al., 1999). At the C-band fre-quency, atmospheric perturbations, except originating from strong precipitation systems, can be considered negligible (Ulaby et al., 1981). ASAR data are provided by the ScanSAR Wide Swath (WS) mode at HH polarization, at a spatial resolution of 150 m and incidence angles range be-tween 16◦ and 43◦ (ENVISAT handbook, 2007). The con-fidence interval is estimated at±0.6 dB at 1σ (whereσ de-notes the standard deviation), over the 1×1 km2sites (Baup et al., 2007b).
From July to December 2005, 23 images were acquired at various incidence angles over the AMMA meso-scale site. Only 7 images were analyzed: 5 for the wet season and 2 for the dry season (Table 2). The 16 other images have been acquired during the dry season and are characterized by very low and almost constant SSM. The 7 selected images are cal-ibrated with the B.E.S.T. (Basic ENVISAT SAR Toolbox) software algorithm described in Laur et al. (1998). Then, their geolocation is improved by using ground control points taken from a Landsat TM image at a spatial resolution of 30 m. Mean offsets of 1 pixel (75 m) in latitude and 7 pixels (525 m) in longitude have been observed and corrected for.
ERS Scatterometer data
F. Baup et al.: Mapping surface soil moisture over the Gourma mesoscale 607
29
652
Fig. 4: Soil types map of the AMMA meso-scale site in Mali. The 9 soil types (stacked bars)
653
are grouped into 4 dominant soil texture classes (polygons)
[image:5.595.128.468.63.307.2]654
Fig. 4. Soil types map of the AMMA meso-scale site in Mali. The 9 soil types (stacked bars) are grouped into 4 dominant soil texture classes (polygons)
Table 2. Dates, time and orbit passes (Descending (D) or Ascending (A)) of radar image used in this study.
ASAR WSC
Season Date Time Orbit Date
wet 16/07/2005 10:03:41 D 04/07/2005
wet 4/08/2005 10:06:28 D 4/08/2005
wet 20/08/2005 10:03:36 D 20/08/2005
wet 3/09/2005 22:06:13 A 3/09/2005
wet 8/09/2005 10:06:25 D 8/09/2005
dry 19/12/2005 10:00:29 D –
dry 20/12/2005 22:11:58 A –
operates at 5.3 GHz and VV polarization, like the ERS/SAR instrument. Its spatial resolution is around 50 km, and mea-surements are repeated every three to four days. The data are processed using a grid with elementary 0.25◦ square cells. The methodology presented in Zribi et al. (2008) enables SSM products to be obtained at regional scale over West Africa. Angular normalisation is applied for each cell and local empirical surface soil moisture inversion functions are applied at larger scale. Vegetation and soil roughness vari-ations are interpreted as a “dry signal” as presented in Zribi et al. (2008). The observed variations of the backscattering signal above the dry signal are attributed to SSM changes.
EPSAT-SG data
EPSAT-SG (Estimation des Pluies par SATellite – Second Generation) precipitation products are generated at LMD (Laboratoire de M´et´eorologie Dynamique) within the frame-work of AMMA. Satellite and raingauge data are used to produce high resolution rainfall estimations. The EPSAT-SG algorithm is composed of two parts: the computation of rainfall probability and the actual rainfall estimation (Berg`es et al., 2005). Rainfall probabilities are computed using a feed forward neural network from MSG (Meteosat Second Generation), multi-spectral images and TRMM PR (Tropical Rainfall Measuring Mission Precipitation Radar) data. For every 15 minutes MSG image, a rainfall probability map is produced (Berg`es and Chopin, 2004). Then, potential rain-fall intensity maps are computed merging GPCP-1dd (Global Precipitation Climatology Project at one degree of space res-olution) information with the rainfall probability map. The estimated rainfall intensity is the product of the rainfall prob-ability and the potential intensity (Chopin et al., 2005).
[image:5.595.58.278.404.515.2]608 F. Baup et al.: Mapping surface soil moisture over the Gourma mesoscale 2
Soil map
Mask of Niger River
Applying SSM local function
( )
% Min(
f(
0 ,soiltype)
,0.5)
Humsol = σNORM
Soil moisture maps
Masking Radiometric normalisation 0 0 DRY NORM IOI
NORM
σ
σ
−Radar Images Of Interest (IOI)
Reference image from the dry season
Angular normalisation:
( soiltypevegetation)
f INITIAL NORM IOI
NORM0 σ0 α ,α , ,
σ = ×
Angular normalisation: ( soiltype)
f INITIAL NORM DRY
NORM , ,
0
0 σ α α
σ = ×
Spatial filtering Spatial filtering
Final product
Mathematical operation Initial products
Legend
Fig. 5: Chart of the surface soil moisture (SSM) mapping algorithm.
α
INITIALandα
NORMrespectivelyrepresent the initial acquisition angle and the angle of normalization.
Fig. 5. Chart of the surface soil moisture (SSM) mapping algorithm.αINITIALandαNORMrespectively represent the initial acquisition angle
and the angle of normalization.
and soil moisture patterns. A relatively good agreement is obtained for rainfall amounts lower than 20 mm whereas higher rainfalls are underestimated by EPSAT-SG.
For the need of the study, the rain rates are summed either over 1 or over 5 days.
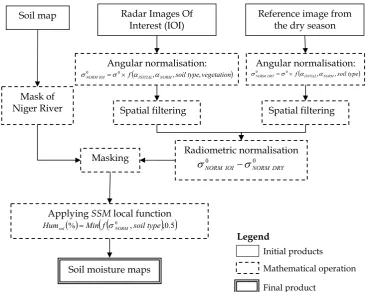
2.4 Methodology of surface soil moisture mapping The SSM maps are produced from satellite and ground data in a several process steps (Fig. 5).
1. The proposed methodology consists of an angular-normalization of ASAR images depending on the ac-quisition angle, soil type and vegetation. Despite a low vegetation cover in this semi-arid region, a vegetation correction is applied to take into account (1) the strong spatial heterogeneities of the vegetation cover, (2) the inter-annual variations of the vegetation cover. Particu-larly, this correction is relevant for wet years for which the vegetation cover is well developed. The normaliza-tion method consists in characterizing the angular vari-ation function of the backscattering coefficient for dif-ferent soil types (Baup et al., 2007b). Over sandy soils, two normalization functions are used depending on the amount of vegetation. For the dry season (from Octo-ber to May) when the green herbaceous layer is absent,
the normalization function is derived from all data ac-quired at various incidence angles to establish the an-gular regression function which is approximated by a second order polynomial fit. For the wet season, a sim-ple normalization function is built by considering all of the ASAR data recorded at the date of maximum green vegetation cover (Baup et al., 2007a). Vegetation ef-fects are taken into account after the start of the herba-ceous vegetation growth. This period is detected by using Normalized Difference Vegetation Index (NDVI) images acquired by the Moderate Resolution Imaging Spectroradiometer (MODIS). Here, a NDVI threshold of 0.14 is retained corresponding to the offset observed on the MODIS data acquired during the dry season over the sandy surfaces of the Malian meso-scale site (Mou-gin et al., 2009b). Over rocky erosion and hard pan surfaces, vegetation effects are neglected since the veg-etation cover remains generally very low, even during the wet season (Hiernaux et al., 2009). In accordance with previous studies (Baup et al., 2007a, b), the angu-lar variation function is used to normalise the radar data at 23◦of incidence angle.
[image:6.595.114.481.61.353.2]F. Baup et al.: Mapping surface soil moisture over the Gourma mesoscale 609
Table 3. Statistical parameters of the soil roughness at Agoufou (sandy soil) during the dry and the wet seasons: hrms is the root mean square value of the roughness height, lc is the corellation length, Std is the standard deviation.
hrms Std (hrms) Lc Std(lc)
(cm) (cm) (cm) (cm)
Dry season 0.7 0.3 12.6 6.9
Wet season 0.5 0.3 13.5 7.0
degraded from 150 m to 1km as a result of the filter ap-plication.
3. The radiometric correction step consists of processing the difference between one dry season image chosen as a reference and the wet season image of interest (IOI) (Wagner et al., 2000; Zribi et al., 2006). The reference image is selected to be representative of the soil roughness when no vegetation is present (here the 20 December). In situ measurements show that surface soil roughness does not strongly vary between dry and wet seasons over sandy soils. The instrument used is a 2 m long needle like profilometer with a 1cm horizontal sampling distance, allowing the estimation of standard deviation of roughness heights and the autocorrelation length. Measurements were made in August 2005 (wet season) and February 2006 (dry season) at the Agoufou site (Table 3) with a total of 60 and 16 profiles for the wet and dry seasons, respectively. Results show that the roughness parameters for sandy soils do not signif-icantly vary between the two contrasted seasons. Since the surface of sandy soils are the most sensitive to mete-orological conditions (wind, rain) and animal trampling, it is assumed constant roughness values over time for the other soil types as well.
4. A mask of the Niger River is built from the soil map and applied to the whole set of ASAR images. Masks are also applied over mixed surfaces for which the relation between SSM andσ0is unknown.
5. Finally, SSM maps are estimated at kilometric scale from the difference between the dry reference image and images acquired during the wet season over the meso-scale window by applying empirical inversion functions estimated for sandy and rocky soils. Coef-ficients of these linear functions are given in Table 4. Because of residual negative SSM values, a minimal threshold of 0.5% is imposed.
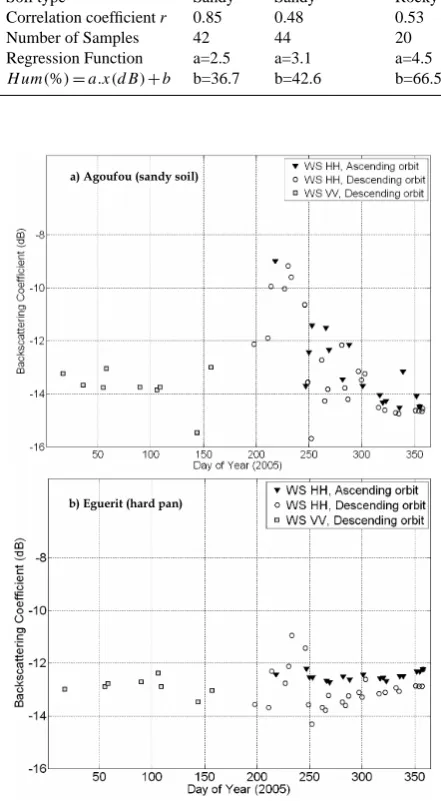
Table 4. Correlation coefficients (r) between local surface soil moisture and normalized backscattering coefficient at the three con-sidered local sites. Only descending orbit data (D) are considered for the rocky Eguerit site.
Site Agoufou Ebang Mallam Eguerit
Soil type Sandy Sandy Rocky Correlation coefficientr 0.85 0.48 0.53 Number of Samples 42 44 20 Regression Function a=2.5 a=3.1 a=4.5
H um(%)=a.x(dB)+b b=36.7 b=42.6 b=66.5
31
659
660
Fig. 6: Temporal variation of the normalized (23°) backscattering coefficient in 2005 for the
661
Agoufou sandy (a) and the Eguerit rocky (b) sites.
662
b) Eguerit (hard pan) a) Agoufou (sandy soil)
31
659
660
Fig. 6: Temporal variation of the normalized (23°) backscattering coefficient in 2005 for the
661
Agoufou sandy (a) and the Eguerit rocky (b) sites.
662
b) Eguerit (hard pan) a) Agoufou (sandy soil)
Fig. 6. Temporal variation of the normalized (23◦) backscatter-ing coefficient in 2005 for the Agoufou sandy (a) and the Eguerit rocky (b) sites.
3 Surface soil moisture maps
3.1 Relationships between SSM and normalizedσ0
[image:7.595.316.537.146.547.2]610 F. Baup et al.: Mapping surface soil moisture over the Gourma mesoscale As already indicated in Baup et al. (2007a, b), the
backscattering coefficient,σ0, over the Agoufou sandy site displays a strong seasonal dynamics (>5 dB), due both to the growth of annual herbs and to high SSM values reached dur-ing the wet season. In contrast, the seasonal dynamics ofσ0 recorded on the Eguerit rocky site is much weaker (<2 dB) due to both a low vegetation cover (Hiernaux et al., 2009) and overall low SSM.
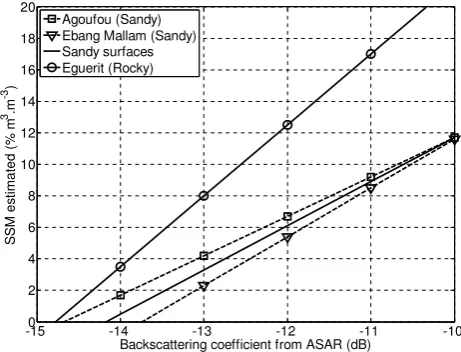
Correlation coefficients betweenσ0and SSM for the three considered local sites are presented in Table 4 and associated regression functions are plotted in Fig. 7. The highest values are observed for the sandy site of Agoufou (r∼0.85). The second sandy site, Ebang Mallam, exhibits a lower correla-tion coefficient (r=0.48)due to a higher spatial heterogene-ity in terms of vegetation cover and soils.
For the rocky site, Eguerit, backscattering coefficients are weakly correlated with SSM (r=0.53), even for descend-ing passes which show the highestσ0dynamics. This could be explained by two main reasons. The first one is associ-ated to the difficulties of measuring soil moisture in such a medium composed of gravels and rocks for which the used SSM probes are not specifically designed. The second dif-ficulty originates from the high spatial heterogeneity of soil texture within the site due to the presence of sparsely dis-tributed sandy-loamy sheets. This justifies the exclusion of mixed soil types in the SSM mapping process. Finally, the total of soil and land cover types excluded from the analysis represent 28% of the meso-scale site; this also includes the Niger River and seasonally flooded acacia forests.
3.2 SSM maps
Following the methodology described in Sect. 2.4, SSM maps are generated at meso-scale. On the resulting images, black pixels result from either the applied mask or the lack of radar data (see for example Fig. 8). At meso-scale, the evaluation of SSM maps is a difficult exercise since no di-rect comparison is possible with SSM ground data. Here, the ASAR SSM maps are thus interpreted with the help of EPSAT-SG rainfall estimations, WSC soil moisture products and raingauges data. Because they differ in spatial resolution (1 km, 10 km and 25 km, respectively), their spatial patterns are compared in a first analysis.
Figure 8 shows the generated SSM map corresponding to the beginning of the 2005 rainy season (16 July, DoY 197). Patches of high SSM to the North of Tin Tadeini can be related to the precipitations that fell during the 4 previous days totalling 10 to 12 mm (Fig. 8). Rainfall occurred on the same day (a total of 2 mm estimated from EPSAT-SG) have a minor influence since this quantity is very small for such an arid area. Raingauge records at Tin Tadeini (6 mm) confirm the occurrence of rainfall events. The large strip of high SSM to the South of Agoufou can be related to 25 mm cumulative estimated rainfalls (EPSAT-SG) over the 4 pre-vious days confirmed by the raingauge records in Agoufou
32
-150 -14 -13 -12 -11 -10
2 4 6 8 10 12 14 16 18 20
S
S
M
e
s
ti
m
a
te
d
(
%
m
3.m -3)
Backscattering coefficient from ASAR (dB) Agoufou (Sandy)
Ebang Mallam (Sandy) Sandy surfaces Eguerit (Rocky)
663 664
Fig 7: Surface Soil Moisture - Backscattering coefficient regression functions estimated over
665
the two sandy sites and the rocky site. The final regression function used over sandy
666
surfaces is also plotted.
667
668
Fig. 7. Surface Soil Moisture – Backscattering coefficient regres-sion functions estimated over the two sandy sites and the rocky site. The final regression function used over sandy surfaces is also plotted.
(17 mm). Overall, most of the SSM values are still below the noise threshold (a SSM of 4%). This can be attributed both to speckle effects which are not completely removed at 1km scale, and to local higher SSM values associated to to-pographic effects (depressions, small dunes) and to different soil textures. No WSC soil moisture product is available at this date over the whole meso-scale site.
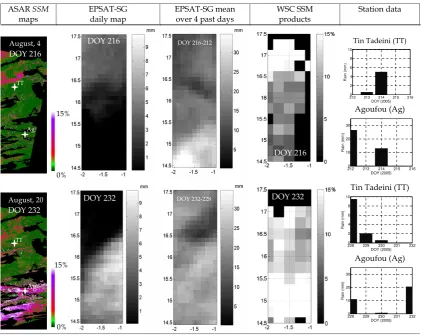
During the wet season (Figs. 9 and 10), soil moisture maps of sandy soils display different patterns. On 4 August (DoY 216), general large scale spatial trend of the SSM map shows an overall good agreement with the daily rainfall EPSAT-SG map, especially in the Northern part of the considered win-dow (Fig. 9). Particularly, the SSM maps point out the high spatial heterogeneity of SSM due to fine scale rainfalls events that are not observed in the ESPSAT-SG data. Besides, spots of high SSM values located in the South also indicate resid-ual moisture due to past rainfall events supported by the cu-mulative EPSAT-SG product (about 35 mm of rain cumulated over the previous 4 days). This weak temporal signature of SSM confirms the limit of 4 days to detect the occurrence of rainfall events over sandy soils (Baup et al., 2007b). A high infiltration rate on sandy soils associated to high evap-oration rates explain the rapid decrease of SSM at the soil surface. The finer spatial resolution of ASAR data provide information about the geographic distribution of rain events estimated by EPSAT-SG. Local SSM station data are in ac-cordance with satellite products in the Southern part of the image, and with the recorded cumulative rainfall of about 39 mm at Agoufou.
[image:8.595.312.543.64.240.2]F. Baup et al.: Mapping surface soil moisture over the Gourma mesoscale 611
Fig. 8: Soil moisture (SSM) maps established during the 2005 dry (December, 19) and wet (July, 16) seasons compared to EPSAT-SG rainfalls
estimates on the same day and over the four previous days and with rainfall recorded at Agoufou and Tin Tadeini during the five same days.
ASAR SSM map
(dry season)
ASAR SSM maps
(in% of m3.m-3)
EPSAT-SG daily map
EPSAT-SG mean over 4 past days
Station data
Tin Tadeini (TT)
1930 194 195 196 197 2
4 6 8 10
DOY (2005)
R
a
in
(
m
m
)
Agoufou (Ag)
1930 194 195 196 197 10
20 30
DOY (2005)
R
a
in
(
m
m
)
15%
0%
DOY 197
TT
Ag
DOY 197
DOY 353 DOY 197-193
Fig. 8. Soil moisture (SSM) maps established during the 2005 dry (December, 19) and wet (July, 16) seasons compared to EPSAT-SG rainfalls estimates on the same day and over the four previous days and with rainfall recorded at Agoufou and Tin Tadeini during the five same days.
ASAR SSM
maps
EPSAT-SG daily map
EPSAT-SG mean over 4 past days
WSC SSM products
Station data
Tin Tadeini (TT)
212 213 214 215 216 0
2 4 6 8 10
DOY (2005)
R
a
in
(
m
m
)
Agoufou (Ag)
212 213 214 215 216 0
10 20 30
DOY (2005)
R
a
in
(
m
m
)
Tin Tadeini (TT)
228 229 230 231 232 0
2 4 6 8 10
DOY (2005)
R
a
in
(
m
m
)
Agoufou (Ag)
228 229 230 231 232 0
10 20 30
DOY (2005)
R
a
in
(
m
m
)
15%
0%
TT
Ag
August, 4
DOY 216
August, 20
DOY 232
TT
Ag
0% 15%
DOY 232-228 DOY 216-212
DOY 216
DOY 232 DOY 232
DOY 216
[image:9.595.86.508.324.659.2]612 F. Baup et al.: Mapping surface soil moisture over the Gourma mesoscale
ASAR SSM
Maps
EPSAT-SG daily map
EPSAT-SG mean over 4 past days
WSC soil moisture products
Station data
Tin Tadeini (TT)
242 243 244 245 246 0
2 4 6 8 10
DOY (2005)
R
a
in
(
m
m
)
Agoufou (Ag)
242 243 244 245 246 0
10 20 30
DOY (2005)
R
a
in
(
m
m
)
Tin Tadeini (TT)
2470 248 249 250 251 2
4 6 8 10
DOY (2005)
R
a
in
(
m
m
)
Agoufou (Ag)
2470 248 249 250 251 10
20 30
DOY (2005)
R
a
in
(
m
m
)
15%
Sept, 3 DOY 246
15%
0% 0%
TT
TT Ag
Ag
DOY 246 DOY 246-242
DOY 246
Sept, 8 DOY 251
DOY 251-247
DOY 251
[image:10.595.88.509.63.384.2]DOY 251
Fig. 10. Comparisons of September soil moisture (SSM) maps (3rd and 8th)derived from ENVISAT-ASAR and ERS WSC soil moisture products and EPSAT-SG rainfalls estimates on the same day and over the four previous days, and with rainfall recorded at Agoufou and Tin Tadeini during the five same days.
On 20 August (DoY 232), the SSM map is highly con-trasted with a large swath of saturated SSM values (20%) in the Southern Gourma that corresponds to the occurrence of a large convective system a few hours before the radar image acquisition (EPSAT-SG product indicates 8mm and Agoufou local station recorded 21 mm). High and medium SSM values are more scattered in Northern Gourma in rela-tion with rain events that occurred during the previous days (20 mm EPSAT-SG cumulated rains in the North, confirmed by 11 mm recorded at Tin Tadeini over 3 days). The WSC product exhibit high values in the South and in the North-West part of the meso-scale site (up to 20%) in agreement with EPSAT-SG cumulative products.
On 3 September (DoY 246), the SSM map displays local patches that can be related to local rain events observed on EPSAT-SG rainfall products during the previous days (about 20 mm along a Northeast to Southwest stripe) (Fig. 10). The Agoufou raingauge station also recorded a rainfall event but of only 2.5 mm during on DoY 244.
On 8 September (DoY 251), the accumulation of medium SSM values in the Southern part of the site can be related to the occurrence of a convective system during the 4 previous
days. In accordance with EPSAT-SG maps, no rains are recorded at Tin Tadeini nor at Agoufou during the day cor-responding to the ASAR acquisition. Local patches of high SSM values can also be observed in Northern and Central parts of the map. They are attributed to residual moisture in depressions as no rainfall has been monitored.
In contrast, soil moisture patterns derived from WSC data are not in accordance with ASAR and EPSAT products. In-deed, despite no rainfall occurred during the 4 previous days before the radar acquisition (WSC and ASAR), only low res-olution products indicate high surface soil moisture in the Northern part of the image. This phenomenon is locally at-tributed to the presence of the Niger River and to flooded vegetation which highly contribute to increase the backscat-tering coefficient. High resolution data allow this specific region to be masked and prevent from overestimated SSM
values.
F. Baup et al.: Mapping surface soil moisture over the Gourma mesoscale 613
5 10 15 20
0 1 2 3 4 5 6x 10
4
Surface Soil Moisture at 5cm (%)
N u m b e r o f D a ta
Dry Season (2005-12-19) Wet Season (2005-08-20)
Fig. 11: Distribution of soil moisture (SSM) values (% m3.m-3) at meso-scale site during the dry
and the wet 2005 seasons.
Fig. 11. Distribution of soil moisture (SSM) values (% m3m−3) at meso-scale site during the dry and the wet 2005 seasons.
4 Evaluation of SSM ASAR maps
At meso-scale, the distribution function of SSM values dras-tically changes between the dry and the wet seasons (Fig. 11). Mean (standard deviation) SSM values are about 1% (1.8) and 4% (5.0) for the dry and wet season, respectively. The 19 December (dry season) and the 20 August (wet season) maps exemplify it well (Figs. 8 and 9). During the wet sea-son, higher values reach about 20% in accordance with local automatic measurements. The dry season distribution indi-cates that SSM values mainly range between 0 and 4% due to radar signal instability (±0.6 dB) during this period (Baup et al., 2007a, b).
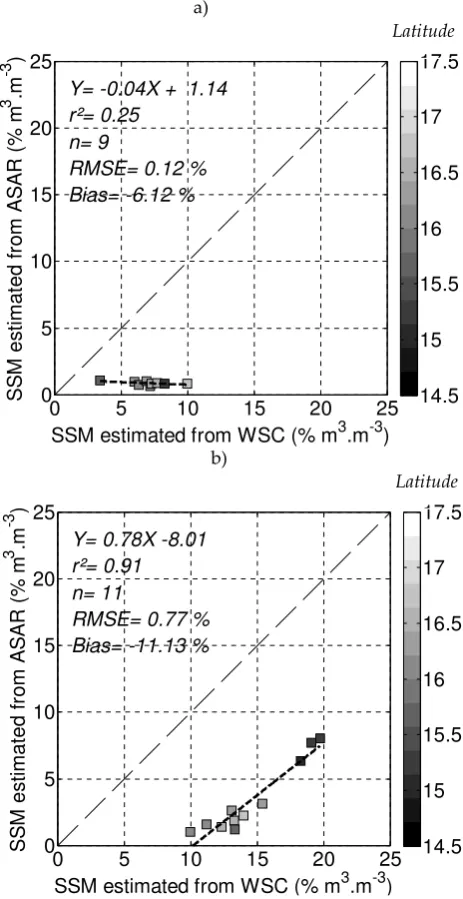
Among the different products used in this study, only the ERS WSC ones can be used for a quantitative evaluation of the ASAR SSM maps. Furthermore, both data sets are derived from radar sensors operating at the same frequency (5.3 GHz). To enable a direct comparison, 1 km resolution ASAR maps are aggregated to the WSC spatial resolution (25 km). Then, the comparison is made by considering the ASAR pixels corresponding to at least 95% of a WSC pixel. Figure 12a and b shows the results obtained from SSM maps generated for the driest and wettest dates in 2005 (8 and 20 September, respectively). For each selected pixel, its lati-tudinal location is also indicated.
Dry and wet periods are separated in the analysis to better discriminate between noise effects and radiometric changes related to SSM. During the dry season characterised by no rainfall event, WSC-derived SSM of the order of 3%–10%, is obviously overestimated, as already mentioned by Gruhier et al. (2010) (Fig. 12a). The observed bias of 6% between ASAR SSM and WSC SSM also confirms this overestima-tion. The highest SSM values are located in the Northern part of the site where the WSC signal is mainly affected by the Niger River and flooded vegetation. The initial offset of
39
a)
0 5 10 15 20 25
0 5 10 15 20 25
SSM estimated from WSC (% m3.m-3)
S S M e s ti m a te d f ro m A S A R ( % m 3 .m -3 )
Bias= -6.12 % RMSE= 0.12 % r²= 0.25
Y= -0.04X + 1.14
n= 9 14.5 15 15.5 16 16.5 17 17.5 b)
0 5 10 15 20 25
0 5 10 15 20 25
SSM estimated from WSC (% m3.m-3)
S S M e s ti m a te d f ro m A S A R ( % m 3 .m -3 )
Bias= -11.13 % RMSE= 0.77 % r²= 0.91
Y= 0.78X -8.01
n= 11 14.5 15 15.5 16 16.5 17 17.5
Fig. 12: Comparisons of SSM values estimated from ENVISAT- ASAR and ERS-WSC data for the
2005 driest (a) and wettest (b) dates (2005-09-08 and 2005-08-20, respectively). The location of
SSM pixels versus the latitude is also indicated.
Latitude Latitude
39
a)
0 5 10 15 20 25
0 5 10 15 20 25
SSM estimated from WSC (% m3.m-3)
S S M e s ti m a te d f ro m A S A R ( % m 3 .m -3 )
Bias= -6.12 % RMSE= 0.12 % r²= 0.25
Y= -0.04X + 1.14
n= 9 14.5 15 15.5 16 16.5 17 17.5 b)
0 5 10 15 20 25
0 5 10 15 20 25
SSM estimated from WSC (% m3.m-3)
S S M e s ti m a te d f ro m A S A R ( % m 3 .m -3 )
Bias= -11.13 % RMSE= 0.77 % r²= 0.91
Y= 0.78X -8.01
n= 11 14.5 15 15.5 16 16.5 17 17.5
Fig. 12: Comparisons of SSM values estimated from ENVISAT- ASAR and ERS-WSC data for the
2005 driest (a) and wettest (b) dates (2005-09-08 and 2005-08-20, respectively). The location of
SSM pixels versus the latitude is also indicated.
[image:11.595.312.544.64.514.2]Latitude Latitude
Fig. 12. Comparisons of SSM values estimated from ENVISAT – ASAR and ERS-WSC data for the 2005 driest (a) and wettest (b) dates (8 September 2005 and 20 August 2005, respectively). The location of SSM pixels versus the latitude is also indicated.
3% is explained by the inversion method initially developed over slightly wetter surfaces (see Zribi et al., 2008). In con-trast, ASAR-derived SSM show a higher stability with only 2% of dynamic range and an offset of about 1%.
[image:11.595.53.283.67.242.2]614 F. Baup et al.: Mapping surface soil moisture over the Gourma mesoscale The 11% bias observed during the wet season confirms the
general overestimation trend of ERS/WSC SSM products.
5 Concluding remarks
A local empirical methodology inversion of SSM from EN-VISAT/ASAR data has been generalized and applied at meso-scale at the AMMA site in Mali. Resulting soil mois-ture maps take into account surface roughness, vegetation density and angular variation ofσ0. They offer both a mod-erate spatial resolution (1 km) and a large spatial coverage (30 000 km2)contrary to the maps derived from the Alter-nate Polarization (AP) high resolution (Zribi et al., 2007) and Global Monitoring (GM) low resolution modes (Wagner et al., 2005) that were previously used for that purpose.
During the 2005 wet season, five dates are available char-acterized by a large soil moisture dynamics. On the whole, there is a good agreement and consistency between ASAR derived SSM maps and EPSAT-SG rainfall fields and lo-cal rainfall measurements. Finally, when aggregated to 25 km resolution, the ASAR- derived SSM maps are found to be in a very good agreement with ERS WSC-derived SSM maps generated during the wet season. Furthermore, in con-trast to ERS WSC dry season maps which show unrealistic high SSM values, ASAR derived maps exhibit low and con-stant SSM values during the whole dry season. These re-sults demonstrate the great potential of ASAR WS images for mapping and monitoring SSM at moderate resolution (1 km) in semi-arid regions. Such SSM products could be ad-vantageously used to desaggregate lower resolution images, such as those derived from AMSR, SMOS or ERS WSC data (Wagner et al., 2000; Berger et al., 2002; Njoku et al., 2003). In the future, temporal SSM monitoring in the Sahel could be improved by combining ASAR Wide Swath data to other existing microwave sensors. Indeed, the ASAR WS tem-poral resolution of about 8 days is still insufficient to en-able fast varying surface varien-ables like soil moisture to be accurately monitored. For instance, the combination with ALOS/PALSAR (L-Band) data should improve the sampling of SSM temporal variations while keeping a good spatial res-olution.
In the near future, with the launch of the Sentinel satel-lites, the temporal resolution of SAR images will signifi-cantly increase (<6 days, depending on the latitude) and be-come more suitable for monitoring the high temporal dynam-ics of the SSM over arid or semi-arid areas.
Acknowledgements. This work was performed within the frame-work of the AMMA project. Based on a French initiative, AMMA has been constructed by an international group and is currently funded by large number of agencies, especially from France, the UK, the US and Africa. It has been the beneficiary of a major financial contribution from the European Community’s Sixth Framework Research Programme. Detailed information on the scientific coordination and funding is available on the AMMA
international web site (https://www.amma-eu.org/). The authors thank ESA for providing the ENVISAT data used in the present study (Project ID 443, E. Mougin). The authors are grateful for all the help they received during the field measurement campaigns, especially from their colleagues and collaborators from the national institute for agronomic research in Mali, the “Institut d’Economie Rurale”.
Edited by: W. Wagner
The publication of this article is financed by CNRS-INSU.
References
Baup, F., Mougin, E., D. Rosnay, P., Timouk, F., Lavenu, F., and Chˆenerie, I.: Surface soil moisture estimation over the AMMA sahelian site in Mali using ENVISAT/ASAR data, Remote Sens. Environ., 109, 473–481, 2007a.
Baup, F., Mougin, E., Hiernaux, P., Lopes, A., De Rosnay, P., and Chˆenerie, I.: Radar signatures of Sahelian surfaces in Mali us-ing ENVISAT-ASAR data, IEEE T. Geosci. Remote., 45, 2354– 2363, 2007b.
Berger, M., Camps, A., Font, J., Kerr, Y., Miller, J., Johannessen, J., Boutin, J., Drinkwater, M. R., Skou, N., Floury, N., Rast, M., Rebhan, H., and Attema, E.: Measuring Ocean Salinity with ESA’s SMOS Mission, ESA Bulletin 111, 113f, 2002.
Berg`es, J. C. and Chopin, F.: Satellite rainfall estimation using a feed forward network: improvement and limitation, Proc. of the International Conference on Cloud Climatology and Precipita-tion, Bologna, 2004.
Berg`es, J. C., Chopin, F., and Bessat, F.: Satellite based downscal-ing for rainfall estimation, Proc. of the IV Coloquio Brasiliero de Ciencas Geodesicas, Curitiba, 2005.
Cappelaere, B., Descroix L., Lebel T., Boulain N., Ramier D., Lau-rent J.-P., Le Breton E., Boubkraoui S., Boucher M., Bouzou Moussa I., Chaffard V., Hiernaux P., Issoufou H. B. A., Le Bre-ton, E., Mamadou I., Nazoumou Y., Oi, M., Ottl´e, C., andv Quantin, G.: The AMMA-Catch experiment in the cultivated Sahelian area of south-west Niger – Investigating water cycle response to a fluctuating climate and changing environment, J. Hydrol., 375, 34–51, 2009.
Casenave, A. and Valentin, C.: Les ´etats de surface de la zone sah´elienne. Influence sur l’infiltration. ORSTOM, collection Di-dactiques, Paris, 229 p., 1989.
F. Baup et al.: Mapping surface soil moisture over the Gourma mesoscale 615
Chopin, F., Berg`es, J. C., and Desbois M.: Using MSG for GPCP products enhancement, Proc. of the 1st International AMMA conference, oral presentation, Dakar, (available at http: //amma-international.org/), 2005.
Clark, D. B., Taylor, C. M., Thorpe, and A. J.: Feedback between the land surface and rainfall at convective length scales, J. Hy-drometeorol., 5, 625–639, 2004.
de Rosnay, P., Gruhier, C., Timouk, F., Baup, F., Mougin, E., Hier-naux, P., Kergoat, L., and LeDantec, V.: Multi-scale soil moisture measurements at the Gourma meso-scale site in Mali, J. Hydrol., 375, 241–252, 2009.
Desnos, Y. L., Laur, H., Lim, P., Meisl, P., and Gach, T.: The ENVISAT-1 Advanced Synthetic aperture radar processor and data products, Geoscience and Remote Sensing Symposium, IGARSS’99, Hamburg, Germany, 1683–1685, 1999.
ENVI Programmer’s Guide: Research System, Inc., 930 pp., 1998. ENVISAT ASAR product Handbook: European Space Agency, Issue 2.2. 564 pages, available at: http://envisat.esa.int/ handbooks/, 2007.
Frappart, F., Hiernaux, P., Guichard, F., Mougin, E., Ker-goat, L., Arjounin, M., Lavenu, F., Koit´e, M., Paturel, J. E., and Lebel, T.: Rainfall regime across the Sahel band in the Gurma region, Mali, J. Hydrol., 375(1–2), 128–142, doi:10.1016/j.jhydrol.2009.03.007, 2009.
Frison, P. L. and Mougin, E.: Use of the ERS-1 Wind scatterometer data over land surfaces. IEEE T. Geosci. Remote. 34(2), 550– 560, 1996.
Frison, P. L., Mougin, E., and Hiernaux, P.: Observations and inter-pretation of Seasonal ERS-1 Wind Scatteromter Data over North-ern Sahel (Mali), Remote Sens. Environ., 63, 233–242, 1998. GEWEX-news: Global Energy and Water Cycle Experiment,
spe-cial issue “AMMA west African monsoon studies are addressing water cycle issues”, 16(1), 20 pp., 2006.
Gruhier, C., de Rosnay, P., Hasenauer, S., Holmes, T., de Jeu, R., Kerr, Y., Mougin, E., Njoku, E., Timouk, F., Wagner, W., and Zribi, M.: Soil moisture active and passive microwave prod-ucts: intercomparison and evaluation over a Sahelian site, Hy-drol. Earth Syst. Sci., 14, 141–156, doi:10.5194/hess-14-141-2010, 2010.
Hiernaux, P., Mougin, E., Diarra, L., Soumaguel, N., Lavenu, F., Tracol, Y., Diawara, M., and Jarlan, L.: Rangeland re-sponse to rainfall and grazing pressure over two decades: herba-ceous growth pattern, production and species composition in the Gourma, Mali, J. Hydrol., 375, 114–127, 2009.
Jackson, T. J., Bindlish, R., Gasiewski, A. J., Stankov, B., Klein, M., Njoku, E. G., Bosch, D., Coleman, T. L., Laymon, C. A., and Starks, P.: Polarimetric scanning radiometer C- and X-band microwave observations during SMEX03, IEEE T. Geosci. Re-mote, 43(11), 2418–2430, 2005.
Jarlan, L., Mougin, E., Frison, P. L., Mazzega, P., and Hiernaux, P.: Analysis of ERS wind scatterometter time series over Sahel (Mali), Remote Sens. Environ., 81, 404–415, 2002.
Laur, H., Bally, P., Meadows, P., Sanchez, J., Schaettler, B., Lop-into, E., and Esteban, D.: Derivation of the backscattering coeffi-cient so in ESA SAR products. ESA publication, Document No: ES-TN-RS-PM-HL09 17, Issue 2, Rev. 5d., 53 pp., 1998. Lebel T., Cappelaere B., Galle S., Hanan N., Kergoat L., Levis
S., Vieux B., Descroix L., Gosset M., Mougin E., Peugeot C., and Seguis L.: AMMA-CATCH studies in the Sahelian region of
West-Africa: an overview, J. Hydrol., 375, 3–13, 2009.
Mattia, F., Satalino, G., Dente, L., and Pasquariello, G.: Using a priori information to improve Soil Moisture Retrieval from EN-VISAT ASAR AP data in semiarid regions, IEEE T. Geoscie. Remote, 44, 900–912, 2006.
Mladenova, I., Lakshmi, V., Walker, J. P., Panciera, R., Wagner, W., and Doubkova, M.: Validation of the ASAR Global Monitoring Mode Soil Moisture Product Using the NAFE’O5 Data Set, IEEE T. Geosci. Remote, 48, 2498–2508, 2010.
Monteny, B. A., Lhomme, J. P., Chehbouni, A., Troufleau, D., Amadou, M., Sicot, M., Verhoef, A., Galle, S., Said, F., and Lloyd, C. R.: The role of the Sahelian biosphere on the water and the CO2cycle during the HAPEX-Sahel Experiment, J.
Hy-drol., 188–189, 516–535, 1997.
Moran, M. S., Hymer, D. C., Qi, J., and Sano, E. E.: Soil mois-ture evaluation using-temporal synthetic apermois-ture radar (SAR) in semiarid rangeland, Agri. Forest Meteorol., 105, 69–80, 2000. Mougin, E., Lopes, A., Frison, P. L., and Proisy, C.: Preliminary
analysis of the ERS-1 wind-scatterometer data over land sur-faces, Int. J. Remote Sens., 16(2), 391–398, 1995.
Mougin E., Hiernaux P., Kergoat L., Grippa M., de Rosnay P., Tim-ouk, F., Le Dantec, V., Demarez, V., Lavenu, F., Arjounin, M., Lebel, T., Soumaguel, N., Ceschia, E., Mougenot, B., Baup, F., Frappart, F., Frison, P.L., Gardelle, J., Gruhier, C., Jarlan, L., Mangiarotti, S., Sanou, B., Tracol, Y., Guichard, F., Trichon, V., Diarra, L., Soumar´e, A., Koit´e, M., Demb´el´e, F., Lloyd, C., Hanan, N.P., Damesin, C., Delon, C., Serc¸a, D., Galy-Lacaux, C., Seghieri, J., Becerra, S., Dia, H., Gangneron, F., and Mazzega, P.: The AMMA Gourma observatory site in Mali: Relating climatic variations to changes in vegetation, surface hydrology, fluxes and natural resources, J. Hydrol., 375, 14–33, 2009a.
Mougin, E., Demarez, V., Grippa, M., Hiernaux, P., Larouzi`ere, L., Lion, C., Diawara, M., and Soumaguel, N.: Evaluation of MODIS LAI products in a sahelian environment (Gourma, Mali), Poster presented at the 4h Global vegetation workshop, Univer-sity of Montana, Missoula, June 16–19, 2009b.
Njoku, E. G., Jackson, T. J., Lakshmi, V., Chan, T. K., and Nghiem, S. V.: Soil Moisture Retrieval From AMSR-E, IEEE T. Geoscie. Remote, 41(2), 215–229, 2003.
Panciera, R., Walker, J. P., Kalma, J. D., Kim, E. J., Hacker, J. M., Merlin, O., Berger, M., and Skou, N.: The NAFE’05/CoSMOS data set: Toward SMOS Soil moisture retrieval, Downscaling, and Assimilation. IEEE T. Geosci. Remote, 46, 736–745, 2008. Pathe, C., Wagner, W., Sabel, D., Doubkova, M., and Basara, J.
B.: Using ENVISAT ASAR Global Mode for surface soil mois-ture retrieval over Oklahoma, USA, IEEE T. Geosci. Remote, 47, 468–480, 2009.
Schmugge, T., Jackson, T., Kustas, T. J., and Wang, J. R.: Pas-sive microwave remote sensing of soil moisture: results from HAPEX, FIFE and MONSOON’90, ISPRS J. Photogramm., 47, 127–143, 1992.
Tansey, K. J., Millington, A. C., Battikhi, A. M., and White, K. H.: Monitoring soil moisture dynamics using satellite imaging radar in northeastern Jordan. Appl. Geogr., 19, 325–344, 1999. Taylor, C. M. and Ellis, R. J.: Satellite detection of soil moisture
616 F. Baup et al.: Mapping surface soil moisture over the Gourma mesoscale
Timouk, F., Kergoat, L., Mougin, E., Lloyd, C. R., Ceschia, E., Co-hard, J.-M. , de Rosnay, P., Hiernaux, P., Demarez, V., and Tay-lor, C. M.: Response of surface energy balance to water regime and vegetation development in a Sahelian landscape, J. Hydrol., 375(1–2), 178–189, doi:10.1016/j.jhydrol.2009.04.022, 2009. Ulaby, F. T., Fung, A. K., and Moore, R. K.: Microwave and remote
sensing active and passive. Norwood, MA: Artech House, 1981. Ulaby, F. T., Fung, A. K., and Moore, R. K.: Microwave and remote sensing: active and passive: surface scattering and emission the-ory, Norwood, MA: Artech House, 1982.
Wagner, W. and Scipal, K.: Large-scale Soil moisture mapping in western Africa using the ERS Scatterometer, IEEE T. Geosci. Remote, 38, 1777–1782, 2000.
Wagner, W., Scipal, K., Bartsch, A., and Pathe, C.: ENVISAT’s Ca-pabilities for Global Monitoring of the Hydrosphere, Geoscience and Remote Sensing Symposium 2005 (IGARSS ’05), IEEE In-ternational, 8, 5678–5680, 2005.
Wagner, W., Pathe, C., Doubkova, M., Sabel, D., Bartsch, A., Hase-nauer, S., Bl¨oschl, G., Scipal, K., Martinez-Fernandez, J., and L¨ow, A.: Temporal stability of soil moisture and radar backscat-ter observed by the advanced synthetic aperture radar (ASAR), Sensors, 8, 1174–1197, 2008.
Zine, S., Jarlan, L., Frison, P. L., Hiernaux, P., and Rudant, J. P.: Land surface parameter monitoring with ERS scatterometer data over the Sahel: A comparison between agro-pastoral and pastoral areas, Remote Sens. Environ., 96, 438–452, 2005.
Zribi, M., Andre, C., Saux-Picard, S., Descroix, L., Otlle, C., and Kallel, A.: Soil moisture mapping based on ASAR/ENVISAT radar data over a sahelian region. Int. J. Remote, 29, 3547–3565, 2007.