Department of Mechanical and Civil Engineering, Purdue University Northwest, Westville, IN, USA
Received 9 June 2016; accepted 31 July 2016; published 3 August 2016
Copyright © 2016 by authors and Scientific Research Publishing Inc.
This work is licensed under the Creative Commons Attribution International License (CC BY). http://creativecommons.org/licenses/by/4.0/
Abstract
Cranes are used in many industries to transport heavy loads from one position to another. These loads are fastened to a crane hook which makes it a critical aspect of the crane itself. The purpose of this study is to optimize the performance of the crane hook based on stress, geometry, and weight. A single load is considered and multiple cross sections—including square, circular, and trapezoidal—are analyzed. The analysis takes the form of theoretical calculations and finite ele-ment analysis through the use of SOLIDWORKS Simulation. The trapezoidal cross section is deter-mined to be the most efficient and the weight and stress of this cross section are optimized by va-rying the cross sectional parameters.
Keywords
Crane-Hook, Geometric Properties
1. Introduction
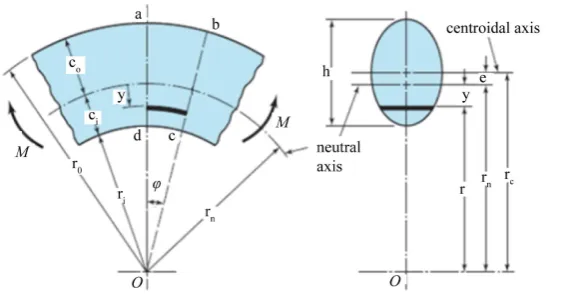
The stress and deflection in the crane hooks for this study are determined both using theoretical calculations as well as finite element analysis simulation in SOLIDWORKS. The theoretical calculations are based on Figure 1 shown below. It is possible to calculate the eccentricity (e) and normal stress (σ) in a curved hook based on Equ-ation (1) and EquEqu-ation (2), respectively. The neutral radius (rn) and eccentricity are determined based on the dif-ferent cross sections shown in Figure 2. Square, trapezoidal, and circular cross sections are considered in this study [1].
c n
e= −r r (1)
(
n)
My Ae r y
σ =
Figure 1.Parameters of a curved hook for stress calculations.
Figure 2. Diagrams and equations for determining the neutral axis and central radius for various cross sections.
2. Results
2.1. Cross Section Selection
The concept of loading a curved beam is used to determine the maximum stress and displacement in multiple cross section shapes including square, circular, and trapezoidal. A common cross sectional area and hook radius are used for all geometric selections and each cross sections centroid lies on the radius of curvature. The cross sections along with the parameters used for testing are shown in Figure 3.
[image:2.595.150.474.256.552.2]Figure 3. Square, circular and trapezoid cross sections and parameters used.
Figure 4. Square cross section normal stress plot.
Figure 5. Circular cross section normal stress plot.
[image:3.595.260.368.479.655.2]Figure 6. Trapezoid cross section normal stress plot.
Figure 7. Square cross section y deflection plot.
[image:4.595.255.370.516.707.2]Figure 9. Trapezoid cross section y deflection plot.
Table 1.Summary of cross section testing.
Cross Section
Normal Stress (psi) Von-Mises (psi)
Displacement (in.)
Maximum Minimum Maximum
Square 27131 −15757 26848 0.0174
Circular 33359 −16970 32418 0.0178
Trapezoidal 20515 −13521 20835 0.0117
2.2. Cross Section Optimization
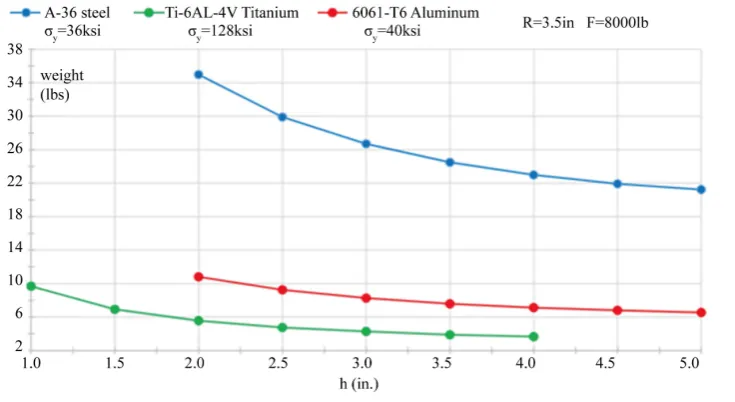
It is possible to determine the optimal geometric properties with the trapezoidal cross section selected. The pa-rameters of the trapezoidal cross section detail in Figure 3 are varied to determine the values that provide the optimal performance. In order to achieve this, the value of the neutral radius (rn) is held constant at 3.5 in, while the values of h, bi, and bo are varied simultaneously. The materials being considered in this optimization are A-36 steel, 6061-T6 Aluminum, and Ti-6AL-4V Titanium and their properties are shown in Table 2 [3]-[5]. By selecting 7 values of the parameter ℎ, it is possible to determine values of bi, and bo such that the weight is mi-nimized and the maximum normal stress is constrained to one half of the materials yield strength (σy). The re-sults of this optimization are shown in Figure 10. Exact parameter values are shown in Tables A1-A3 in Ap-pendix A [6] [7].
3. Conclusions
The results of this research show that for a given cross sectional area, a trapezoid cross section of a hook will have better performance in terms of maximum stress than a circular or square cross section. It is also shown that as the h value of a trapezoidal hook increases, the minimum weight of the hook decreases at a decreasing rate. While the highest value for h will give the lowest weight overall, it is important to keep the proportions of the hook in mind when making the parameter selection. A very large value of h will increase the overall extents of the hook profile and create inefficiencies in packaging and will require a much larger opening on the load that is being moved.
[image:5.595.88.543.316.419.2]Figure 10. Weight optimization results for three different materials.
however is much smaller. This is where the cost of raw materials and the machinability of the material will fac-tor heavily into the material selection decision.
References
[1] Budynas, R.G. and Nisbett, J.K. (2015) Mechanical Engineering Design. McGraw-Hill, New York.
[2] Sahu, G.N. and Yadav, N. (2013) Design and Stress Analysis of Various Cross Section of Hook. International Journal of Modern Engineering Research, 3, 2187-2189.
[3] MatWeb. (n.d.) Aluminum 6061-T6; 6061-T651.
http://www.matweb.com/search/datasheet.aspx?matguid=1b8c06d0ca7c456694c7777d9e10be5b
[4] MatWeb. (n.d.) ASTM A36 Steel, Bar.
http://www.matweb.com/search/datasheet.aspx?matguid=d1844977c5c8440cb9a3a967f8909c3a
[5] MatWeb. (n.d.) Ti-6Al-4V (Grade 5), Annealed.
http://asm.matweb.com/search/SpecificMaterial.asp?bassnum=MTP641
[6] Patel, R.B., Pate, B.K., Pate, P.M., Patel, D.H. and Patel, H.S. (N/A) Design and Analysis of Crane Hook with Differ-ent Material. International Journal of Advanced Computer Technology, 4, 89-93.
[image:6.595.135.503.202.403.2]88.9 88.9 13.46 2.54 440.9 1.76
88.9 101.6 11.18 2.032 438.3 1.66
Table A2.A36 steel optimization.
R (mm) h (mm) bi (mm) b0 (mm) Stress (N/mm2) Weight (kg)
88.9 50.8 113 29.21 124 15.86
88.9 63.5 78.23 19.05 124.1 13.56
88.9 76.2 59.18 13.21 123.9 12.11
88.9 88.9 47.5 9.4 124 11.1
88.9 101.6 39.88 6.86 123.9 10.42
88.9 114.3 34.8 4.826 123.9 9.943
[image:7.595.89.538.136.275.2]88.9 127 31.24 3.302 123.7 9.63
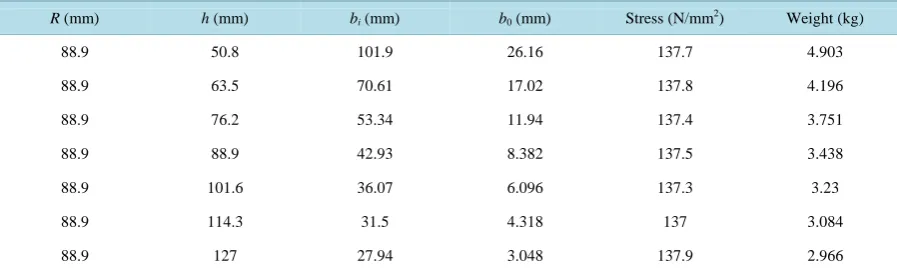
Table A3.6061-T6 aluminum optimization.
R (mm) h (mm) bi (mm) b0 (mm) Stress (N/mm2) Weight (kg)
88.9 50.8 101.9 26.16 137.7 4.903
88.9 63.5 70.61 17.02 137.8 4.196
88.9 76.2 53.34 11.94 137.4 3.751
88.9 88.9 42.93 8.382 137.5 3.438
88.9 101.6 36.07 6.096 137.3 3.23
88.9 114.3 31.5 4.318 137 3.084
[image:7.595.88.537.471.607.2]