Quality as Determinant Factor of Customer Satisfaction:
Case Study of Zain-Kuwait
*
Hasan A Abbas
Department of Information Systems, College of Business Admin, Kuwait University, Kuwait. Email: [email protected]
Received 2013
ABSTRACT
The potential of mobile communications market in Kuwait is enormous. Therefore, I test customer satisfaction in the Kuwaiti mobile market by examining the quality construct. In our study, quality is measured through the dimensions: interaction quality, environment quality, and outcome quality. Our results show that outcome quality is the most in-fluential construct over satisfaction. Also, the results find that interaction quality is not significant and carries no im-portant association with customer satisfaction.
Keywords: Quality; Satisfaction; Structured Equation Modeling
1. Introduction
Kuwait is one of the countries that scores highly in ap-plications of communication technologies and mobile phones market. This market and its services are flourish-ing exponentially. This is not only the case in Kuwait, but, instead, this is true in the whole region as well.
In accordance with new devices and new communica-tion technologies such as smart phones and 4G technolo-gies, the competition is increases and becomes more in-tense in this field. For this reason, companies are com-peting aggressively to keep and increase customer satis-faction.
The goal of this research is to highlight the test and measure the importance of association between the qual-ity construct and customer satisfaction in Kuwaiti mobile market. Specifically, my aim is to present a theoretical research model to explore the degree of satisfaction with a specific mobile service provider (MSP).
The paper is divided into the following sections: communication in the next section. Section 3 presents the theoretical background. Section 4 presents data reduction. Section 5 builds the first model. Section 6 discusses fit-ness of the conceptual model. Sections 7 and 8 comprise a discussion and limitations respectively.
2. The Global and Kuwaiti Communication
Markets
International reports continuously state that worldwide
income of communication sector scored over than a tril-lion and a half dollars in year 2010. This indicator means that an increase of 3.4% over the year before (2009). Also reports show that an increase of 9% in marketing and mobile advertisements has been reached compared to years before recession[31].
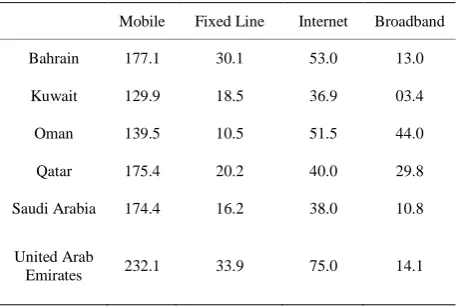
Latest report by International Telecommunication Un-ion (ITU) in 2012 emphasizes the fact that worldwide mobile subscriptions has reached level of 6 billion,(80% of those from developed countries, 660 million new members were added in 2011 )[21].The situation is simi-lar in Kuwait. Based on scientific figures by ITU, mobile subscribers passed landline users by 5.1% [20] (see Ta-ble 1 for Gulf Cooperation Council penetration rates for 2009. Source: [20], [22]).
Table 1. GCC penetration rates for 2009 (per 100 inhabi-tants).
Mobile Fixed Line Internet Broadband
Bahrain 177.1 30.1 53.0 13.0
Kuwait 129.9 18.5 36.9 03.4
Oman 139.5 10.5 51.5 44.0
Qatar 175.4 20.2 40.0 29.8
Saudi Arabia 174.4 16.2 38.0 10.8
United Arab
Emirates 232.1 33.9 75.0 14.1
*
[image:1.595.309.540.579.732.2]Even though Kuwait has lower penetration than some GCC countries, it still considered as one of the highest globally and indicates vast space for potential increase. ITU says that Kuwait stands as one of the highest pene-tration rates worldwide exceeding 150% [22]. “Kuwait, in 62nd position, is the laggard in the region in terms of embracing ICT (Information and Communications Technology). Despite a fairly good ICT-related infra-structure development, the high costs of accessing it and the population’s relatively low level of skills are affect-ing the ICT readiness of the country. As a result, Kuwait depicts fairly poor rates of ICT usage (67th) that, coupled with a less business friendly environment for entrepre-neurship (56th) than other Gulf Cooperation Council states, result in low levels of ICT impacts (93rd).” [14, p. 26].
This is why the investment in Kuwait in this sector is encouraging due to the fact that it has solid market in addition to very complicated and advanced infrastructure, which not utilized fully yet. The three major main playes in mobile sector in Kuwait are Zain, Wataniya, and Viva. Furthermore, there is a very good chance to add fourth competitor if constitutionally passed.
3. Literature Review and Study Constructs
3.1. Satisfaction
One of most critical and strategic goals for any firm is to keep customer satisfaction to its highest levels. Thus, all firms invest great deal of effort and money and to clarify and to continuously modify their strategies to reach this goal. According to the literature, satisfaction is needed for two reasons: because of its close association and ef-fect over customer retention and market share incremen-tal, and, two, because of its ability to increase a firm’s revenue and profits [15], [16].
What is found in the literature is that all firms in the communications market face almost similar challenges and is competing in a standard market. The services con-tinue to become similar and close to each other. This is why firms fight to distinguish themselves through adopt-ing different marketadopt-ing programs and to compete over value-added services [43].
The research and development departments in those firms continuously try hard to figure out and clarify va-gueness among their market. They always aim to uncover constructs that effect mostly on customer satisfaction. Marketing research strongly insists on the positive rela-tion between customer satisfacrela-tion and the future beha-vior and intentions to repurchase the service [8], [11].
According to study by [17], customer satisfaction is not static but instead dynamic, very complicated, and highly reflective of environment. Studies such as [7] and [10] mention that satisfaction can be divided to be
trans-action-specific satisfaction and cumulative satisfaction. First type of satisfaction is related to degree of satisfac-tion that customer feels pertaining a specific transacsatisfac-tion.
The second type of satisfaction is more general. Cu-mulative satisfaction is customer’s overall satisfaction feelings towards general reaction after experiencing many transactions. According to [24], both types of sa-tisfaction (transaction-specific and cumulative) are com-plimentary, which means that they do not contradict each other and the purposes for each type is different [43]. Oliver [34] claims that customer satisfaction has cogni-tive roots and effected by the emotions of the customer (both positive and negative), which are developed from experience and contact with the firm [40], [33], [43], [29].
[29] also [43] define customer satisfaction as “an ef-fective state representing an emotional response”. Dif-ferent researches [32], [7], [11], [28], [30], and [42] stu-died satisfaction before and after experience of transac-tion with firms and reached to a widely acceptance that consumer’s expectation and satisfaction are closely re-lated.
Efforts by [12] and [13] prove that groups of con-structs are directly responsible and positively determine customer satisfaction, those constructs are: system quali-ty, information qualiquali-ty, and service quality. Other studies explored satisfaction and found that satisfaction can also be affected and determined through justice, which is also another important construct [41], [1]. Because of rare research and publications that discuss the associations between satisfaction and quality [43] and in Arab world, this research addresses this side and fills the gap by ex-amining a moderate Arabian culture such as Kuwait.
Satisfaction is known to be the final product and the critical strategic good of any firm. Thus, what strategic look of those firms are continuously following is to keep customer continuation and incremental satisfaction with the firm. All though literature views and clearly concen-trates over the critical relation that relates continuing relationship to customer satisfaction [32], [11], [5] our research do not test the relationships between customer satisfaction and continuing relationship, hoping it will be covered through our future research projects.
3.2. Service Quality
according to this group of studies, is hard to be measured in its standalone status [18], [36]. For example, [18] splits service quality and divides it into two main dimen-sions: technical quality and functional quality. Further-more, [36] introduces his own model and expands service quality into five perspectives as his research framework (reliability, responsiveness, assurance, empathy, and tan-gibility). Their project shows a 22-item instrument called SERVQUAL, result that widely used commercially and scientifically worldwide.
SERVQUAL model is been validated through many projects [9], [27], [43]. This validation emphasized the importance of the multidimensionality of service quality in mobile services. In different terms, this group of stu-dies proposed that service quality of mobile sector con-tains three primary dimensions: interaction quality, out-come quality, and environment quality.
Interaction quality is defined by [27, p. 232] as the “quality of customer’s interaction with the mobile service provider during the service delivery”, which comprises enough and trustful expertise, professional problem solving, and show information richness. Second, Zhao and his colleagues define environment quality as “the consumer’s evaluation of the quality of equipment that is used, the extent to which the interface is well designed, and the extent to which the service is delivered under proper contexts” [43, p. 3]. Finally, [18, p. 38] defines outcome quality as “what the customer is left with when the production process is finished.”
According to previous discussion, study research model is depicted in Figure 1.
4. Sampling and Data Reduction through
Factor Analysis
A special instrument was designed specifically for this study. We asked population to give us their opinion re-garding their mobile service usage. The study instrument measures research constructs: interaction quality, envi-ronment quality, outcome quality, and satisfaction.
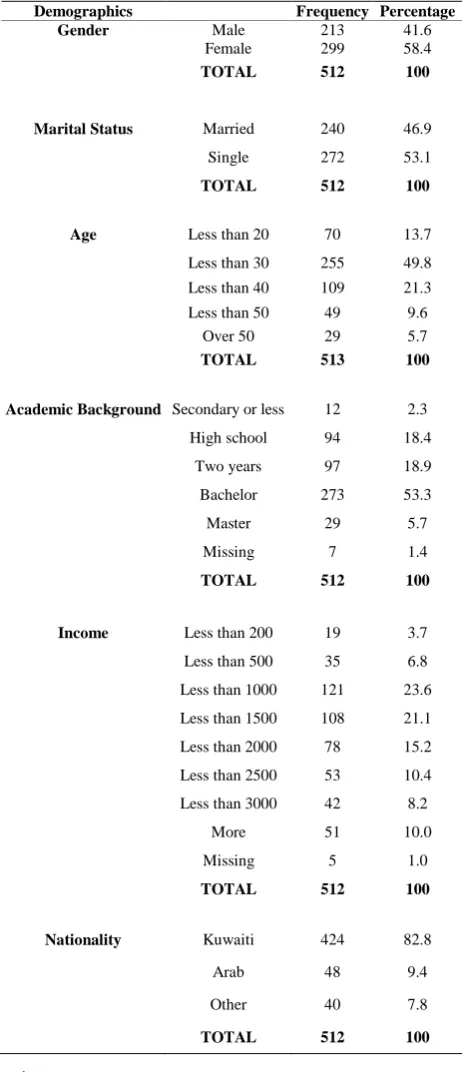
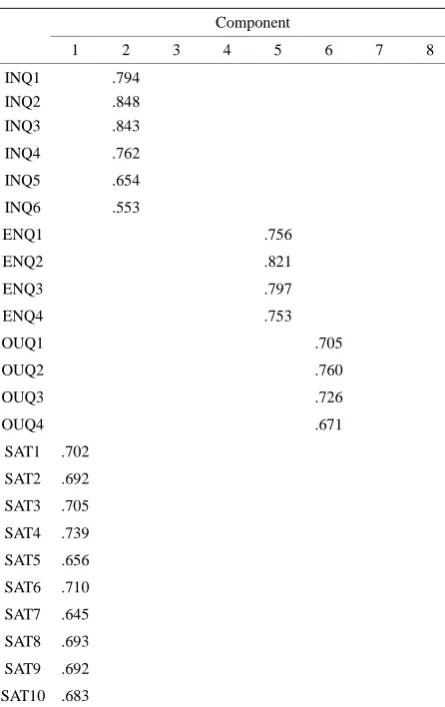
[image:3.595.307.539.101.638.2]Before initiating the data collection stage, a small sample is used to examine the validity of the study ques-tionnaire. After that a random sample size of 512 mobile users are collected. The initial results of reliability coef-ficient for the Cronbach’s alpha show acceptance consis-tency in the instrument. Among study population, 41.6% male (frequency = 213) and 58.4% (frequency = 299) female. The marital status is divided between 46.9% (frequency = 240) married and 53.1% (frequency = 272) single. Table 2 shows the demographics of the sample. Data reduction through factor analysis test is followed in studies to “remove redundancy that might exist be-tween questions within dimension; and third to reveal any patterns that might exist between questions” [2]. Ta-ble 3 shows study factor loadings
Table 2. Demographic distribution of study sample. Demographics Frequency Percentage
Gender Male 213 41.6
Female 299 58.4
TOTAL 512 100
Marital Status Married 240 46.9
Single 272 53.1
TOTAL 512 100
Age Less than 20 70 13.7
Less than 30 255 49.8 Less than 40 109 21.3
Less than 50 49 9.6
Over 50 29 5.7
TOTAL 513 100
Academic Background Secondary or less 12 2.3
High school 94 18.4
Two years 97 18.9
Bachelor 273 53.3
Master 29 5.7
Missing 7 1.4
TOTAL 512 100
Income Less than 200 19 3.7
Less than 500 35 6.8
Less than 1000 121 23.6
Less than 1500 108 21.1
Less than 2000 78 15.2
Less than 2500 53 10.4
Less than 3000 42 8.2
More 51 10.0
Missing 5 1.0
TOTAL 512 100
Nationality Kuwaiti 424 82.8
Arab 48 9.4
Other 40 7.8
TOTAL 512 100
.
5. Conceptual Model
Figure 1 shows study research model followed by the three hypotheses.
The following are research hypotheses:
H1: Interaction quality (INQ) is positively associated with customer satisfaction (SAT).
asso-ciated with customer satisfaction (SAT).
H3: Outcome quality (OUQ) is positively associated with customer satisfaction (SAT).
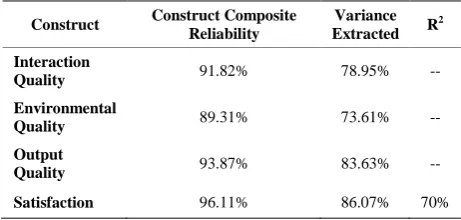
[image:4.595.309.539.144.300.2]Table 4 shows the reliability and explained variance. It is clear from Table 4 that all reliabilities of the study’s measurements above 70%. Also all variances are above 60%. This means that these percentages are acceptable scientifically and conforms to the literature (see for de-tails [19]).
Table 3. Factor loadings of study constructs.
Component
1 2 3 4 5 6 7 8
INQ1 .794
INQ2 .848
INQ3 .843
INQ4 .762
INQ5 .654
INQ6 .553
ENQ1 .756
ENQ2 .821
ENQ3 .797
ENQ4 .753
OUQ1 .705
OUQ2 .760
OUQ3 .726
OUQ4 .671
SAT1 .702
SAT2 .692
SAT3 .705
SAT4 .739
SAT5 .656
SAT6 .710
SAT7 .645
SAT8 .693
SAT9 .692
SAT10 .683
6. Fitness of Conceptual Model and Latent
Constructs Validation
I use the Lisrel 8.54 software to test the goodness of fit of the conceptual model. Table 5 shows the results.
To ensure fitness of our model, Further testing is fol-lowed. According to [19], since Cronbach reliability test expects unidimensionality, “this is why further analysis through construct composite reliability is needed to en-sure that the existence of the internal consistency in the measurements per each construct. The composite relia-bility can be calculated as follows:” [1, p. 12] Variance extracted is another reliability test. “The variance
tracted is used to evaluate the overall amount of ex-plained variations accounted for by the construct” [3]. The composite reliability and variance extracted can be computed as follows:
Figure 1. Research model
Table 4. Explained variance and reliability.
Measurements Cronbach Reliability Coefficient
Explained Variance
1 INQ (1, 2, 3) 88.6% 81.551%
2 ENQ (2, 3, 4) 86.2% 78.417%
3 OUQ (2, 3, 4) 90.6% 84.260%
[image:4.595.59.282.217.571.2]4 SAT (1, 2, 3, 4) 94.4% 85.588%
Table 5. Goodness of fit.
Normed Fit Index (NFI) 0.980
Non-Normed Fit Index (NNFI) 0.980
Incremental Fit Index (IFI) 0.990
Relative Fit Index (RFI) 0.970
Critical N (CN) 192.850
Root Mean Square Residual (RMR) 0.033
Standardized RMR 0.033
Goodness of Fit Index (GFI) 0.900
Adjusted Goodness of Fit Index (AGFI) 0.870 Parsimony Normed Fit Index (PNFI) 0.800
Comparative Fit Index (CFI) 0.990
(
)
(
)
2
2 Composite Reliability Standardized loadings
Standardized loadings error
=
+
∑
∑
∑
(1)
(
)
(
)
2
2 Variance extracted Standardized loadings
Standardized loadings error
=
+
∑
∑
∑
(2)
Table 6 presents these two tests as well as the coeffi-cient for the determination of the R2.
[image:4.595.306.539.350.668.2]mea-surements. “In other words, the questions that are used in the survey should not be overlapped where one question can measure two or more items. The discriminant validi-ty test is acceptable as long as the result is less than or equal to 0.85” [1, p. 12]. It is computed as follows:
( )
, xyx y
Corr x y DV
rel rel
=
[image:5.595.307.538.273.383.2]∗ (3)
Table 7 shows the discriminant validity test results of the research model.
Path Analysis and Verification of Proposed
Research Model
After verifying the goodness of fit of the research model, the study’s hypotheses need to be tested for the signific-ance of the paths between the study’s constructs in the research model.
It is clear from Table 8 and Figure 2 that two out of three of the study hypotheses are verified and found to be significant. An exception is the case of interaction quality. The association between interaction quality and satisfac-tion found to be non-significant.
7. Discussion
Contrary to study of [43], our study does not find any difference between two types of satisfaction (transaction and cumulative). Our study treated both as one satisfac-tion. This non-difference treatment of satisfaction is supported by many studies [42], [23], [4], [25], [26]. Moreover, our study shows difference from studies of [43] and [18] in the quality (different from our study, those two studies measure quality and justice over satis-faction). Except for interaction quality that was not sig-nificant, all other constructs are found to be significant a n d h a v e p o s i t i v e e f f e c t s o n s a t i s f a c t i o n .
8. Conclusions and Limitations
Although different studies show the important associa-tion between satisfacassocia-tion and continuing relaassocia-tionships (see [35] for more references), our aim here is not to fo-cus on continuation but instead to study the effect of quality factor over customer satisfaction. Quality factor is successfully divided into three dimensions and in ac-cordance to the literature, the three dimensions are: inte-raction quality, environment quality, and outcome quality. Although customer satisfaction is discussed in the litera-ture as two types (transaction and cumulative), we here treated it as a one dimension.
Table 6. Construct composite reliability, variance extracted, and coefficient for the determination of R2.
Construct Construct Composite Reliability Extracted Variance R2
Interaction
Quality 91.82% 78.95% --
Environmental
Quality 89.31% 73.61% --
Output
Quality 93.87% 83.63% --
[image:5.595.308.537.420.496.2]Satisfaction 96.11% 86.07% 70%
Table 7. Discriminant validity test results of the research model.
Construct INQ ENQ OUQ SAT
INQ 0.789551a
ENQ 0.386476b 0.736183a
OUQ 0.560085b 0.589734b 0.836361a
SAT 0.521593b 0.539656b 0.758012b 0.860731a
Table 8. Path analysis.
Path Hypotheses Path Coefficient Standard Error t-value p-value Significant or not significant
Interaction Quality (INQ) →
Satisfaction (SAT) H1 0.03 0.04 0.91 0.181 NS
Environment Quality (ENQ)
→ Satisfaction (SAT) H2 0.06 0.04 1.75 0.04 S
Output Quality (OUQ) →
Satisfaction (SAT) H3 0.28 0.05 5.87 0.00 S
Figure 2. Path coefficients of research model.
The study was able to verify two hypotheses out of three. The interaction quality was found to be non-significant.
9. Acknowledgements
Author wants to thank Kuwait Foundation for the Ad-vanced of Sciences for supporting this project. (KFAS 2010-1103-05).
REFERENCES
[1] H. A. Abbas, Trust and Quality as Determinants in TAM: Application of Acceptance Model for E-government in the State of Kuwait. Sent for review to Government In-formation Quarterly. 2013, pp. 1-18.
[2] T. S. Aladwani, “Exploring Service Quality and Custom-er Satisfaction in Kuwaiti Banking Industry: A Compari-son between Islamic and Conventional Banks,” Workshop 18, Islamic and Finance in the GCC. University of Cam-bridge, 2012, July 11-14, 2012.
[3] K. Al-Dosiry, R. Al-Ajmy, D. Madzikanda and H. Hamdy, Organization Creativity Evidence from Banking Sector. Technical Report, Center of Excellence, College of Business Administration, Kuwait University. 2012. [4] S. Aydin and G. Ozer, “The Analysis of Antecedents of
Customer Loyalty in the Turkish Mobile Telecommuni-cation,” European Journal of Marketing, Vol. 39, No. 7/8,
2005, pp. 910-92
[5] A. Bhattacherjee, “An Empirical Analysis of the Antece-dents of Electronic Commerce Service Continuance, De-cision Support Systems,” Vol. 32, No. 2, 2001, pp.
201-214
[6] M. J. Bitner and A. R. Hubbert, “Encounter Satisafcation Versus Overall Satisfaction Versus Quality,” Sage Publi-cations, Thousands Oaks, CA, 1994.
[7] R. N. Bolton and J. H. Drew, A Multistage Model of Customer’S Assessment of Service Quality and Value, Journal of Consumer Research, Vol. 17, No. 4, 1991, pp.
375-3
[8] W. Boulding, A. Kalra, R. Staelin and V. A. Zeithaml, “A Dynamic Process Model of Service Quality: From Ex-pectations to Behavrioral Intentions,” Journal of Market-ing Research, Vol. 30, No. 1, 1993, pp. 7-27.
[9] M. K. Brady and J. Cronin, Some New Thoughts on Conceptualizing Perceived Servie quality: A hierarchical approach. Journal of Marketing, Vol. 65, 2001, pp.
34-
[10] J. J. Cronin and S. A. Taylor, Servperf Versus Servqual: Reconciling Performance-based and Percep-tions-minus-Expectations Measurement of Service Qual-ity, Journal of Marketing, Vol. 58, No. 1, 1994, pp.
125-1
[11] J. J. Cronin, M. K. Brady and G. T. Hult, “Assessing the Effects of Quality, Value, and Customer Satisfaction on Customer Behavioral Intentions in Service Enviro-nemtns,” Journal of Retailing, Vol. 76, No. 2, 2000, pp.
193-2
[12] W. H. De Lone and E. R. McLean, “Information Systems Success: The Quest for the Dependent Variable,” Infor-mation Systems Research, Vol. 3, No. 1, 1992, pp. 60-95.
[13] W. H. DeLone and E. R. McLean, The DeLone and McLean Model of Information Systems Success: A ten-year Update, Journal of Management Information Systems, Vol. 19, No. 5, 2003, pp. 9-30.
[14] S. Dutta, Osorio and B. Benat., “The Global Information Technologu Report 2012: Living in a Hyperconnected World,” World Economic Forum.
[15] C. Fornell, A National Customer Satisfaction Barometer: the Swedish Experience, Journal of Marketing, 56,
Janu-ary, 1992, pp. 6-
[16] C. Fornell, M. D. Johnson, Anderson, E. W. Cha, J. and B. E. Bryant, The American Customer Satisfaction Index: Nature, Purpose, and Findings, Journal of Marketing, 60,
October, 1996, pp. 7-1
[17] J. I. Giese and J. A. Cote, 2000. Defining consumer satis-faction, Academy of Marketing Science Review, Vol. 1. 2000. pp. 1-24.
[18] C. Gronroos, A Service Quality Model and Its Marketing Implicationsm, European Journal of Marketing, Vol. 18, No. 4, 1984, pp. 36-44.
[19] J. F. Hair, R. E. Anderson, R. L. Tatham and W. C. Black, Multivariate Data Analysis, 5th Ed. New York: Prentice Hall. 1998.
[20] ITUc. 2011. International Telecommunication
Un-ion.
[21] ITUd. 2012. Key statistical highlights: ITU Data Release June 2012. International Telecommunication
ion.
[22] ITUe. 2012. Connect Arab Summit. International Tele-communication Union.
[23] M. K. Kim, M. C. Park and D. H. Jeon, “The Effects of Customer Satisfaction and Switching Barrier on Custom-er Loyalty in Korean Mobile Telecommunication saCustom-er- saer-vices,” Telecommunications Policy, Vol. 28, No. 2, 2004,
pp. 145-159
[24] M. D. Johnson,. Customer satisfaction. Appeared in In-ternational Encyclopedia of the Social & Behavioral Sciences, by N. J. Smelser and P. B. Baltes, Elsevier, Amsterdam, The Netherlands, 2001. pp. 3198-3202.
[25] Y. F. Kuo and S., N. Yen, “Towards an Understanding of the Behavioral Intention to Use 3G Mobile Value-added Services,” Computers in Human Behavior, Vol. 25, No. 1,
2009, pp. 103-11
[26] F. Lai, M. Giffin and B. J. Babin, “How Quality, Value, Image, and Satisafaction Create Loyalty at a Chinese Telecom,” Journal of Business Research, Vol. 62, No. 10,
2009, pp. 980-98
5, 2010, pp. 228-24 [28] S. R. Magal, “A Model for Evaluating Information Center
Success,” Journal of Management Information Systems, Vol. 8, No. 1, 1991, pp. 91-106.
[29] V. McKinney, K. Yoon and F. Zahedi, “The Measure-ment of Web-customer Satisfaction: An Expectation and Disconfirmation Approach,” Information Systems Re-search, Vol. 13, No. 3, 2002, pp. 296-315.
[30] S. Muylle, R. Moenaert and M. Despontin, “The Con-ceptualization and Empirical Validation of Web Site User Satisfaction,” Information Management, Vol. 41, No. 5, pp. 543-560.
[31] Ofcom. 2011. International communications Market Re-port.
[32] R. L. Oliver, “A Cognitive Model of the Antecedents and Consequences of Satisfaction Decision,” Journal of Mar-keting Research, Vol. 17, No. 4, 1980, pp.
460-4
[33] R. L. Oliver, “Cognitive Affective and Attribute Bases of the Satisfaction Response,” Journal of Consumer Re-search, Vol. 20, No. 3, 1993, pp. 418-430.
[34] R. L. Oliver, Satisfaction: A Behavioral Perspective on the Consumer. Irwin, McGraw-Hill, Boston, 1997. [35] L. L. Olsen and M. D. Johnson, “Service Equity,
Satis-faction, and Loyalty: From Transaction-specific to Cu-mulative Evaluations,” Journal of Service Research, Vol. 5, No. 3, 2003, pp. 184-195.
[36] A. Parasuraman, V. A. Zeithaml and L. L. Berry, “Reas-sessment of Expectations as A Comparison Standard in Measuring Service Quality: Implications for Future Re-search, Journal of Marketing, Vol. 58, No. 1, 1994, pp.
111-1
[37] K. Rouibah and H. Abbas, “A Modified Technology Ac-ceptance Model for Camera Mobile Phone Adoption: Development and Validation,” 17th Australian Confe-rence on Information Systems, 6-8 December 2006, Ade-laide.
[38] K. Rouibah and H. Abbas, “Effect of Personal Innova-tiveness, Attachment Motivation, and Social Norms on the Acceptance of Cameral Mobile Phones,” Internation-al JournInternation-al of Handheld Computing Research, Vol. 1, No. 4, pp. 41-62, 2010.
[39] K. Rouibah, H. Abbas and S. Rouibah, “Factors Affecting Camera Mobile Phone Adoption before E-shopping in the Arab World,” Technology in Society, Vol. 33, 2011, pp.
271-2
[40] D. H. Shin and W. Y. Kim, “Forecasting Customer Switching Intention in Mobile Service: An Exploratory Study of Predictive Factors in Mobile Number Portabili-ty,” Technological Forecasting and Social Change, Vol. 75, No. 6, 2008, pp. 854-874.
[41] B. Sindhav, J. Holland, A. R. Rodie and P. T. Adidam, and L. G. Pol, “The Impact of Perceived Fairness on Sa-tisfaction: Are Airport Security Measure Fair? Does it matter? Journal of Marketing Theory and Practice, Vol. 14, No. 4, 2006, pp. 323-335.
[42] Y. Wang, “Assessment of Learning Satisfaction with Asynchronous Electronic Learning Systems,” Information Management, Vol. 41, No. 1, 2003, pp.
75-
[43] L. Zhao, Y. B. Lu, L. Zhang, and P. Y. K. Chau. Assess-ing the Effects of Service Quality and Justice on Custom-er Satisfaction and the Continuance Intention of Mobile Value-added Services: An Empirical Test of a Multidi-mensional Model,” Decision Support Systems. Vol. 52,