Munich Personal RePEc Archive
Financing Creative Destruction
Samaniego, Roberto
George Washington University
10 December 2009
Financing Creative Destruction
Roberto M. Samaniego
∗December 23, 2009
Abstract
This paper uncovers evidence of a potentially important channel linking financial
development to growth: thefinancing of innovations introduced by entrepreneurs.
Us-ing internationally comparable data on European countries, entry and exit in
research-intensive industries are found to be disproportionately sensitive to the level offinancial
development. Furthermore,financial development is related to increased R&D
spend-ing. The results are robust to several different measures of financial development, and
are supported by surveys of the sources of finance used by entrepreneurs. The
evi-dence suggests that intellectual property rights provide the institutional underpinning
forfinancial markets to direct funds towards innovative entrepreneurs.
JEL Codes: G18, L26, O14, O16, O31, O33, O34.
Keywords : Entry, exit, financial development, creative destruction, R&D
inten-sity, entrepreneurship, intellectual property rights.
“The banker [. . . ] is essentially a phenomenon of development [. . . ] he makes
possible the carrying out of new combinations [of productive means], authorises
people, in the name of society as it were, to form them.”
Joseph A. Schumpeter, The Theory of Economic Development (1934).
1
Introduction
An important motor of economic growth is thought to be the introduction of innovations
(new or improved products or processes) by entrepreneurs, fuelled by resources provided to
them byfinancial markets.1 However, an empirical link betweenfinance, entry and innovative
activity has proved elusive. Since the institutions that underpin financial development vary significantly across countries, but only gradually over time, uncovering this link requires internationally comparable data. This paper aims to link financial development to entry and innovation using comprehensive, internationally-comparable data on entry, exit and
innovation expenditures, gathered by the European Union.
Key to the empirical strategy in this paper is industry variation. Industry data provide
a natural environment in which to search for evidence of a link between financial develop-ment and innovative entry. Cohen, Levin and Mowery (1987) and Ilyina and Samaniego
(2008)find persistent differences across industries in R&D intensity,2 and Aghion, Fally and
Scarpetta (2007) demonstrate the sensitivity of industry entry rates to measures of fi nan-cial development. If financial development enables costly innovation by entrepreneurs, we would expect financial underdevelopment to be related to reductions in entry primarily in research-intensive industries. Moreover, if financial markets improve the allocation of re-sources across firms by directing capital towards innovative entrepreneurs, we would expect to see disproportionate reductions in exit rates in such industries as well.
1This view is often traced back to Schumpeter (1934) as in the epigraph of this paper. Morales (2003)
and Aghion, Howitt and Mayer-Foulkes (2005) develop models of growth through "creative destruction" fuelled byfinancial markets.
2This is not to say that R&D activity does not also vary significantlywithin industries: see Klette and
The paper measures research intensity using data on publicly traded firms in the United States. In normal times, a typical suchfirm arguably does not experience significantfinancial constraints on its ability tofinance profitable projects, so its propensity to conduct research should be representative of the technological opportunities for research open tofirms in the industry. Industry variation in rates of entry and exit across European countries can then be
exploited to identify whether financial development stimulates entrepreneurship and innov-ative activity particularly in industries that have a greater propensity to conduct research.
Also, using comprehensive survey data from the European Union, I examine whetherfi nan-cial development is related to difficulty in raising external funds for entry and innovation.
The data are based on the universe of legal firms and (unlike most previous studies of firm demographics3) cover both manufacturing and non-manufacturing industries.
Ifind that, in countries with greaterfinancial development, rates of entry are higher in in-dustries with greater research-intensity, supporting the hypothesis of a link betweenfinance, innovation and entrepreneurship. Moreover, the rate ofexit is also disproportionately higher
in such industries. Thus, the availability offinance increases competitive pressure on incum-bents, and this occurs mainly in research-intensive industries. Thesefindings are consistent with the notion that the entry of new firms and the displacement of incumbents together form part of a process of "creative destruction," and that the availability of finance plays a critical role in enabling that process. The results are robust to different measures offinancial development, including measures of financial deepening, measures of the efficiency offi nan-cial markets, and survey-based measures of the availability and sophistication of financial markets.
The paper also finds that financial development disproportionately affects spending on innovation in research-intensive industries, so that innovative (as well as entrepreneurial)
activity is hampered by financial underdevelopment. Thus, financial development does not merely reallocate innovative activity between entrants and incumbents. Indeed, in a
com-3Exceptions include Brandt (2004) and Samaniego (2010), who also use Eurostat entry and exit data but
prehensive survey of startups across Europe, I find thatfinancial development is negatively related to the share of firms that report difficulty in raising external funds as a significant obstacle to innovation.
The importance of financing constraints for research activity raises questions about the role of intellectual property rights (IPRs) in supportingfinancial development. The output of R&D is generally thought of as being non-rival and (in the absence of IPRs) non-excludable
— see Romer (1990). As a result IPRs are thought to be among the institutions that underpin
financial development, since an entrepreneur with a protected idea is less likely to lose the rights to the project through imitation by firms who do not incur the full R&D cost. See Claessens and Laeven (2003) and Biasi and Perotti (2008). Thus, the ability to own (and
voluntarily transfer) ideas may make it easier for entrepreneurs to raise external funds in the
first place. We explore whether IPRs underpin financial development by using measures of IPR protection, including interactions of IPRs with R&D intensity in the industry
regres-sions. We find that an interaction of R&D intensity and IPR protection outperforms the interaction of R&D intensity andfinancial development. This could explain why R&D inten-sive industries are not necessarily industries with high rates of entry and exit in financially developed economies: to the extent that these are also economies with strong IPRs, the
in-ventor and the developer need not be the same person as the idea could be easily transferred
to whoever is most capable (financially or otherwise) of realizing the idea, as suggested by Cagetti and De Nardi (2006). Furthermore, wefind that IPR protection disproportionately increases growth in R&D intensive industries. All this indicates thatfinancial development encourages growth by channeling funds towards innovations introduced by entrepreneurs.
An early debate on the economic role of entrepreneurs can be traced back to Knight
and Schumpeter — see Evans and Jovanovic (1989) for a discussion. Knight (1921) viewed
entrepreneurs who might lack them. An interpretation of the results of this paper is that the
Schumpeterian view is more appropriate for financially developed environments,4 whereas
the Knightian view is adequate for financially underdeveloped environments. Moreover, variation infinancial development appears linked to variation in IPR protection.
The paperfits between an extensive literature onfinancial development and the literature on the determinants of entry and exit. Numerous studies including King and Levine (1993),
Rajan and Zingales (1998) and Bekaert, Harvey and Lundblad (2005) examine the impact
of financial development on growth. However, in spite of the importance for innovation often attributed to the financing of entrepreneurs, direct evidence of this channel of growth is lacking. The sense that there should be a link between technical change, entry and exit
goes back at least as far as Schumpeter (1934), and Geroski (1989), Audretsch (1991) and
others study the link empirically. However, none of these papers studies the role of finance in the process of entry and exit, nor the impact offinance on innovative activity. Carlin and Meyer (2003) document a sensitivity of research spending to thefinancial environment, and the survey of Hall (2005) on the financing of innovation devotes a section to innovation at startups, but neither discusses entry and exit rates themselves, and neither looks at industry
differences.
Brown, Fazzari and Petersen (2009) study the 1990s R&D boom for evidence of a causal
link fromfinance to R&D spending,finding a significant influence of the availability of equity
finance and cashflow on R&D at young (but not at mature) firms. In the current paper, the use of a country-industry panel (instead of a time-firm panel) provides strong confirmation of their results, as well as allowing us to focus specifically on the entry (and exit) of firms. Claessens and Laeven (2003)find that property rights (including intellectual property rights) appear to be an important institutional underpinning for financial development, enhancing growth through improvements in resource allocation. The present paper finds evidence for
4Hurst and Lusardi (2004) also conclude that "even if some households that want to start small businesses
one channel through which this might occur: the replacement of incumbents by innovative
entrants.
A closely related paper is Aghion, Fally and Scarpetta (2007), who ask whether entry is
especially sensitive to financial development in industries where firms are more dependent on external finance. We find that external finance dependence and research intensity are positively linked, and show that similar results for finance dependence can be derived as for R&D intensity: however, the results concerning R&D intensity are more robust in a variety
of ways, consistent with the proposition in Hall (2005) and Ilyina and Samaniego (2008,
2009) that finance dependence results in part from the need to raise funds for research, and that R&D intensive industries not only have a greater need for external finance but also a lower ability to raise it in a financially underdeveloped environment.
Klapper et al (2006) argue that the regulation of entry suppresses entry. I also show that
these results are not simply due to a negative correlation betweenfinancial development and institutional entry costs — although, interestingly, entry costs have similar impact asfinancial underdevelopment. This could be because, for a given level offinancial development (ability to raise funds), high entry costs raise the need for entrepreneurs to raise funds initially.
Nonetheless, the impact of entry costs disappears once we condition for intellectual property
rights.
Section 2 discusses the data to be used in the paper. Section 3 provides motivating
evidence of a link between financial development and constraints on the activity of entre-preneurs and of innovators, based on European survey data. Section 4 reports the results
concerning financial development and industry entry, exit and innovation spending. Section
2
Data
2.1
Data on Industry-country pairs
2.1.1 Entry and exit
Rates of entry, exit and turnover are drawn from the Eurostat Business Demography
data-base, as are data on industry expenditures on innovation. The data cover 28 countries over
the period1997−2006. Eurostat reports data gathered by the national statistical agencies of
the member countries of the European Union concerning the universe of "enterprises" in the
business register, following a common methodology.5 Thus, the data are comprehensive and
internationally comparable. Entering the business register is required to legally produce and
sell goods and services. If an enterprise ceases operations, by law it must notify the business
register within a matter of months. Mergers and changes of legal form are not counted as
entry, nor are temporary shut-downs counted as exit. Thus, the data should adequately
reflect entry and exit rates in the formal sector of each country. As well as coverage and comparability, an advantage of using European data is that the relatively skilled workforces
of European economies, along with the cross-border mobility of labor and goods, imply that
bottlenecks experienced by would-be entrepreneurs are not likely to be driven by the lack of
existence or availability of certain skills or resources, but rather by the inability to acquire
them, for example due to financial constraints.
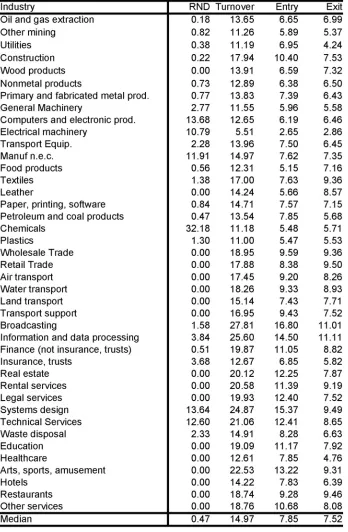
We study the same 41industries as Samaniego (2010).6 This includes15 manufacturing
industries and 26 non-manufacturing industries. Thus, the results of this paper provide a
comprehensive view of the impact offinancial institutions on entrepreneurship and innovation across the economy. Most other studies of entry or innovation focus on manufacturing (e.g.
5An "enterprise" is similar to the US Census Bureau definition of a "firm", except that mergers and
changes of legal status are distinguished from "true" entries and exits. The included countries are all those that reported to Eurostat at the time of the study: participation in the data collection exercise was not mandatory so that, for example, some countries report entry data but not innovation data.
6Samaniego (2010) contains additional details regarding the construction of the Eurostat entry and exit
Dunne, Roberts and Samuelson (1988) and Aghion, Fally and Scarpetta (2007)), which
accounts for less than half of employment and GDP in most countries.
For industry j in countryc, the variable Entryj,c is the proportion of enterprises active
at a given date t that entered since date t−1, and the variable Exitj,c is the number of
enterprises that closed betweent−1andt, divided by the number of establishments active at
date t. The variableT urnoverj,c is the sum of these two variables. All of these are average
rates over the sample period for each country-industry pair, to abstract from short term
conditions and from possible delays in the reporting of entry and exit.7 Since the concept of
creative destruction is related to both entry and exit, for much of the paper we will focus on
the variableT urnoverj,c, but also check that results are robust to consideringEntryj,c and
Exitj,c separately.
For most of the paper, we use turnover, entry and exit for each industry-country pair.
However, for cross-sectional comparisons, the industry index of entry, exit or turnover is
based on the industryfixed effect in a regression of country and industry dummy variables. For example, ifyj,c is entry in industry j in country c, we estimate:
yj,c=αc+δj+εj,c (1)
whereαc andδj are country and industry dummy variables. The index of entry for industry
j is then the coefficientδj, added to the coefficientαc for the median country. See Tables1
and2 for summary statistics at the country and industry level.
2.1.2 Innovation expenditures
Innovation expenditures are based on the European Community Innovation Survey IV,
2002-2005, which was conducted by the European Commission and which is also available through
7In practice these are likely to be short: for example, in the UK enterprises are removed from the business
Eurostat.8 The survey reports expenditure on innovation as a share of net sales over the
period. The survey defines an innovation as:
"a new or significantly improved product (good or service) introduced to the market or the introduction within an enterprise of a new or significantly improved process. Innovations are based on the results of new technological developments,
new combinations of existing technology or the utilization of other knowledge
acquired by the enterprise. Innovations may be developed by the innovating
enterprise or by another enterprise. However, purely selling innovations wholly
produced and developed by other enterprises is not included as an innovation
activity. Innovations should be new to the enterprise concerned. For product
innovations they do not necessarily have to be new to the market and for process
innovations the enterprise does not necessarily have to be the first one to have introduced the process."
The sampling population included all enterprises with 10 or more employees, as well as
many smaller enterprises. Responding firms comprised 45 percent of the universe of firms in the business registries. The survey covers a sample of 181,838 firms. Eurostat reports industry innovation expenditures across enterprises that reported some innovation, which is
about 40 percent of respondingfirms, varying somewhat across countries.
I construct two measures of R&D spending. One is the ratio of innovation expenditures
to sales reported in Eurostat for industry j in country c, called InnovRAW
j,c . As mentioned,
this "raw" data only covers innovatingfirms. The other measure isInnovRAW
j,c multiplied by
the share of innovators in each country, which we call InnovADJ j,c .
8Eurostat suggests that the sampling methodology of earlier surveys may not have been uniform across
2.1.3 Industry growth
Eurostat also reports value-added growth gj,c for each industry-country pair. This is the
meaure of growth used in Rajan and Zingales (1998) to study the interaction between external
finance dependence andfinancial development. Again, we measure it using the average over the period 1997−2006.
2.2
Survey data
I also employ the Eurostat Factors of Business Success survey, to get a sense of the impact
of financial factors on entrepreneurship as perceived by entrepreneurs themselves. While survey results are not available at the industry level, they are useful for painting an overall
picture of the link between finance and innovative activity at startups. The survey covers entrepreneurs responsible for births registered in 2002 that survived to 2005. Data were
gathered in 2005, and cover 338,462 different firms across Europe.
2.3
Data on Industry Characteristics
2.3.1 Research intensity
In what follows, R&D intensity will be regarded as an industry characteristic. This is in
line with Cohen et al (1987), who find that industry dummies account for over half of the variation in research intensity across firms in their sample, and Ilyina and Samaniego (2008) who find that the industry ranking by R&D intensity is stable across decades.
We require an indicator of the "technological" aspect of research intensity in an industry.
The ideal indicator should not be contaminated by, in particular,financing constraints. We draw on data on publicly traded US firms. The presumption is that these firms operate in highly liquid capital markets, so any constraints on profitable investment projects should be minimal, except perhaps in times of crisis — see Rajan and Zingales (1998) and Ilyina
environment should adequately reflect the technological tendency of firms to perform R&D in that firm’s industry.
R&D intensity at the firm level is defined as R&D expenditures divided by value added (DATA 46 divided by DATA 12 in Compustat). This is as in Carlin and Meyer (2003). For
eachfirm, I add the numerator and the denominator over the years 1997-2006. The industry measure is the median firm value, which we call RNDj.9
Table 2 reports that the distribution of RNDj is quite skewed. As a result, in the
multivariate regressions that follow we correct all standard errors for heteroskedasticity by
industry (and country), and later check the robustness of results by bootstrapping, among
other methods.
2.3.2 External finance dependence
External finance dependence (EF Dj) is measured as in Rajan and Zingales (1998), using
the share of capital expenditures that is notfinanced by cashflow from operations. Capital expenditures correspond to DATA 128 in Compustat. Cashflow from operations is defined as cash flow from operations plus changes in payables minus changes in receivables plus changes in inventories, and is computed using DATA 110 and DATA 2, 3 and 70, or DATA
302, 303 and 304 if unavailable. Both capital expenditures and cash flow are summed up over the period 1997−2006 to compute the firm-levelEF Dj measures. The industry-level
measure is the EFD of the median firm.
Tables 1 and 2 report the overall pattern of entry and exit rates across countries and
industries. The cross country mean rate of turnover (and the mean across country-industry
observations) is 17.5 percent. The cross country standard deviation is4.8 percent, whereas
across industry averages observations it is 4.4 percent. Thus there is roughly as much
vari-ation across countries as there is across industries.
9We do not use the CIS IV data to construct measures of "fundamental" industry tendency to perform
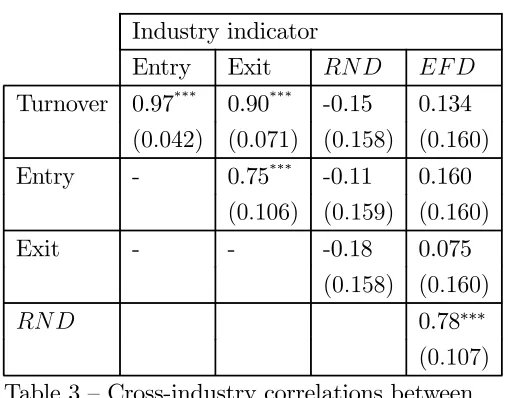
Table3reports that entry, exit and turnover are very highly correlated across industries,
as known since Dunne, Roberts and Samuelson (1988) reported this finding for Manufactur-ing. On the other hand, the correlation between RNDj and turnover is negligible. Thus,
R&D intensity does not appear related to entry and exit rates per se. This implies that any
interaction between R&D and finance leading to differences in turnover should not be due simply to the fact that R&D is itself a determinant of turnover, but rather due to the impact
of financial factors on the ability of firms to conduct business or pursue R&D.
Table 3 shows that EF Dj is very highly correlated with RNDj (although not with
turnover). Thus, to avoid omitted variable bias, we estimate our regressions below replacing
RNDj withEF Dj. If results are stronger forEF Dj than forRNDj, this indicates that it is
the need forfinance (regardless of the purpose) that interacts withfinancial development. If results are stronger forRNDj than forEF Dj, this indicates that it is specifically (or
primar-ily) problems that arise in thefinancing of R&D that interact with financial development.10
TABLES 1−4 ABOUT HERE
2.4
Data on Countries
2.4.1 Financial Development
According to Levine (2005),financial institutions arise to ameliorate market frictions, lower-ing transaction costs and generatlower-ing or distributlower-ing information. The functions of financial institutions are to produce information, allocate capital, monitor investments, allocate risk,
pool savings and ease the exchange of goods and services. As a result, financial institutions naturally affect the allocation of resources across activities and macroeconomic outcomes.
Financial development is defined as an amelioration (although not necessarily elimination) of the effects of information, enforcement and transactions costs, provided by financial
in-10Samaniego (2010)finds a strong link between turnover and investment-specific technical change (ISTC).
However, the correlation between R&D intensity and ISTC as measured in that paper turns out to be only
struments, markets and intermediaries.
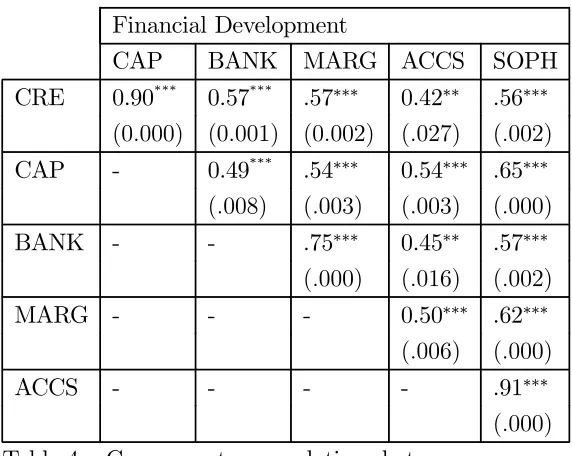
Building on this definition, I employ six differentmeasures of financial development. Using six different measures of financial development, measured in very different ways, adds considerable robustness to the results. All of the measures are positively correlated with
each other — see Table 4.
The prototypical measure offinancial development isfinancial deepening, which is used in King and Levine (1993) and Rajan and Zingales (1998), among others. Deepening is thought
of as indicating development because a larger financial sector indicates a larger number of transactions that are more efficiently dealt with by financial institutions than by dealing directly with the "untreated" transaction costs (or simply avoided).
A second class includes measures of financial development that are based on observed outcomes, but are not directly related to financial deepening. Instead, they indicate other aspects of the the productivity or efficiency of financial intermediaries.
A third class of measures of financial development is based on surveys of executives, which ask regarding the nature and availability of financial services. As such, these may be the broadest measures of the six.
Specifically, the measures are defined as follows.
1. CREc: Our benchmark measure uses the domestic private credit-to-GDP ratio. The
presumption is that financial deepening is the outcome of financial development, as in King and Levine (1993). Domestic credit data come from the IMF International
Financial Statistics (IFS) (domestic credit allocated to the private sector is IFS line
32d). It is measured at the beginning of the period for which we have industry data
(1997) or else the earliest year in the period for which it is available.
2. CAPc: For robustness I also use the domestic capitalization-to-GDP ratio, the sum of
domestic market capitalization and private credit. Although CAP is broader than CRE,
stock market dynamics being driven by factors other than fundamentals, etc.). Such
distortions likely to be particularly severe for the case of transition economies. Hence,
in what follows we use CREc as our benchmark. Market capitalization is reported in
Eurostat. It is measured at the beginning of the period for which we have industry
data (1997) or else the earliest year in the period for which it is available.
3. BANKc: We also use a measure of bank overhead as a share of assets in 1997. This is
aninverse indicator offinancial development (see Beck et al (2000)), as high overhead represents inefficiency in the financial sector. Hence, we multiply it by minus one. It is drawn from the 2006 update of the Beck et al (2000) Database on Financial
Development and Structure.
4. MARGc: Theinterest rate margin is also an inverse indicator offinancial development.
The presumption is that high margins reflect high costs of operation, or an uncompet-itive banking sector. We draw it from the same source as BANKc, and also multiply
it by minus one.
5. ACCSc: We also use some survey-based measures. The World Economic Forum Global
Competitiveness Report (GCR) contains a measure of "loan access". It is based on the
survey question "how easy is it to obtain a bank loan with a good business plan and
no collateral?" on a scale of 1-7. The question was included in the Executive Opinion
Survey, which covers over 12,000 executives in 134 countries. See Browne et al (2007)
for more details.
6. SOP Hc: The GCR also contains a measure of financial market sophistication. It
3
Preliminary evidence: Survey results
To motivate the more detailed industry-level analysis in Section 4, we begin by examining
the results of Europe-wide surveys of startups and of innovators. This is to examine broad
evidence of financing constraints facing entrepreneurs and innovators.
An indication of the role of different sources offinance in entrepreneurship can be obtained from the Factors of Business Success Survey (FBS). In addition, the Community Innovation
Survey IV (CIS) sheds some light on the difficulties suffered by innovatingfirms.
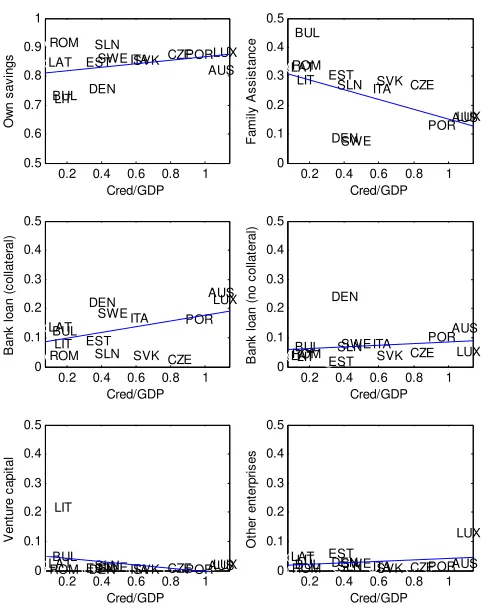
Figure 1 reports the sources of financing tapped by entrepreneurs in the FBS survey. Figure 1 also relates these sources to the private credit/GDP ratio (CRE), a conventional
measure of financial development. It is notable that the entrepreneur’s own resources are a significant source of funds in all countries. At the same time, variation in this dimension is not clearly related tofinancial deepening. This suggests that, in all places, entrepreneurs generally exhaust their own resources and have to seek funds from external sources.
Interest-ingly, while some authors ascribe a central role to venture capital in entrepreneurial activity
in certain industries (for example Hellmann and Puri (2000)), according to the FBS survey
venture capital is not in general a significant source of funds for newfirms.
Two sources of external funds are quantitatively important, both because they are
wide-spread and because variation in the importance of these sources is linked tofinancial devel-opment. These sources are family assistance and bank loans with collateral. The two are
significantly negatively correlated with each other (−64 percent, P-value 1 percent). More-over, the extent to which entrepreneurs rely on family for external funds is negatively related
tofinancial development and, while there are several alternatives for them to seek, the main alternative seems to be bank loans with collateral (Table 5). Thus, financial development allows entrepreneurs to tap new (formal) sources of external finance that would otherwise be limited.
Two further questions on the survey are useful for determining whether financial devel-opment is critical for entrants and, in particular, whether it is critical for innovation by
entrants. One is the answer to the question "Is the highest priority if earnings increase to
pay offloans or credit?" The share of startups responding "yes" to this question is positively
related to the level of financial development — indicating that in financially underdeveloped environments startups may often simply not have access to loans, or thatfirms tend to enter industries that depend less of external finance (such as less R&D intensive industries). An-other is the answer to the question "Was the motivation for the start-up to realize an idea
for an new product or service?" The share of startups responding "yes" to this question is
positively related to financial development — in spite of the possibility of selection effects. See Table6.
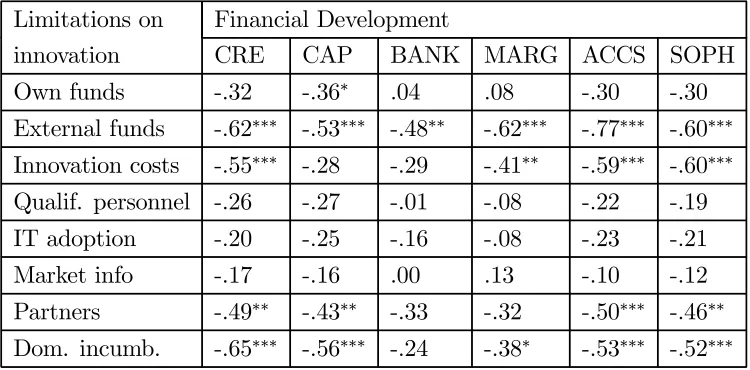
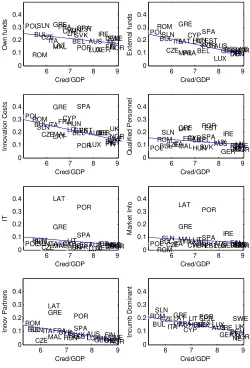
The CIS Survey asks firms what kind of factors severely hamper innovation. Financially developed economies appear much less likely to report the lack of external financing as a difficulty — see Figure 2 and Table 7. Tellingly, they also appear less likely to report
dominance by "established enterprises" as a factor discouraging innovation, consistent with
the idea that financial development stimulates competition by facilitating innovation by entrepreneurs. They also report difficulty finding partners for innovation, suggesting either the unwillingness of established enterprises to cooperate with competitors or, perhaps, that
in underdevelopedfinancial markets property rights enforcement is weak, making it hard for
firms to trust each other with joint control of an intangible asset — see Gans et al (2002). Biais and Perotti (2008) develop a theory whereby successful entepreneurship requires evaulation
of the entrepreneur’s "idea" by several other agents (including financiers), each of whom may try to steal the idea, and their model is consistent with thisfinding.
This discussion suggests that financial development is important for financing new en-terprises, but also for facilitating innovation, particularly at new firms. In what follows, we exploit cross-industry variation in observed entry and exit rates, as well as innovation
4
Country-industry results
4.1
Entry, exit and
fi
nancial development
We wish to ask whether, in financially underdeveloped economies, creative destruction is suppressed particularly in industries that are research-intensive. To test for this pattern, I
adopt the differences-in-differences approach pioneered by Rajan and Zingales (1998). Letyj,c
be the dependent variable for industryj in countryc. Dependent variables include turnover
measures and innovation expenditure measures — but, for concreteness, let us assume it is
the rate of entry. Letαcandδj denote country and industry indicator variables, respectively.
RNDj measures R&D intensity in industry j, and F Dc measures financial development in
countryc. I estimate the equation:
yj,c =αc+δj+βRNDRNDj ×F Dc+εj,c (2)
In specification (2), all country- and industry-specific factors affecting rates of entry are removed. Thus, any policies or regulations that affect entry rates at the country level are
accounted for, as are all industry-specific factors leading to entry and exit. The impact of
financial development on entry (or more broadly on any country-industry outcome variable
yj,c) is then identified by asking whether entry yj,c is particularly susceptible to financial
development in industries depending on their value of RN Dj. In other words, we seek
evidence thatfinancial development affects entry, exit or innovation by asking whether there is a significant interaction between RNDj andF Dc.
Suppose that yj,c is the rate of entry in industry j, country c. If financial development
encourages entrepreneurial activity primarily in industries where RNDj is high, then we
would expect the coefficient βRND on the interaction term between RNDj and F Dc to
in Rajan and Zingales (1998), to deal with the common problem of heteroskedasticity in
fixed effect panels, we apply a White (1980) heteroskedasticity-consistent estimator, which allows the variance of the residual εj,c to vary by country and by industry (as well as by
RNDj ×F Dc).
A potential concern is endogeneity: if there is a lot of entry, it may be that this encourages
greater use of external credit, which is how we measure F Dc. We handle this possibility in
several ways. First, we use a variety of measures of financial development F Dc, including
several that are not based on financial deepening. Second, the fact that the dependent vari-able is defined at the level of the country-industry pair (whereas financial development is a country variable) itself should reduce the possibility of endogeneity. This is precisely the
advantage of the Rajan and Zingales (1998) differences-in-differences approach: all
country-specific factors affecting entry are captured by the country indicator αc, and identification
depends only on industry differences in rates of entry across countries. Third, we estimate
equation(2)using instrumental variables. We use the standard set of instruments forfi nan-cial development, which is legal origin — English, French, German or Scandinavian — as well
as an additional indicator variable for whether the country in question is a post-socialist
transition economy.11 We draw legal origin from the CIA World Factbook: see La Porta et
al (1998) for more on the use of the legal origin instruments.12
The maintained assumption for regression (2)is that R&D intensity is an industry
char-11We use the standard two-stage procedure, where in the first stage, we regress all exogenous variables
(including the instruments) on the interaction of R&D intensity andfinancial development, and then use the predicted values from the first stage to estimate regression equation specification (2) in the second stage. Thefirst stage requires using the interactions of legal origin with industry measures as instruments to predict the interaction term. Using the instruments to predict values offinancial development, and then interacting the predicted values offinancial development with the industry variables in the second stage, does not yield a consistent estimator. See Wooldridge (2002) p236 for a related discussion. It is worth noting that results are similar without instrumental variables, except that coefficients tend to be smaller.
12There is also a question as to whether R&D intensity might be determined by rates of entry (reverse
acteristic the ranking of which persists across countries. For example, if in the United States
firms in Chemicals are more R&D intensive than firms in Textiles, our assumption is that the same holds true in, say, Spain or Estonia. Cohen et al (1987) find that industry dum-mies account for about half of the variation in R&D intensity across firms in their sample, and Ilyina and Samaniego (2008) find that R&D intensity in manufacturing is stable across countries when comparing different decades, suggesting that this is a reasonable assumption.
The coefficient on the interaction term between RNDj and financial development is
positive and significant — see Table 8. This is regardless of whether turnover, entry or exit is the dependent variable in the regression. The fact that RNDj interacts with financial
development to generate differences in both entry and exit rates indicates that financial development supports entrepreneurial activity, but also that it allocates resourcesaway from
incumbents — as per the creative destruction hypothesis. The results are also robust to a
variety of indicators of financial development. The weakest results are those concerning the dependent variable Exitj,c.
To get a sense of the magnitude of these coefficients, consider the following example. The
country with the lowest financial development (according to the measure CREc) is Latvia
(9.1 percent of GDP), and the highest is Switzerland (177 percent). The coefficients imply
that the difference in entry rates between the industries with the highest and lowest R&D
intensity in Latvia is about3.6percentage points smaller than in Switzerland. Since industry
rates of entry vary from2.6 percent to16.8percent, this represents a substantial difference.
Table 8also reports the results of estimating equation (2) where the dependent variable
yj,c equals innovation spending in industry j, country c. These results are strong,
particu-larly for the indicator that is adjusted by the share of innovating enterprises. Thus, financial development is related not only to increased entry, but also to the increased replacement of
incumbents and to increased spending on innovation. Revalling that the country with the
lowest financial development is Latvia and that the highest is Switzerland, the coefficients imply that the difference in innovation spending (using INNOVADJ
indus-tries with the highest and lowest R&D intensity in Latvia is about 6.1 percentage points
smaller than in Switzerland. Since industry R&D intensity varies from 0 to 32.2 percent,
this represents a substantial difference.
TABLE 8 ABOUT HERE
4.2
Robustness
We have already established that the results are robust to different measures of financial development, different indicators offirm turnover and different indicators of innovation.
As mentioned earlier, Aghion, Fally and Scarpetta (2007)find that entry is disproportion-ately sensitive to financial development in industries that are more dependent on external
finance. They use a different data set, that only covers manufacturing and which does not have data for exit nor innovation. We ask whether their results extend to our data set, and
whether the behavior of RNDj is due to bias due to the omission of EF Dc. Since EF Dj
andRNDj are positively related, we estimate
yj,c =αc+δj +βEF DEF Dj×F Dc+εj,c (3)
and check whether the results can be replicated using EF Dj instead ofRNDj.
Results are as follows — see Table 9. First, when we use the full sample that includes
both manufacturing and non-manufacturing, the coefficient βEF D in equation (3) is not
significant. Second, if we restrict ourselves to only look at manufacturing industries as in Aghion, Fally and Scarpetta (2007), we confirm their finding that entry in highly fi nance-dependent manufacturing industries appears sensitive to financial development. Financial development also has a significant impact on innovation spending in high-EFD industries. However, coefficients are all smaller than those forRNDj reported in Table8and, as noted,
indicating that financial need alone is not sufficient for entrepreneurs to have problems raising funds: financial need to finance R&D-intensive projects is critical. This is consistent
with Ilyina and Samaniego (2009), who find that R&D intensity and EF Dj are strongly
related at thefirm level, and also that R&D intensity is related to measures of theinability to raise funds (particularly asymmetric information and asset intangibility indicators, which
may affect thefirm’s ability to raise funds by exacerbating principal-agent problems and by reducing their ability to use their assets as collateral, respectively).
One feature of research intensity at the industry level is that research activity is not
smoothly distributed across industries. For example, the most research-intensive industry
(Chemicals) has a ratio of R&D spending to net sales of 32.2 percent, and the next highest
(Computers and Electronic Products) is13.7percent. Also, several industries have zero R&D
intensity. To ensure that the results are not driven solely by outliers and that the standard
errors are robust to skewness, I estimate several variations of the original specification. First, I eliminate Chemicals from the list of industries. Second, I check whether the results hold
only for manufacturing, as many of the industries with zero R&D intensity are service sector
industries. Third, I estimate the original specification, with bootstrapped standard errors. Fourth, I estimate a "median regression," where absolute deviations (rather than squared
deviations) are minimized by the estimation procedure, again with bootstrapped standard
errors. This approach weights outliers less than "least squares" methods. Table 10 shows
that the results are generally robust to all of these variations of the original specification. To conclude, a number of standard indicators of financial development interact positively with industry research intensity, leading to disproportionate increases in entry, exit and innovative
activity in such industries.
TABLES9−11ABOUT HERE
For the case of investment-specific technical change, Samaniego (2010) suggests that policies that make entry costly may lead innovations to be introduced by incumbents instead of
entrants. If so, an interaction of RNDj with entry costs might carry a negative coefficient
and, if entry costs are negatively correlated with financial development, the significance of
βRND may be misleading. Indeed, startup costs as measured in World Bank (2006) are
negatively related to financial development (although the relationship is only statistically significant forACCScandSOP Hc), indicating thatfinancial development could potentially
be proxying for entry costs.
To check for bias due to the omission of entry costs, we estimate the following:
yj,c =αc+δj +βECRNDRNDj ×ECc+βRNDRNDj ×F Dc+εj,c (4)
Here, as before, yj,c is a measure of turnover or innovative activity in industryj in country
c. ECc is a measure of entry costs, and F Dc is a measure of financial development. There
is a concern regarding measurement error in the policy variables F Dc andECc, so that the
variable with the strongest interaction might simply be the one that is better measured: we
account for this by instrumenting for both policy variables using legal origin, as described
earlier.
Results are reported in Table 11. Interestingly, the interaction with entry costs is indeed
negative (as expected)13 and significant at the 10 percent level or better. This suggests
that entry costs can have an independent impact on turnover in R&D intensive industries,
which would be interesting to explore further in future work. Still, the interaction offinancial development retains its significance, most clearly when innovation spending is the dependent variable. Thus, bothfinancial development and entry costs affect the turnover dimension of creative destruction. This suggests that the interaction of financial development with R&D intensity is robust to several checks, but that it is best to condition on entry costs. Indeed,
13Results are not due to collinearity, as we would expectβEC
the two could be related, since higher entry costs (in the form of direct costs or delays) could
increase the startup cost and hence the financial need of the entrepreneur.
4.3
Property rights and creative destruction
Financial development is viewed as being determined by "deeper" institutions that enable
assets to be used as collateral or that aid contract enforcement — see North (1984) and
Acemoglu and Johnson (2005). In particular, the importance of financial development for R&D intensive industries raises the question of whetherintellectual property rights might be
important for the creative destruction effects identified above.
Property rights institutionsdetermine the extent to which entrepreneurs can control
the use and transfer of the firm’s physical or intangible assets. They may underpin fi nan-cial development because agents may use productive assets as collateral, provided they can
credibly transfer those assets in the event of default. See Kiyotaki and Moore (1997) and
Claessens and Laeven (2003) for further discussion. In addition, even though certain
intan-gible assets may be inherently difficult to collateralize, intellectual property rights may
ensure that the revenues from an intangible investment accrue ultimately to the investor.
An investment project is more valuable, and more able to raise external funds towards its
realization, when the intangibles that delimit the project (the business plan, the product,
the brand name, etc.) are less likely to be stolen or copied by competitors. Also, they might
enable the voluntary transfer of the intangible asset so it too might be used as collateral.
As a result, indicators of IPR protection might be expected to behave similarly to financial development measures in equation2
We study the following IPR protection indicators:
1. P T NTc: Patent enforcement. This applies to patentable (e.g. scientific) knowledge,
such as new products or processes. It is measured as in Ginatre and Park (1997), a
de jure measure of IPR intensity, as updated in 2000. See Property Rights Alliance
2. COP Yc: copyright enforcement. It is based on the Office of the United States Trade
Representative "Special 301" watch list, reflecting piracy rates in the business software, entertainment software, motion picture, record and music industries. We take it to
indicate the protection of organizational and marketing innovations, as well as new
products and processes where some aspect of them might require copyright — including
branding. See Property Rights Alliance (2007).
Table12displays the correlations between the IPR protection indicators and measures of
financial development. COP YcandP T NTcare significantly positively correlated. However,
COP Ycis also strongly correlated with thefinancial development measures, whereasP T NTc
is much less so. This suggests that "soft" IPR protection is more likely to underpinfinancial development than is the protection of more scientific IPRs. This may be intuitive, consid-ering that patents are much more likely to protect intellectual property in some industries
(e.g. Chemicals) than in others (e.g. Restaurants), whereas copyright enforcement protects
intangibles across the board.
We estimate the following equation:
yj,c =αc+δj+βIP RRN DRNDj ×IP Rc+βRN DRNDj ×F Dc+εj,c (5)
Here, as before, yj,c is a measure of turnover or innovative activity in industryj in country
c. IP Rc is a measure of IPR protection, and F Dc is the credit-to-GDP ratio. Wefirst ask
whether there is evidence that IPRs might in fact underpin financial development. We esti-mate (5)using instrumental variables, which is important since IP RcandF Dcare possibly
subject to measurement error. The instrumental variables procedure guarantees consistency
provided the legal origin variables are an adequate instrument for these instututions. We
use the credit-to-GDP ratio as a measure of F Dc: however, results are similar using other
measures ofF Dc.
develop-ment interaction βRND is zero. Results allowing βRND 6= 0 are also reported in Table 13.
We find that an interaction of R&D intensity and IPR strength behaves much the same as the interaction of R&D intensity and financial development, although this depends on the measure of IPRs used. Wefind that bothP T NTcandCOP Ycbehave much the same way as
financial development when βRND = 0 and the dependent variable is firm turnover. More-over, when we allow βRND 6= 0, the estimate for βRN D is not statistically significant. This
supports the hypothesis that property rights underpinfinancial development — in particular, that they help to direct financing towards entrepreneurs in research-intensive industries.
However, when the dependent variable in (5) is innovation spending, we find that the same holds only for COP Yc. In other words it appears that, when it comes to encouraging
innovation spending, "soft" intellectual property rights are more important than IPRs related
to patenting. This could reflect the fact that patenting activity is typically concentrated in certain industries, whereas the IPRs covered by copyright law affect all types of products and
services. Alternatively, it could simply be that there is not as much cross-country variation in
patent enforcement as in "soft" IPR enforcement.14 Notably, when we include an interaction
of R&D intensity with entry costs along with the interaction RNDj×IP Rc, the entry cost
interaction is no longer significant even when the dependent variableyj,c is industry turnover
when we use COP Yc as an indicator of IPR protection.
TABLES 12−14 ABOUT HERE
As a matter of robustness, we check whether this relationship survives the inclusion of
an interaction between RNDj and entry costs. Table 14 reports that the significance of
the IPR interactions is maintained and, moreover, that entry cost interactions are no longer
significant in any of the regressions in which they are matched up against an interaction of
14Thisfinding could explain why R&D intensive industries are not necessarily industries with high rates
RNDj and COP Yc (again, results are instrumented using legal origin variables, to correct
for possible measurement error).
Finally, we have seen that financial development, and IPR protection, appear to en-courage both more turnover and more innovation spending particularly in R&D intensive
industries. However, it is worth asking whether there are any signs that this has an impact
on "real" outcomes. Rajan and Zingales (1998)find that high-EFD manufacturing industries grow disproportionately faster infinancially developed economies, and Ilyina and Samaniego (2008) find that the same is the case for R&D-intensive industries. This suggests that the considerations in this paper may have an impact on economic growth. Eurostat also reports
the growth in value added for each country-industry pair, and we ask whether this is the
case by estimating equation (2) with industry growth as the dependent variable yj,c (as in
Rajan and Zingales (1998) and Ilyina and Samaniego (2008)). We did not find a significant interaction for the measures of financial development, nor forP T NTc, although all
interac-tion coefficients were positive. However, when COP Yc was used as a measure of financial
development, there was a statistically significant interaction of 1.01∗∗ (s.d. 0.143).
Thus, to sum up the results of the paper, the data indicate that IPR protection promotes
growth by enabling entrepreneurs to raise the funds necessary to implement innovations.
5
Concluding Remarks
This paper asks whether there is an impact of financial development upon entry, exit and innovation spending, and whether this impact might be different across industries depending
on their intrinsic R&D intensity. Combined with survey data on the difficulties experienced
by entrepreneurs attempting to innovate, the results provide direct evidence tying financial markets to entrepreneurial and innovative activity. Moreover, they suggest that intellectual
financiers themselves.
Note that it need not be that entrepreneurs in the least financially developed economies are creating new-to-the-world innovations.15 Cohen and Levinthal (1990) argue that a
signif-icant function of R&D is to implement innovations developed at otherfirms, and Branstetter et al (2006)find evidence that multinationals increase technology transfer in response to IPR reform. Thus, the results indicate that IPR protection encourages the financing of R&D to implement innovations regardless of whether they are new-to-the-world or whether they are
developed elsewhere.
We conclude with a brief discussion of these results in light of theoretical work on
intel-lectual property rights (IPRs).
Anton and Yao (1994, 2005) present several papers on the subject of appropriating rents
in environments with weak IPRs. Anton and Yao (1994) discuss a model in which the
developer of an innovation knows more about its quality than potential buyers: this
asym-metric information problem could be surmounted by revealing the idea to the buyer, but in
the absence of IPRs the buyer could then implement the idea without paying: information
revelation leads to expropriation. They find that even in the absence of IPRs the seller can appropriate some of the rents from the innovation by credibly threatening to create a
duopoly, e.g. by threatening to sell the idea to another potential buyer. Anton and Yao
(2005) extend this model by allowing the seller to separately reveal a "portion" β of their
idea, over which they have tightly defined intellectual property rights. They show that a sequential game in which portion β is revealed first and the remainder is then auctioned is better for the developer than the strategy of selling the entire idea at once. Moreover —
although the authors did not emphasize this — the payoff to the developer is increasing in
β. If we interpret β as being determined by IPR protection, and if we view the seller as an
entrant who might sell the rights to the idea as a way of raising funds to implement it,16
15Eaton and Kortum (2001) argue that most innovations originate in a handful of highly-industrialized
countries. Of course, there are well-known exceptions e.g. Skype, which was developed in Estonia.
then we see that more funds can be raised (and appropriated) by an innovative entrant in
the presence of strong IPR protection. One way to think of the interaction of R&D and
finance in the Anton and Yao (2005) context is to consider that R&D intensive industries produce (and disproportionately rely on) intangible assets,17 which are more easily
expropri-ated than tangible assets. Thus, a largerβ might disproportionately help technology transfer
in research intensive industries.
Another useful model for understanding our results is proposed by Biasi and Perotti
(2008). In their model, entrepreneurs require the evaluation of different dimensions of their
projects by "experts".18 Evaluation requires revealing the idea to the expert, which raises
a risk of intellectual property theft as in Anton and Yao (1994). While the identity of
the experts is not important for their model, at least two dimensions along which many
projects need to be evaluated are(a)the scientific or engineering soundness of the underlying innovation and (b) the financial viability of the project. Nanda (2008) finds evidence that externally financed projects tend to be more profitable than internally financed projects, indicating thatfinanciers could themselves be considered a type of "expert" whose financial know-how is critical to evaluating the viability of an innovation. Thus, for simplicity we
can think of two dimensions along which the entrepreneur requires signals as "science" and
"finance."
The key is that projects may not be realized in equilibrium because the experts face a
strong temptation to steal the idea — something we could think of as "weak IPR protection."
If R&D intensive industries are those in which expert evaluation is the most critical (for
example, they are those in which projects depend critically on a "science" signal), then a
prediction of the Biasi and Perotti (2008) model is that entry would be suppressed by weak
IPR protection — as found in this paper. A consequence of weak IPR protection would
be a lack of externally financed projects, and hence less measured credit, leading standard
17See Hall (2005) and Ilyina and Samaniego (2008, 2009).
18This is consistent with the evidence in Lazear (2004, 2005) that entrepreneurs are mostly generalists
measures offinancial development such as the credit-to-GDP ratio or market capitalization dividied by GDP to ultimately proxy for IPR protection.
Ueda (2004) has a similar model in which the entrepreneur’s problem is whether to
finance through a venture capitalist or a bank. Only the entrepreneur knows the quality of the project, and the venture capitalist has a better ability to evaluate the project than
the bank. Thus, contracting with venture capitalists is more efficient. The problem is that
the venture capitalist may expropriate the idea and implement it herself (or at anotherfirm managed by the venture capitalist). Ueda (2004) shows that this becomes harder if IPR
enforcement is better, so that more projects are handled by the venture capitalist. If it is
easier to expropriate the idea in more R&D-intensive industries, and if this ability is sensitive
to IPR enforcement, then IPRs may enable the more efficient handling of ideas (and, in a
general equilibrium world, may encourage their creation).
Finally, Frantzeskakis and Ueda (2007) develop a model which distinguishes explicitly
between incumbents and entrants. They develop a model with a transaction cost for
trans-ferring knowlege, which we could think of as costs imposed by an inefficient IPR protection
regime. Entrants develop ideas and then find out whether they can successfully implement them or not — which also becomes a signal about their future prospects. Thus, entry is a
form of experimentation, whereas established firms already know which ideas they are ca-pable of implementing, and they can thus buy the ideas of entrants who are less suited for
implementation. They find that with low transaction costs in the market for intellectual property, incumbents innovate less relative to entrants but introduce (i.e. purchase) more
innovations relative to entrants — because the cost of passing the idea from an unsuccessful
entrant to an incumbent is lower (as suggested by Cagetti and De Nardi (2005)). In an
envi-ronment of strong IPRs, in which it is less costly to transact intellectual property, entrants
are both more able to introduce innovations themselves, and also more able to enter and sell
innovations to pre-existingfirms. This is consistent with thefinding in Section3that in less
incumbent as an obstacle to innovation — the same applies to the ease of finding partners for innovation. Again, to the extent that IPR protection encourages entry (and the R&D
required for entry), we would expect greaterfinancial deepening in such an economy. The surveyed papers are developed in partial equilibrium. In particular, they are
gener-ally models of entry which abstract from exit — which is both essential to general equilibrium
and to the creative destruction concept. Aghion and Howitt (1992) develop a model of
growth through entry by innovators, and Aghion et al (2005) extend the model to
incorpo-rate credit constraints. In turn, Ilyina and Samaniego (2009) extend their framework to a
multi-industry context. However, these two models are geared towards generating
predic-tions for growth, and have no predicpredic-tions for entry and exit — nor do they have an explicit
notion of intellectual property rights. The results of this paper suggest that the general
equi-librium modeling of the interaction of R&D and finance through IPR enforcement remains a fruitful direction for future research.
6
Bibliography
Anton, James J. and Dennis A. Yao. 1994. Expropriation and Inventions: Appropriable
Rents in the Absence of Property Rights. American Economic Review 84, 190-209.
Anton, James J. and Dennis A. Yao. 2005. Markets for Partially Contractible Knowledge:
Bootstrapping versus Bundling. Journal of the European Economic Association 3(2-3),
745-754.
Acemoglu, Daron, and Simon Johnson. 2005. Unbundling Institutions. Journal of
Polit-ical Economy 113(5), 949-995.
Aghion, Philippe, Thibault Fally and Stefano Scarpetta. 2007. Credit constraints as a
Barrier to the Entry and Post-entry Growth of Firms. Economic Policy 22(52), 731-779.
Aghion, Philippe, Peter Howitt. 1992. A Model of Growth through Creative Destruction.
Aghion, Philippe, Peter Howitt and David Mayer-Foulkes. 2005. The Effect of Financial
Development on Convergence: Theory and Evidence. Quarterly Journal of Economics 120
(1), 173-222.
Audretsch, David B. 1991. New-establishment Survival and the Technological Regime.
Review of Economics and Statistics 73(3), 441-450.
Beck, Thorsten, Asli Demirgüç-Kunt and Ross Levine. 2000. A New Database on
Fi-nancial Development and Structure. World Bank Economic Review 14, 597-605.
Bekaert, Geert, Campbell R. Harvey and Christian Lundblad. 2005. Does financial liberalization spur growth? Journal of Financial Economics 77(1), 3-55.
Biasi, Bruno and Enrico Perotti. 2008. Entrepreneurs and new ideas. RAND Journal of
Economics 39(4), 1105-1125.
Brandt, Nicola. 2004. Business Dynamics in Europe. OECD Science, Technology and
Industry Working Paper 2004/1.
Branstetter, Lee G., Raymond Fisman and C. Fritz Foley. 2006. Do Stronger Intellectual
Property Rights Increase International Technology Transfer? Empirical Evidence from U.S.
Firm-Level Panel Data. Quarterly Journal of Economics 121(1), 321-349.
Brown, James R., Steven Fazzari and Bruce Petersen. 2009. Financing Innovation and
Growth: Cash Flow, External Equity and the 1990s R&D Boom. Journal of Finance, 64(1),
151-185.
Browne, Ciara, Richard Bryden, Mercedes Delgado and Thierry Geiger. 2008. Executive
Opinion Survey: Capturing the Voice of the Business Community. Geneva: World Economic
Forum.
Cagetti, Marco and Mariacristina De Nardi. 2006. Entrepreneurship, Frictions, and
Wealth. Journal of Political Economy 114(5), 835-870.
Carlin, Wendy and Colin Mayer. 2003. Finance, investment, and growth. Journal of
Financial Economics, 69(1), 191-226.
Growth. Journal of Finance 58(6), 2401—2436.
Cohen, Wesley M., Richard C. Levin and David C. Mowery. 1987. Firm Size and R&D
Intensity: A Re-Examination. Journal of Industrial Economics, 35(4), 543-565.
Cohen, Wesley M. and Daniel A. Levinthal. Absorptive Capacity: A New Perspective
on Learning and Innovation. Administrative Science Quarterly 35 (1990), 128-152.
Dunne, Timothy, Mark J. Roberts and Larry Samuelson. 1988. Patterns of Establishment
Entry and Exit in U.S. Manufacturing Industries. RAND Journal of Economics 19(4),
495-515.
Eaton, Jonathan and Samuel Kortum. 2001. Trade in capital goods. European Economic
Review 45(7), 1195-1235.
Evans, David S. and Boyan Jovanovic. 1989. An Estimated Model of Entrepreneurial
Choice under Liquidity Constraints. Journal of Political Economy 97(4), 808-27.
Frantzeskakis, Kyriakos and Masako Ueda. 2007. R&D and Markets for New Knowledge
over Firms’ Life-cycles. Mimeo: University of Wisconsin — Madison.
Gans, Joshua S., David H. Hsu and Scott Stern. 2002. When Does Start-Up Innovation
Spur the Gale of Creative Destruction? RAND Journal of Economics 33(4), 571-586.
Geroski, Paul A. 1989. Entry, Innovation and Productivity Growth. Review of Economics
and Statistics 71(4), 572-578.
Hall, Bronwyn H. 2005. The Financing of Innovation. In Shane, S. (ed.), Blackwell
Handbook of Technology and Innovation Management, Oxford: Blackwell Publishers, Ltd.
Hellmann, Thomas and Manju Puri. 2000. The Interaction between Product Market
and Financing Strategy: The Role of Venture Capital. Review of Financial Studies 13(4),
959-984.
Hurst, Erik and Annamaria Lusardi. 2004. Liquidity Constraints, Household Wealth,
and Entrepreneurship. Journal of Political Economy 112(2), 319-347.
Ilyina, Anna O. and Roberto M. Samaniego. 2008. Technology and Finance.
Ilyina, Anna O. and Roberto M. Samaniego. 2009. A Multi-sector Model of Growth with
Financing Constraints. Mimeo: International Monetary Fund Working Paper 09/119.
King, Robert G. and Ross Levine. 1993. Finance and Growth: Schumpeter Might be
Right. Quarterly Journal of Economics, 108(3), 717-37.
Kiyotaki, Nobuhiro and John Moore. 1997. Credit Cycles. Journal of Political Economy
105(2): 211-48.
Klapper, Leora, Luc Laeven, and Raghuram Rajan. 2006. Entry regulation as a barrier
to entrepreneurship. Journal of Financial Economics 82(3), 591-629.
Klette, Tor Jakob and Samuel S. Kortum. 2004. Innovating Firms and Aggregate
Inno-vation. Journal of Political Economy 112(5), 986-1018.
Knight, Frank H. 1921. Risk, Uncertainty and Profit. New York, NY. Houghton Mifflin.
La Porta, Rafael, Florencio Lopez-de-Silanes, Andrei Shleifer and Robert W. Vishny,
1998. Law and Finance. Journal of Political Economy 106(6), 1113-1155.
Lazear, Edward P. 2004. Balanced Skills and Entrepreneurship. American Economic
Review 94(2), 208-211.
Lazear, Edward P. 2005. Entrepreneurship. Journal of Labor Economics 23(4), 649-680.
Morales, María F. 2003. Financial Intermediation in a Model of Growth through Creative
Destruction. Macroeconomic Dynamics 7(3), 363-393.
Nanda, Ramana. 2008. Entrepreneurship and the Discipline of External Finance.
Har-vard Business School working paper 08-047.
Nelson, Richard R., Winter, Sidney. 1977. In search of Useful Theory of Innovation.
Research Policy 6, 36-76.
Ngai, L. Rachel and Roberto M. Samaniego. 2009. Accounting for Research and
Produc-tivity Growth Across Industries. CEP Discussion Paper 914: London School of Economics.
North, Douglass. 1984. Government and the Cost of Exchange in History. Journal of
Economic History 44, 255-264.
American Economic Review 88(3), 559-586.
Romer, Paul. 1990. Endogenous Technological Change. Journal of Political Economy
98(5), S71-102.
Samaniego, Roberto M. 2010. Entry, Exit and Investment-Specific Technical Change. American Economic Review 100(1).
Schumpeter, Joseph Alois. 1934. The Theory of Economic Development. Translator:
Redvers Opie. Cambridge, MA. Harvard University Press (Orig. pub. 1911).
Ueda, Masako. 2004. Banks versus Venture Capital: Project Evaluation, Screening and
Expropriation. Journal of Finance 69(2), 601-621.
White, Halbert. 1980. A Heteroskedasticity-Consistent Covariance Matrix Estimator
and a Direct Test for Heteroskedasticity. Econometrica 48(4), 817-38.
Wooldridge, Jeffrey M., 2002,Econometric analysis of cross section and panel data. MIT
Press, Cambridge, MA.
Country Turnover Entry Exit InnovRAW InnovADJ
Belgium 14.5 7.0 7.5 2.7 1.4 Bulgaria 19.8 10.4 9.4 2.1 0.3 Czech Rep. 18.1 9.3 8.8 3.5 1.3 Denmark 15.0 7.7 7.3 3.5 1.8
Germany - - - 3.3 2.1
Estonia 19.1 10.5 8.6 2.4 1.2
Ireland - - - 2.4 1.5
Greece - - - 6.2 2.2
Spain 14.6 8.6 6.0 1.5 0.5 France 12.8 7.2 5.6 3.3 1.1 Italy 14.0 7.6 6.4 2.8 1.0
Cyprus - 4.1 - 4.0 1.8
Latvia 21.6 13.6 8.0 -
-Lithuania 20.0 11.9 8.1 2.5 0.7 Luxembourg 16.4 9.6 6.8 2.2 1.1 Hungary 18.2 10.0 8.2 2.3 0.5
Malta - - - 1.7 0.4
Netherl. 16.2 8.4 8.2 2.0 0.7
Poland - - - 2.6 0.7
Portugal 15.3 8.8 6.5 2.1 0.9 Romania 25.3 16.9 8.4 3.4 0.7 Slovenia 13.5 8.0 5.5 - -Slovakia 17.4 9.5 7.9 3.2 0.7
Finland 13.1 7.0 6.1 -
-Sweden 10.9 6.0 4.9 4.7 2.4
UK 21.6 11.1 9.5 -
-Norway 18.4 10.6 7.8 1.8 0.7 Switzerland 7.3 3.5 3.8 - -Table 1 — Summary statistics: Average annual
[image:36.612.150.483.98.627.2]Table 2 — Summary statistics: annual industry rates of R&D intensity and
turnover. R&D intensity is the median ratio of R&D spending to sales. Entry,
Industry indicator
Entry Exit RND EF D
Turnover 0.97∗∗∗ 0.90∗∗∗ -0.15 0.134
(0.042) (0.071) (0.158) (0.160)
Entry - 0.75∗∗∗ -0.11 0.160
(0.106) (0.159) (0.160)
Exit - - -0.18 0.075
(0.158) (0.160)
RND 0.78∗∗∗
[image:38.612.180.434.93.292.2](0.107)
Table 3 — Cross-industry correlations between
turnover measures and industry variables. Rates of
turnover, entry and exit are based on industryfixed effectsδj in equation (1). Standard errors
are in parentheses. In all tables, one, two and three
asterisks represent significance at the10%, 5% and