Spatial and Temporal Variation of Stable Isotopes in
Precipitation across Costa Rica: An Analysis of Historic
GNIP Records
Ricardo Sánchez-Murillo1,2*, Germain Esquivel-Hernández1,3, Kristen Welsh2,4, Erin S. Brooks5, Jan Boll2,5, Rosa Alfaro-Solís1,3, Juan Valdés-González1,3
1Escuela de Química, Universidad Nacional, Heredia, Costa Rica; 2Waters of the West-Water Resources Program, University of
Idaho, Moscow, USA; 3Laboratorio de Química de la Atmósfera, Escuela de Química, Universidad Nacional, Heredia, Costa Rica; 4Division of Research and Development, Centro Agronómico Tropical de Investigación y Enseñanza (CATIE), Turrialba, Costa Rica; 5Department of Biological and Agricultural Engineering, University of Idaho, Moscow, USA.
Email: *[email protected]
Received September 1st, 2013; revised October 1st, 2013; accepted October 8th, 2013
Copyright © 2013 RicardoSánchez-Murillo et al. This is an open access article distributed under the Creative Commons Attribu-tion License, which permits unrestricted use, distribuAttribu-tion, and reproducAttribu-tion in any medium, provided the original work is properly cited.
ABSTRACT
The location of Costa Rica on the Central American Isthmus creates unique microclimate systems that receive moisture inputs directly from the Caribbean Sea and the Pacific Ocean. In Costa Rica, stable isotope monitoring was conducted by the International Atomic Energy Agency and the World Meteorological Association as part of the worldwide effort entitled Global Network of Isotopes in Precipitation. Sampling campaigns were mainly comprised of monthly-inte- grated samples during intermittent years from 1990 to 2005. The main goal of this study was to determine spatial and temporal isotopic variations of meteoric waters in Costa Rica using historic records. Samples were grouped in four main regions: Nicoya Peninsula (2H = 6.6518O − 0.13; r2 = 0.86); Pacific Coast (2H = 7.6018O + 7.95; r2 = 0.99); Carib- bean Slope (2H = 6.9718O + 4.97; r2 = 0.97); and Central Valley (2H = 7.9418O + 10.38; r2 = 0.98). The water me- teoric line for Costa Rica can be defined as 2H = 7.6118O + 7.40 (r2 = 0.98). The regression of precipitation amount and annual arithmetic means yields a slope of −1.6‰ 18O per 100 mm of rain (r2 = 0.57) which corresponds with a temperature effect of −0.37‰ 18O/˚C. A strong correlation (r2 = 0.77) of −2.0‰ 18O per km of elevation was found. Samples within the Nicoya Peninsula and Caribbean lowlands appear to be dominated by evaporation enrichment as shown in d-excess interpolation, especially during the dry months, likely resulting from small precipitation amounts. In the inter-mountainous region of the Central Valley and Pacific slope, complex moisture recycling processes may domi- nate isotopic variations. Generally, isotopic values tend to be more depleted as the rainy season progresses over the year. Air parcel back trajectories indicate that enriched isotopic compositions both in Turrialba and Monteverde are related to central Caribbean parental moisture and low rainfall intensities. Depleted events appear to be related to high rainfall amounts despite the parental origin of the moisture.
Keywords: Stable Isotopes; Costa Rica; Precipitation; GNIP; HYSPLIT Model
1. Introduction
Tropical regions cover approximately 50% of Earth’s landmass and are home to three-quarters of the human population. During the last decade, the scientific com- munity, environmental institutions, governments, and communities have increased their awareness of tropical climate variability based on the premise that changes in regional and global circulation trends may lead to inten-
sification (i.e., greater rainfall intensity) or weakening (i.e., prolonged drought) of the hydrological cycle in par- ticular regions [1]. For example, several studies have shown the potential high vulnerability of tropical eco- systems to increasing mean surface temperatures [2-4]. In addition, extreme climate events could be even more severe than those experienced to date [5]. Climate anomalies will increase the vulnerability of certain re- gions and communities to changes in magnitude, timing, and duration of hydrological responses.
Understanding precipitation patterns, particularly how they differ spatially and temporally, will provide further information on regional and global hydrologic processes and enable better planning and preparation for future potential changes in climate. A better understanding of the factors that control precipitation patterns will inform stakeholders and environmental agencies so that they can prioritize efforts and resources in ungauged basins where potential future droughts or floods may drastically affect ecological assemblages and socio-economic activities. In Central America, many socio-economic activities, espe- cially agriculture, tourism, and hydropower generation, are dependent on seasonal cycles of precipitation. There- fore, in order to determine the interannual variability in precipitation, it is necessary to describe the regional an- nual cycle precisely and examine the mechanisms that control it [6].
Across the globe, spatial variation of stable isotopes in the water cycle occurs due to the movement of air masses and fractionation during phase changes, such as conden- sation and evaporation, creating a directional spatial pat- tern across regions and continents [7]. Light stable iso- tope compositions of tropical meteoric waters have pro- ven to be an important indicator of current climate vari- ability [8-16]. In particular, 18O values have provided novel insights on El Niño/Southern Oscillation dynamics [12,17-19]. In temperate regions, isotopic variations in precipitation frequently have been correlated with mean surface air temperatures [20-25], whereas, in the tropics, several authors have reported “the amount effect” as the main controlling factor [16,24,26,27]. These consistent processes create relatively strong spatial patterns of iso- topic compositions across landscapes [28]. Large-scale regional and global patterns can be depicted through
isoscapes that illustrate the spatial and temporal variation of isotopes over a geographic region.
Despite novel advances to understand stable isotope precipitation dynamics in the tropics, there is consensus among scientists in the published literature [13,16,27] on the urgent need for long-term sampling networks that may lead to a better spatial and temporal resolution, par- ticularly in mountainous regions such as the Central American Continental Divide (CACD). In the CACD orographic effects, moisture recycling and canopy inter- ception, intense evapotranspiration, and microclimates are relevant factors in isotopic variation. Furthermore, recent studies have demonstrated that variations in the stable isotope composition of precipitation occur even between storm events [29-32], emphasizing the impor- tance of event-based sampling.
Stable isotope research in Costa Rica has been limited to date with no studies conducted on a regional scale examining trends in precipitation. Lachniet and Patterson
(2002) [27] provided a preliminary evaluation of 18O and 2H in Costa Rican surface waters (n = 63 from riv- ers and lakes). Their study found regional trends in the isotopic composition of surface waters inversely corre- lated to altitude ranges (−1.4 18O ‰/km) and evapora- tion enrichment, particularly in the northwestern region. Rhodes et al. (2006) studied the seasonal variation of isotopic composition in tropical montane forests of Monteverde’s National Park located on the continental divide. Based on seasonal d-excess variations, the au- thors concluded that water evaporated from land is an important component of the water budget to the region during the transitional and dry seasons. Reynolds and Fraile (2009) [33] conducted a groundwater recharge study on one of the main aquifers of the Central Valley of Costa Rica that provides water to approximately 30% of the population. Based upon precipitation, well, and spring records they were able to identify local recharge areas mainly dominated by Pacific-originated storms. Greater understanding of spatial and temporal isotopic variations in tropical regions with similar topographic, vegetation, and climatic attributes can enhance hydro- logical studies of this nature.
insula to ~7000 mm on the Caribbean side of the Tala- manca range. Temperature seasonality is low. The mean annual temperatures vary from around 27˚C on the coastal lowlands, 20˚C in the Central Valley, and below 10˚C at the summits of the highest mountain range (~4000 m.a.s.l.).
The Global Network for Isotope in Precipitation (GNIP) [36] data set provides isotopic values of precipi- tation from 46 stations across Costa Rica between 1990 and 2005 (intermittent collection over this period). Most of the reported stations were located within the Central Valley (greatest populated area) and the North Pacific region. Therefore, a considerable gap exists along the Pacific and Caribbean shores, continental divide, and the northern and southern regions. Herein, we present an analysis of the spatial and temporal variation of stable isotopes in meteoric waters in Costa Rica and determine which broad climatic or topographic factors may influ- ence isotopic variations across the region. Results of this analysis provide baseline historical spatial-temporal cha- racterization of meteoric waters in Costa Rica that has been lacking to date.
2. Methods and Materials
2.1. Study AreaThe Central Valley is a heavily populated area containing four major cities of Costa Rica located within its bounda- ries (~60% population) along with significant industrial activity. Weather conditions in the valley are mainly in- fluenced by easterly Caribbean trade-winds during the dry season (February-April) and by frequent westerly continental air masses during the wet season (May-Oc- tober). About ~50% of GNIP were located within the valley limits. In this region, mean annual precipitation ranges from ~3500 mm in the highlands to ~2000 mm within the foothills (Figure 2), and the area experiences 3 - 4 dry months over the summer. This inter-mountain- ous valley region has an elevation between 1000 and 2500 meters m.a.s.l, with average temperatures that range from 14˚C to 18˚C. The northern Pacific region of the Nicoya Peninsula receives on average 1500 mm of pre- cipitation and suffers extensive dry periods that can reach up to 6 months. The Caribbean slope is charac- terized by a short dry season (1 - 2 months); mean annual precipitation in this region ranges from 4500 to 6000 mm.
2.2. Historic GNIP Records Analysis
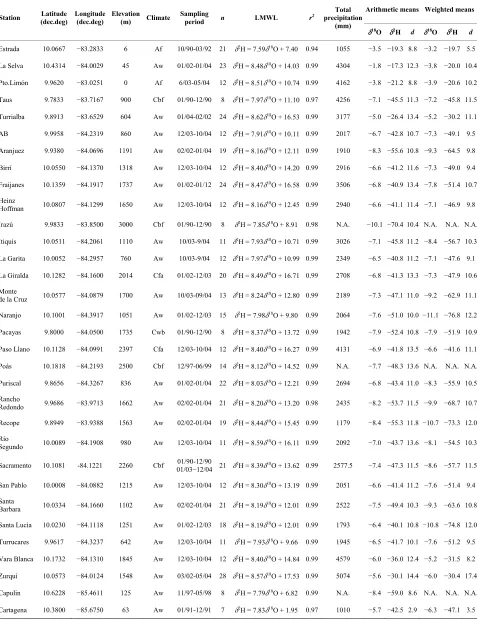
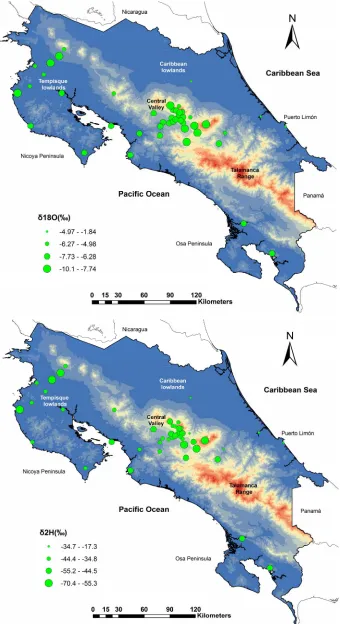
We analyzed stable isotope records (n = 679) of 46 monitoring stations across Costa Rica obtained from the GNIP data base (Table 1, Figure 1). Station altitude ranges from 0 - 3000 m.a.s.l with a mean altitude of 930
m.a.s.l. Sampling frequency was typically monthly ex- cept for one station (Monteverde) where event-based sampling was conducted by Rhodes et al. (2006). The entire data set is comprised of three relative short-term sampling campaigns: 1990-1992, 1997-1998, and 2002- 2005. Weighted 18O and 2H means were calculated for 42 stations (87%). Linear regression analysis of elevation and arithmetic 18O values was conducted considering 18 stations which are unlikely to be influenced by evapora- tion enrichment: La Selva, Turrialba, Santa María, San Pablo, Santa Lucía, Birrí, Monteverde, Zurquí, Heinz Hoffman, Monte de la Cruz, Pacayas, Fraijanes, Vara Blanca, La Giralda, Sacramento, Paso Llano, Poás, and Irazú. Likewise, linear regression analysis of precipita- tion amount and 18O values was determined using data from 11 stations which are representative of all four re- gions: Turrialba, Puriscal, Fraijanes, Orotina, Santa Bar- bara, Rancho Redondo, Puntarenas, Hacienda Tempisque, and Sacramento.
Spatial analysis was conducted using the Atlas of Costa Rica 2008 database [37]. The natural neighbor procedure in ArcGIS 9.3 was applied to calculate deute- rium excess, 18O, and 2H interpolations. High station densities within the Central Valley and Nicoya Peninsula may overemphasize the isotopic signature of these re- gions. Data limitations constrained this and additional analyses. First, the majority of the stations (61%) gener- ally reported isotopic values over a 1 year period with monthly values ranging from n = 4 to 28 with a mean of
n = 15. Second, most of the reported stations were lo- cated within the Central Valley (the most populated area) and the North Pacific region (Figure 1). Therefore, a considerable gap exists along the Pacific and Caribbean shores, continental divide, and the northern and southern regions (Figure 1). Third, there was an omission of tem- perature values which prevented calculation of 18O and temperature correlation.
2.3. HYSPLIT Model Simulations
Table 1. Summary of GNIP stations operated in Costa Rica from 1990 to 2005.
Arithmetic means Weighted means Station (dec.deg) Latitude Longitude (dec.deg) Elevation (m) Climate Sampling period n LMWL r2 precipitation Total
(mm)
18O 2H d 18O 2H d
Estrada 10.0667 −83.2833 6 Af 10/90-03/92 21 2H = 7.5918O + 7.40 0.94 1055 −3.5 −19.3 8.8 −3.2 −19.7 5.5
La Selva 10.4314 −84.0029 45 Aw 01/02-01/04 23 2 H = 8.4818
O + 14.03 0.99 4304 −1.8 −17.3 12.3 −3.8 −20.0 10.4
Pto.Limón 9.9620 −83.0251 0 Af 6/03-05/04 12 2H = 8.5118O + 10.74 0.99 4162 −3.8 −21.2 8.8 −3.9 −20.6 10.2
Taus 9.7833 −83.7167 900 Cbf 01/90-12/90 8 2H = 7.9718O + 11.10 0.97 4256 −7.1 −45.5 11.3 −7.2 −45.8 11.5
Turrialba 9.8913 −83.6529 604 Aw 01/04-02/02 24 2H = 8.6218O + 16.53 0.99 3177 −5.0 −26.4 13.4 −5.2 −30.2 11.1
AB 9.9958 −84.2319 860 Aw 12/03-10/04 12 2
H = 7.9118
O + 10.11 0.99 2017 −6.7 −42.8 10.7 −7.3 −49.1 9.5
Aranjuez 9.9380 −84.0696 1191 Aw 02/02-01/04 19 2H = 8.1618O + 12.11 0.99 1910 −8.3 −55.6 10.8 −9.3 −64.5 9.8
Birrí 10.0550 −84.1370 1318 Aw 12/03-10/04 12 2 H = 8.4018
O + 14.20 0.99 2916 −6.6 −41.2 11.6 −7.3 −49.0 9.4
Fraijanes 10.1359 −84.1917 1737 Aw 01/02-01/12 24 2H = 8.4718O + 16.58 0.99 3506 −6.8 −40.9 13.4 −7.8 −51.4 10.7
Heinz
Hoffman 10.0807 −84.1299 1650 Aw 12/03-10/04 12 2H = 8.1618O + 12.45 0.99 2940 −6.6 −41.1 11.4 −7.1 −46.9 9.8
Irazú 9.9833 −83.8500 3000 Cbf 01/90-12/90 8 2
H = 7.8518
O + 8.91 0.98 N.A. −10.1 −70.4 10.4 N.A. N.A. N.A.
Itiquis 10.0511 −84.2061 1110 Aw 10/03-9/04 11 2H = 7.9318O + 10.71 0.99 3026 −7.1 −45.8 11.2 −8.4 −56.7 10.3
La Garita 10.0052 −84.2957 760 Aw 10/03-9/04 12 2 H = 7.9718
O + 10.99 0.99 2349 −6.5 −40.8 11.2 −7.1 −47.6 9.1
La Giralda 10.1282 −84.1600 2014 Cfa 01/02-12/03 20 2H = 8.4918O + 16.71 0.99 2708 −6.8 −41.3 13.3 −7.3 −47.9 10.6
Monte
de la Cruz 10.0577 −84.0879 1700 Aw 10/03-09/04 13 2H = 8.2418O + 12.80 0.99 2189 −7.3 −47.1 11.0 −9.2 −62.9 11.1
Naranjo 10.1001 −84.3917 1051 Aw 01/02-12/03 15 2 H = 7.9818
O + 9.80 0.99 2064 −7.6 −51.0 10.0 −11.1 −76.8 12.2
Pacayas 9.8000 −84.0500 1735 Cwb 01/90-12/90 8 2H = 8.3718O + 13.72 0.99 1942 −7.9 −52.4 10.8 −7.9 −51.9 10.9
Paso Llano 10.1128 −84.0991 2397 Cfa 12/03-10/04 12 2 H = 8.4018
O + 16.27 0.99 4131 −6.9 −41.8 13.5 −6.6 −41.6 11.1
Poás 10.1818 −84.2193 2500 Cbf 12/97-06/99 14 2H = 8.1218O + 14.52 0.99 N.A. −7.7 −48.3 13.6 N.A. N.A. N.A.
Puriscal 9.8656 −84.3267 836 Aw 01/02-01/04 22 2H = 8.0318O + 12.21 0.99 2694 −6.8 −43.4 11.0 −8.3 −55.9 10.5
Rancho
Redondo 9.9686 −83.9713 1662 Aw 02/02-01/04 21 2H = 8.2018O + 13.20 0.98 2435 −8.2 −53.7 11.5 −9.9 −68.7 10.7
Recope 9.8949 −83.9388 1563 Aw 02/02-01/04 19 2H = 8.4418O + 15.45 0.99 1179 −8.4 −55.3 11.8 −10.7 −73.3 12.0
Río
Segundo 10.0089 −84.1908 980 Aw 12/03-10/04 11 2H = 8.5918O + 16.11 0.99 2092 −7.0 −43.7 13.6 −8.1 −54.5 10.3
Sacramento 10.1081 -84.1221 2260 Cbf 01/0301/90-12/90 −12/04 21 2H = 8.3918O + 13.62 0.99 2577.5 −7.4 −47.3 11.5 −8.6 −57.7 11.5
San Pablo 10.0008 −84.0882 1215 Aw 12/03-10/04 12 2H = 8.3018O + 13.19 0.99 2051 −6.6 −41.4 11.2 −7.6 −51.4 9.4
Santa
Barbara 10.0334 −84.1660 1102 Aw 02/02-01/04 21 2H = 8.1918O + 12.01 0.99 2522 −7.5 −49.4 10.3 −9.3 −63.6 10.8
Santa Lucía 10.0230 −84.1118 1251 Aw 01/02-12/03 18 2H = 8.1918O + 12.01 0.99 1793 −6.4 −40.1 10.8 −10.8 −74.8 12.0
Turrucares 9.9617 −84.3237 642 Aw 12/03-10/04 11 2H = 7.9318O + 9.66 0.99 1945 −6.5 −41.7 10.1 −7.6 −51.2 9.5
Vara Blanca 10.1732 −84.1310 1845 Aw 12/03-10/04 12 2H = 8.4018O + 14.84 0.99 4579 −6.0 −36.0 12.4 −5.2 −31.5 8.2
Zurquí 10.0573 −84.0124 1548 Aw 03/02-05/04 28 2H = 8.5718O + 17.53 0.99 5074 −5.6 −30.1 14.4 −6.0 −30.4 17.4
Capulin 10.6228 −85.4611 125 Aw 11/97-05/98 8 2H = 7.7918O + 6.82 0.99 N.A. −8.4 −59.0 8.6 N.A. N.A. N.A.
Continued
Cóbano 9.6900 −85.1100 160 Aw 01/90-12/90 8 2H = 8.4218O + 13.57 0.98 2400 −6.5 −41.4 10.8 −7.1 −46.3 10.5
Est.
Ecológica 10.6944 −85.3706 340 Aw 11/97-05/98 7 2H = 8.0318O + 8.77 0.95 N.A. −8.2 −57.4 8.5 N.A. N.A. N.A.
Hacienda
Tempisque 10.5000 −85.5300 22 Aw 05/90-07/90 13 2H = 7.8118O + 5.52 0.92 897 −5.2 −35.1 6.5 −6.2 −42.3 7.2
Monte Galan 10.5900 −85.6200 60 Aw 01/90-12/90 8 2H = 6.0618O − 2.69 0.91 1185 −5.4 −35.4 7.8 −6.0 −37.4 10.6
Nosara 9.9667 −85.6667 15 Aw 05/90-06/91 14 2 H = 8.4318
O + 10.89 0.92 1591 −6.3 −42.5 8.2 −6.3 −43.2 7.6
Puerto
Humo 10.3100 −85.3450 10 Aw 01/90-12/90 9 2H = 8.6018O + 14.50 0.99 1374 −6.6 −42.5 10.5 −6.5 −40.8 10.8
Santa María 10.7667 −85.3200 825 Am 01/9701/90-12/92 −12/98 26 2H = 8.0418O + 9.67 0.99 1901 −5.5 −34.8 9.5 −5.9 −38.7 8.6
Santa Rosa 10.3100 −85.8000 25 Aw 01/90-12/90 4 2H = 8.2418O + 13.30 0.99 992 −9.2 −62.1 11.1 −8.6 −57.5 11.5
Golfito 8.6400 −83.1667 15 Af 01/90-12/90 7 2 H = 8.0818
O + 11.60 0.99 2633 −7.0 −44.8 11.0 −7.0 −44.7 11.0
Herradura 9.6667 −84.6333 3 Am 01/90-12/90 8 2H = 8.1818O + 12.32 0.99 3082 −6.9 −44.5 11.1 −7.3 −47.2 11.0
Orotina 9.8870 −84.5387 168 Aw 03/02-01/04 19 2
H = 7.9318
O + 9.70 0.99 2256 −6.3 −40.1 10.1 −8.5 −56.1 11.7
Palmar Sur 8.9500 −83.4600 16 Am 01/90-12/90 8 2H = 8.5018O + 14.17 0.99 3293 −7.6 −50.1 10.4 −7.9 −52.9 10.0
Puntarenas 9.9667 −84.8333 3 Aw 01/93-12/93 01/03-12/04 15 2H = 8.1018O + 12.00 0.99 1443.35 −7.2 −46.7 11.3 −8.9 −59.7 11.6
Monteverde 10.3067 −84.8047 1460 Am 06/03-03/05 42 2H = 8.6018O + 14.28 0.99 N.A. −6.1 −37.9 10.7 N.A. N.A. N.A.
Mean −6.7 −43.2 10.8 −7.4 −49.0 10.3
Max −1.8 −17.3 14.4 −3.2 −19.7 17.4
Min −10.1 −70.4 2.9 −11.1 −76.8 3.5
S.D. 1.4 10.3 2.0 1.8 13.7 2.1
Köppen-Geiger code Aw = tropical wet and dry; Am = tropical trade-wind littoral; Af = tropical rainforest; Cbf = tropical highland; Cfa = humid; Cwb = tropical highland. N.A. = not available.
relative humidity, and elevation of the mixing layer depth were also computed.
2.4. Stable Isotope Analysis
Precipitation was collected on event-basis. Monteverde sampling was carried out during July, August, and Sep- tember of 2011. Turrialba’s sampling period used in this study was from September to December, 2012. The col- lector for individual events consisted of a 10.16 cm plas- tic funnel coupled with a metal filter mesh (i.e., to prevent external contamination). The funnel was connected to 4 L high density polyethylene (HDPE) container. An ap- proximately 3 cm mineral oil layer was added to prevent fractionation according with standard sampling protocols. Later, mineral oil was separated using a 250 - 500 mL separatory funnel. Samples were stored upside down in a HDPE bottles with conic and polyseal inserts and parafilm seals until analysis. Stable isotope analyses were con- ducted at the Chemistry School of the National University (Heredia, Costa Rica) and the Idaho Stable Isotope Laboratory (Moscow, Idaho) using a Cavity Ring Down
Spectroscopy (CRDS) water isotope analyzer L2120-I (Picarro, CA) and L1120-i (Picarro, CA), respectively. Ratios of 18O/16O and 2H/1H are expressed in delta units (‰, parts per mil) relative to Vienna Standard Mean Ocean Water (V-SMOW). The current analytical analyz- ers precision is 0.1‰ 18O/16O and 0.5‰ 2H/1H.
3. Results and Discussion
3.1. PrecipitationFigure 2. Mean annual precipitation throughout Costa Rica with GNIP stations showing precipitation recorded during sam- pling periods.
annually. These precipitation records provide a reliable basis for further stable isotope spatial analysis.
3.2.
18O and
2H Isotopic VariationsStable isotope signatures in precipitation across Costa Rica were variable during the sampling campaigns. 18O composition ranged from −1.8‰ to −10.1‰ with an arithmetic mean of −6.7 ± 1.4 (‰) (Figure 3, Table 1). Weighted 18O values range from −3.2‰ to −11.1‰ with a mean of −7.4 ± 1.8 (‰) (Table 1). Deuterium composition varied from −17.3‰ to −70.4‰ with an arithmetic mean of −43.2 ± 10.3 (‰) (Figure 3, Table 1). Weighted 2H values ranged from −19.7‰ to −76.8‰ with a mean of −49.0 ± 13.7 (‰) (Table 1). Figure 4 shows the regional water meteoric lines for each of the four main regions for the GNIP Stations (Nicoya Penin- sula, Pacific Coast, Caribbean Slope, and Central Valley). The best fit straight line to the data for the Nicoya Pen- insula yields an arithmetic water line equation of 2H = 7.8418O + 7.60 (Figure 4), whereas the weighted mete- oric water line yields a distinct best fit straight line equa- tion of 2H = 6.6518O − 0.13 (Figure 4), likely resulting from small precipitation amounts. For the Pacific Coast, the best fit straight line to precipitation-weighted annual means is 2H = 7.6018O + 7.95 (Figure 4), which is
consistent with the Global Meteoric Water Line (GMWL) of 2H = 818O + 10 [39]. Interestingly, Pacific Coast stations are close to equilibrium conditions rather than exhibiting evaporation enrichment. The Caribbean Slope precipitation-weighted water line 2H = 6.9818O + 4.97 (Figure 4) reflects orographic distillation of Carib- bean-sourced moisture. Overall, the best fit line to the precipitation-weighted data for all regions combined yields a water line of 2H = 7.6118O + 7.40 (r2 = 0.98) which corresponds closely to the GMWL (Figure 5). Enriched values above the annual mean of −6.7‰ 18O were often observed during January to March. The greater variation occurred in May and June when the ITCZ starts its migration over Costa Rica. Towards the middle of the wet season (August, September, and Octo- ber) 18O variation appears to decrease due to increase in precipitation amounts. The intensification of northeast trade winds in December produced a decrease in precipi- tation, and consequently, enrichment in isotopic values (Figure 5).
3.3. The Altitude Effect
Figure 4. Meteoric water lines for four major geographic regions of Costa Rica.
gitudinal transects. For the Caribbean slope, there is an evident orographic distillation effect from Puerto Limón (0 m.a.s.l.) to Taus (900 m.a.s.l.) of −3.5‰ 18O /km. The ~75 km Pacific slope transect from Herradura (3 m.a.s.l.) to Paso Llano (2397 m.a.s.l.) represents a more complex system. For instance, a rainout effect is ob- served up to the Santa Bárbara station (1102 m.a.s.l.) (Figure 6). However, at the two higher elevation stations (Birrí and Heinz Hoffman) isotopic compositions are more enriched, suggesting another moisture source. A similar phenomena is also observed along the Nicoya Peninsula transect of ~66 km from the coast to the Rincón de la Vieja volcano (Figure 6).
Considering the 18 stations mainly from the Central Valley cluster, the correlation of elevation with arithme- tic mean annual 18O is moderately strong (r2 = 0.77). The best fit straight line has a slope of −0.2‰ 18O per 100 m, which is close to the range of 0.1‰ and 0.36‰ reported by Leibungdgut et al. (2009) [40]. Since the altitude effect is the combined result of the temperature
effect and moisture depletion by adiabatic cooling, a temperature effect can be calculated by knowing the at- mospheric lapse rate. Lachniet and Paterson (2002) [27] reported a lapse rate of −5.4˚C/km for the San José area. Therefore, an altitude effect of −0.2‰/km corresponds to −0.37‰/˚C, in agreement with tem- perature effects reported in the pioneer work done by Dansgaard [23].
3.4. The Amount Effect and d-Excess Isoscape
Figure 5. (Top) Meteoric water line for Costa Rica. Contri- butions from all four regions are color coded. Inset: distri- bution of 18O values; (Bottom) Temporal variation of 18O
values.
surface. The slope of the best fit straight line to precipita- tion amount and 18O from 11 stations, which are repre- sentative of the four main regions described previously, was found to be −1.6‰ per 100 mm decrease in rainfall (r2 = 0.57). This effect is clearly present during the times
of lowest precipitation (January to April).
The “amount effect” was also observed in the d-excess isoscape presented in Figure 7. D-excess composition ranged from 2.9‰ to 14.4‰ with an arithmetic mean of 10.8 ± 2.0 (‰) (Table 1, Figure 7). Weighted d-excess
values range from 3.5‰ to 17.4‰ with a mean of 10.3 ± 2.1 (‰) (Table 1, Figure 7). Low d-excess (~3‰) is predominantly present within the Nicoya Peninsula and Caribbean lowlands and may also be a common phe- nomena across the northern lowlands and Nicaragua trough. High d-excess (>17‰) was found in the dense forested areas east of the Central Valley (Zurquí and Irazú mountain range) and the Pacific slope of the Mon- teverde tropical cloud forest (Figure 7), which may in- dicate successive evaporation and precipitation cycles. Based on d-excess values, Rhodes et al. (2006) [43] con- cluded that moisture flux from evaporation is an impor- tant input to the region during the transitional and dry seasons when trade winds from the Caribbean slope dominate. Therefore, it appears that intense moisture recycling processes govern isotopic variations within the
Figure 6. Longitudinal elevation and isotopic transects of Nicoya Peninsula, Pacific and Caribbean slopes.
inter-mountainous regions of Costa Rica.
3.5. Air Mass Back Trajectories and Precipitation Events
Figure 7. Preliminary d-excess isoscape for Costa Rica.
Figure 8. Daily 18O variations in precipitation at Monte-
verde and Turrialba stations.
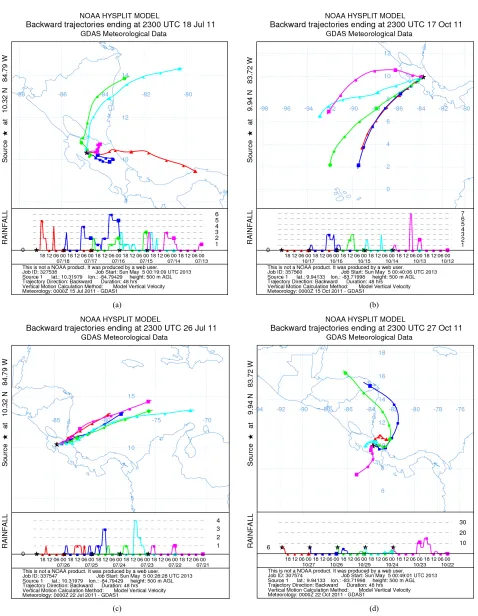
during the wet and transitional seasons (September-De- cember, 2011). Considerably depleted and enriched δ18O values were recorded on 10/17/2011 and 10/27/2011, res- pectively (Figure 8). Figure 9 shows air mass back tra- jectories of five days prior to the depleted or enriched
precipitation event coupled with rainfall intensities. HYSPLIT simulated trajectories indicate that enriched isotopic compositions both in Turrialba and Monteverde correspond to central Caribbean-sourced moisture and small rainfall intensities (Figures 9(a) and (b)). De- pleted events appear to correspond to high rainfall amounts despite the parental origin of the moisture. In the case of Turrialba, the depleted δ18O event was related to continental air masses arriving over Costa Rica from the southwest, producing convective precipitation as they travel along and over the Pacific Coast. Air masses intru- sions from the Pacific Ocean are typically observed dur- ing the wet season and are less frequent when the wet to dry season transition begins in November. The depleted precipitation sampled in Monteverde was related to greater rainfall rates and parental moisture from the southeastern Caribbean basin.
4. Conclusions
[image:11.595.59.289.402.633.2]
(a) (b)
[image:12.595.60.538.85.701.2]
(c) (d)
Figure 9. HYSPLIT model simulations including rainfall intensity in mm/hr. Depleted events: (a) Monteverde 7/18/11 and (b) Turrialba 10/17/11. Enriched events: (c) Monteverde 7/26/11 and (d) Turrialba 10/27/11. Five-day air mass back trajectories
re color coded. a
offer a unique opportunity to study precipitation and ground and surface water processes at a relatively low cost compared to continuous streamflow or climate mo- nitoring, which is often not feasible in tropical devel- oping countries due to high costs and limited resources. Based on historic GNIP records, we conducted a spatial and temporal characterization of stable isotopes in four main geographical regions of Costa Rica: Nicoya Penin- sula, Pacific Coast, Caribbean slope, and Central Valley. Despite data limitations several correlations were found. The regression analysis of precipitation amounts with annual arimethic means in samples from all four regions yields a slope of −1.6‰ 18O per 100 mm of rain (r2 = 0.57), which corresponds with a temperature effect of
−0.37‰ 18O/˚C. A strong correlation (r2 = 0.77) of
−2.0‰ 18O per km of elevation was also found in these data.
D-excess has been identified as a potential indicator of recycled moisture. Therefore, meteoric d-excess iso- scapes coupled with isotopic monitoring in surface wa- ters may provide quantitative estimates of the contri- bution of recycled moisture, which would greatly en- hance our understanding of water budgets in Costa Rica.
D-excess interpolation from 46 GNIP stations suggests that evaporation enrichment often occurs over the Nicoya Peninsula, especially during periods of lowest precipita- tion (January-April). The Nicoya Peninsula, which re- ceives less than 1500 mm annually, has been recently identified [44] as a hydrologically vulnerable region due to the increase of water demand and susceptibility to ex- perience prolonged drought periods. Greater d-excess
values were observed in the inter-mountainous region of the Central Valley and the Pacific slope. It is still un- known if moisture recycling is occurring due to evapora- tion within dense canopy covers (e.g., Zurquí-Irazú or Monteverde areas) or if instead moisture is available from multiple sources such as flood plains, dams or res- ervoirs, or soil moisture. However, this moisture input may play a significant role in late afternoon and over- night convective storms along the Pacific slope.
The illustrative example using the HYSPLIT model indicates that enriched isotopic compositions both in Turrialba and Monteverde are related to central Carib- bean parental moisture and small rainfall intensities. De- pleted events appear to be related to high rainfall amounts despite the parental moisture origin. Further event-based sampling in strategic locations across the country cou- pled with air mass trajectory analysis is needed to evalu- ate the effects of parental moisture origin and isotope signatures. Overall, we believe that this preliminary sta- ble isotope analysis across Costa Rica may provide a useful baseline for future isotopic studies in the region as well as enhance our understanding of moisture recycling
processes within tropical inter-mountainous systems. Further research should evaluate spatial and temporal isotopic variations in surface and groundwater systems to ultimately determine critical recharge zones across the country.
5. Acknowledgements
We thank the International Atomic Energy Agency for granting access to historic GNIP records. A National Sci- ence Foundation-IGERT scholarship (Grant No. 0903479) US Borlaug Fellowship for Food Security supported the isotopic fieldwork in Turrialba, Costa Rica. Funding provided by the Chemistry School at the National Uni- versity of Costa Rica and the National University Coun- cil of Costa Rica was essential to acquire a laser water isotope analyzer. The authors are also grateful for access to the field sites and logistical support by the Tropical Science Center and the Monteverde Cloud Forest Re- serve.
REFERENCES
[1] P. Kabat, R. E. Schulze, M. E. Hellmuth and J. A. Veraart, “Coping with Impacts of Climate Variability and Climate Change in Water Management: A Scoping Paper,” DWC- Report No. DWCSSO-01 International Secretariat of the Dialogue on Water and Climate, Wageningen, 2003. [2] R. K. Colwell, G. Brehm, C. L. Cardelús, A. C. Gilman
and J. T. Longino, “Global Warming, Elevational Range Shifts, and Lowland Biotic Attrition in the Wet Tropics,” Science, Vol. 322, No. 5899, 2008, pp. 258-261.
http://dx.doi.org/10.1126/science.1162547
[3] S. R. Loarie, P. P. Duffy, H. Hamilton, G. P. Asner, C. B. Field and D. D. Ackerly, “The Velocity of Climate Change,” Nature, Vol. 462, No. 7276, 2009, pp. 1052-1055.
http://dx.doi.org/10.1038/nature08649
[4] J. J. Tewksbury, R. B. Huey and C. A. Deutsch, “Putting the Heat on Tropical Animals,” Science, Vol. 320, No. 5881, 2008, pp. 1296-1297.
http://dx.doi.org/10.1126/science.1159328
[5] Y. P. Zhou, K. M. Xu, Y. C. Sud and A. K. Betts, “Re- cent Trends of the Tropical Hydrological Cycle Inferred from Global Precipitation Climatology Project and Inter- national Satellite Cloud Climatology Project Data,” Jour- nal of Geophysical Research, Vol. 116, No. D6, 2011, Article ID: D09101.
http://dx.doi.org/10.1029/2010JD015197
[6] V. Magaña, J. A. Amador and S. Medina, “The Midsum- mer Drought over Mexico and Central America,” Journal of Climate, Vol. 12, No. 6, 1999, pp. 1577-1588.
http://dx.doi.org/10.1175/1520-0442(1999)012<1577:TM DOMA>2.0.CO;2
Process on Earth through Isotope Mapping, Springer Science, New York, 2010, pp. 139-160.
http://dx.doi.org/10.1007/978-90-481-3354-3_7
[8] L. J. Araguás-Araguás, K. O. Froehlich and K. Rozanski, “Stable Isotope Composition of Precipitation over South-east Asia,” Journal of Geophysical Research, Vol. 103, No. D22, 1998, pp. 28721-28742.
http://dx.doi.org/10.1029/98JD02582
[9] K. M. Cobb, J. F. Adkins, J. W. Partin and B. Clark, “Re- gional-Scale Climate Influences on Temporal Variation of Rainwater and Cave Dripwater Oxygen Isotopes in Nor- thern Borneo,” Earth and Planetary Science Letters, Vol. 263, No. 3-4, 2007, pp. 207-220.
http://dx.doi.org/10.1016/j.epsl.2007.08.024
[10] Y. Ishizaki, K. Yoshimura, S. Kanae, M. Kimoto, N. Ku- rita and T. Oki, “Interannual Variability of H218O in Pre-
cipitation over the Asian Monsoon Region,” Journal of Geophysical Research, Vol. 117, No. D16, 2012, Article ID: D16308. http://dx.doi.org/10.1029/2011JD015890
[11] K. R. Johnson and B. L. Ingram, “Spatial and Temporal Variability in the Stable Isotope Systematics of Modern Precipitation in China: Implications for Paleoclimate Re- constructions,” Earth and Planetary Science Letters, Vol. 220, No. 3-4, 2004, pp. 365-377.
http://dx.doi.org/10.1016/S0012-821X(04)00036-6
[12] M. Lachniet, “Sea Surface Temperature Control on the Stable Isotopic Composition of Rainfall in Panama,” Geophysical Research Letters, Vol. 36, No. 3, 2009, Ar-ticle ID: L03701.
http://dx.doi.org/10.1029/2008GL036625
[13] M. Lachniet and W. Patterson, “Oxygen Isotope Values of Precipitation and Surface Waters in Northern Central America (Belize and Guatemala) Are Dominated by Tem- perature and Amount Effects,” Earth and Planetary Sci- ence Letters, Vol. 284, No. 3, 2009, pp. 435-446.
http://dx.doi.org/10.1016/j.epsl.2009.05.010
[14] M. Vuille, R. S. Bradley and F. Keimig, “Interannual Cli- mate Variability in the Central Andes and Its Relation to Tropical Pacific and Atlantic Forcing,” Water Resources Research, Vol. 105, No. D10, 2000, pp. 12447-12460.
http://dx.doi.org/10.1029/2000JD900134
[15] M. Vuille, R. S. Bradley and F. Keimig, “Climatic Vari- ability in the Andes of Ecuador and Its Relation to Tropi- cal Pacific and Atlantic Sea Surface Temperature Anoma- lies,” Journal of Climate, Vol. 13, No. 14, 2000, pp. 2520-2535.
http://dx.doi.org/10.1175/1520-0442(2000)013<2520:CV ITAO>2.0.CO;2
[16] M. Vuille, R. S. Bradley, R. Healy, M. Werner, D. R. Hardy, L. G. Thompson and F. Keimig, “Modeling d18O in Precipitation over the Tropical Americas 2: Simulation of the Stable Isotope Signal in Andean Ice Cores,” Jour- nal of Geophysical Research, Vol. 108, No. D6, 2003, p. 4175. http://dx.doi.org/10.1029/2001JD002039
[17] K. Ichiyanagi and M. D. Yamanaka, “Interannual Varia- tion of Stable Isotopes in Precipitation at Bangkok in Re- sponse to El Niño Southern Oscillation,” Hydrological Processes, Vol. 19, No. 17, 2005, pp. 3413-3423.
http://dx.doi.org/10.1002/hyp.5978
[18] H. O. Panarello and C. Dapeña, “Large Scale Meteoro- logical Phenomena, ENSO and ITCZ, Define the Paraná River Isotope Composition,” Journal of Hydrology, Vol. 365, No. 1-2, 2009, pp. 105-112.
http://dx.doi.org/10.1016/j.jhydrol.2008.11.026
[19] M. Vuille and M. Werner, “Stable Isotopes in Precipita- tion Recording South American Summer Monsoon and ENSO Variability: Observations and Model Results,” Climate Dynamics, Vol. 25, No. 4, 2005, pp. 401-413.
http://dx.doi.org/10.1007/s00382-005-0049-9
[20] P. K. Aggarwal, O. A. Alduchov, K. O. Froehlich, L. J. Araguas-Araguas, N. C. Sturchio and N. Kurita, “Stable Isotopes in Global Precipitation: A Unified Interpretation Based on Atmospheric Moisture Residence Time,” Geo- physical Research Letters, Vol. 39, No. 11, 2012, Article ID: L11705. http://dx.doi.org/10.1029/2012GL051937
[21] L. J. Araguás-Araguás, K. O. Froehlich and K. Rozanski, “Deuterium and Oxygen-18 Isotope Composition of Pre- cipitation and Atmospheric Moisture,” Hydrological Pro- cesses, Vol. 14, No. 8, 2000, pp. 1341-1355.
http://dx.doi.org/10.1002/1099-1085(20000615)14:8<134 1::AID-HYP983>3.0.CO;2-Z
[22] G. Bowen, “Spatial Analysis of the Intra-Annual Varia- tion of Precipitation Isotope Ratios and Its Climatological Corollaries,” Journal of Geophysical Research, Vol. 113, No. D5, 2008, Article ID: D05113.
http://dx.doi.org/10.1029/2007JD009295
[23] W. Dansgaard, “Stable Isotopes in Precipitation,” Tellus, Vol. 16, No. 4, 1964, pp. 436-468.
http://dx.doi.org/10.1111/j.2153-3490.1964.tb00181.x
[24] K. Rozanski, L. J. Araguas-Araguas and R. Gonantini, “Isotopic Patterns in Modern Global Precipitation,” In: P. K. Swart, K. C. Lohmann, J. McKenzie and S. Savin, Eds., Climate Change in Continental Isotopic Records, American Geophysical Union, Washington DC, 1993, pp. 1-36.
[25] L. I. Wassenaar, P. Athanasopoulos and M. J. Hendry, “Iso- tope Hydrology of Precipitation, Surface and Ground Wa- ters in the Okanagan Valley, British Columbia, Canada,” Hydrology, Vol. 411, No. 1, 2011, pp. 37-48.
http://dx.doi.org/10.1016/j.jhydrol.2011.09.032
[26] G. Bowen and J. Revenaugh, “Interpolating the Isotopic Composition of Modern Meteoric Precipitation,” Water Resources Research, Vol. 39, No. 10, 2003, p. 1299.
http://dx.doi.org/10.1029/2003WR002086
[27] M. Lachniet and W. Patterson, “Stable Isotope Values of Costa Rican Surface Waters,” Journal of Hydrology, Vol. 260, No. 1-4, 2002, pp. 135-150.
http://dx.doi.org/10.1016/S0022-1694(01)00603-5
[28] G. J. Bowen, J. B. West and J. Hoogewerff, “Isoscapes: Isotope Mapping and Its Applications,” Geochemical Ex- ploration, Vol. 102, No. 3, 2009, pp. 5-7.
http://dx.doi.org/10.1016/j.gexplo.2009.05.001
http://dx.doi.org/10.1029/2009JD012132
[30] H. Celle-Jeanton, R. Gonfiantini, Y. Travi and B. Sol, “Oxygen-18 Variations of Rainwater during Precipitation: Application of a Rayleigh Model to Selected Rainfalls in Southern France,” Journal of Hydrology, Vol. 289, No. 1-4, 2004, pp. 165-177.
http://dx.doi.org/10.1016/j.jhydrol.2003.11.017
[31] T. B. Coplen, P. J. Neiman, A. B. White, J. M. Landwehr, F. M. Ralph and M. D. Dettinger, “Extreme Changes in Stable Hydrogen Isotopes and Precipitation Characteris- tics in a Landfalling Pacific Storm,” Geophysical Re- search Letters, Vol. 35, No. 21, 2008, Article ID: L21808.
http://dx.doi.org/10.1029/2008GL035481
[32] N. C. Munksgaard, C. M. Wurster, A. Bass and M. I. Bird, “Extreme Short-Term Stable Isotope Variability Revealed by Continuous Rainwater Analysis,” Hydrological Proc- esses, Vol. 26, No. 23, 2012, pp. 3630-3634.
http://dx.doi.org/10.1002/hyp.9505
[33] J. Reynolds-Vargas and J. Fraile, “Use of Stable Isotopes in Precipitation to Determine Recharge Areas within the Barva Aquifer, Costa Rica,” Latinoamerican Stable Iso- topes Studies, International Atomic Energy Agency, Vi- ena, 2006, pp. 83-96.
[34] P. Waylen, C. N. Caviedes and M. F. Quesada, “Interan- nual Variability of Monthly Precipitation in Costa Rica,” Journal of Climate, Vol. 9, No. 10, 1996, pp. 2506-2613.
http://dx.doi.org/10.1175/1520-0442(1996)009<2606:IV OMPI>2.0.CO;2
[35] A. J. Guswa, A. Rhodes and S. E. Newell, “Importance of Orographic Precipitation to the Water Resources of Mon- teverde, Costa Rica,” Advances in Water Resources, Vol. 30, No. 10, 2007, pp. 2098-2112.
http://dx.doi.org/10.1016/j.advwatres.2006.07.008
[36] GNIP, “Global Network of Isotopes in Precipitation,” 2012.
http://wwwnaweb.iaea.org/napc/ih/IHS_resources_gnip.html
[37] Instituto Tecnológico de Costa Rica (ITEC), “Atlas de Costa Rica. Escuela de Ingeniería Forestal. Cartago, Cos- ta Rica,” Digital Atlas, ITEC, Cartago, Costa Rica, 2008. [38] R. R. Draxler and G. D. Rolph, “HYSPLIT-Hybrid Single
Particle Lagrangian Integrated Trajectory Model,” 2013. http://ready.arl.noaa.gov/HYSPLIT.php
[39] H. Craig, “Isotopic Variations in Meteoric Waters,” Sci- ence, Vol. 133, No. 3465, 1961, pp. 1702-1703.
http://dx.doi.org/10.1126/science.133.3465.1702
[40] C. Leibundgut, P. Maloszewski and C. Kulls, “Tracers in hydrology,” Wiley-Blackwell, Oxford, 2009.
[41] R. Gonfiantini, M. A. Roche, J. C. Olivry, J. C. Fontes and G. M. Zuppi, “The Altitude Effect on the Isotopic Composition of Tropical Rains,” Chemical Geology, Vol. 181, No. 1, 2001, pp. 147-167.
http://dx.doi.org/10.1016/S0009-2541(01)00279-0
[42] M. A. Scholl, J. B. Shanley, J. P. Zegarra and T. B. Co- plen, “The Stable Isotope Amount Effect: New Insights from NEXRAD Echo Tops, Luquillo Mountains, Puerto Rico,” Water Resources Research, Vol. 45, No. 12, 2009, Article ID: W12407.
http://dx.doi.org/10.1029/2008WR007515
[43] A. L. Rhodes, A. J. Guswa and S. E. Newell, “Seasonal Variation in the Stable Isotopic Composition of Precipita- tion in the Tropical Montane Forests of Monteverde, Costa Rica,” Water Resources Research, Vol. 42, 2006, Article ID: W11402.
http://dx.doi.org/10.1029/2005WR004535