© 2016, IRJET | Impact Factor value: 4.45 | ISO 9001:2008 Certified Journal
| Page 173
Defects Reduction Using Root Cause Analysis Approach in Gloves
Manufacturing Unit
Kirti Singh
(M.Tech Research Scholar Jagannath University Jaipur)
Avinash Nath Tiwari (
Assistant Professor Deptt. of Mechanical Engineering Jagannath University Jaipur)
Abstract-In this time of globalization, as rivalry increases, providing quality items and administrations has turned into an upper hand and a need to guarantee survival. The Root Cause Analysis has been one of the best methods utilized by industries to enhance the quality of the product and to prevent the defects. This paper intends to exhibit the exact application of Root Cause Analysis to diminish the product defects within a Gloves Manufacturing Unit.
Key words: , Quality, Defects in Gloves Manufacturing Unit. Cause & Effect Diagram (Ishikawa Diagram), Pareto Chart, Root
Cause Analysis (RCA)
I. INTRODUCTION- A Gloves Manufacturing Unit aims at meeting the customer requirement by providing the good quality of product. So many company focuses to reach the global market in satisfying the customer demand. Quality of the product is achieved by minimization of rework, reducing scrap rate and minimizing man hour on rework. Rejections in Gloves manufacturing industry occur due to not placing the product for required specification. Now a day’s rework of rejected parts are common but rework add losses to the company net profit, if the company is a continuous mass production where the products go through a series of process to come out with final product. Gloves manufacturing travels through a sequence of manufacturing processes to become end product. Quality control at every workstation is important. Controlling measures for preventing the defect parts being accepted and sent through next stations need to be avoided to reduce the defect rate in the processing itself. Pareto analysis helps to identify and classify the defect according to percentage significant. Cause and effect diagram is a useful tool in identifying the major causes. This diagram helps to build a relationship. Brainstorming is done with utilizing these quality tools to provide an effective solution. Thus quality management tools are effective and significant in reducing the rework and rejection rate.
II.RUBBER GLOVES MANUFACTURING PROCESSES
Rubber gloves manufacturing processes, and particularly the process studied and investigated in this paper, are generally comprised of seven steps, namely: (1) raw material testing, (2) compounding, (3) dipping, (4)leaching and vulcanizing, (5) stripping and tumbling, (6) quality control and (7) packing. These process steps are illustrated as following:
Step 1. Raw material testing According to Hirsch, raw material testing is important as it prevents the production of out-of-specification products, from which unnecessary expenses can be created. In the case of the Thai gloves manufacturing company studied, the assessment and analysis of raw materials are performed in the factory‘s laboratory, where they are subjected to different detailed and stringent quality tests (i.e. chemical properties testing) before they proceed to the compounding process.
Step 2. Compounding This stage of the process consists of dispersion. This method is prepared by a ball mill technique which is used for blending the chemical substances together with proper monitoring of time and other important aspects. An approved dispersion from the company‘s laboratory is mixed with latex based on its specified formulation. The compound latex is then measured and tested to confirm that it meets the specification requirements, before it is fed to the production line.
coagulant tank, which contains a processed chemical. After having become sufficiently dried, the gloves begin to shape and the moulds are dipped into the compound latex. Both coagulant and compound latex tanks are properly checked for their properties and conditions such as total solid content, temperature, and leveled to ensure that they contain the appropriate components.
Step 4. Leaching and vulcanizing Proper latex gel on moulds are beaded, further dried, and then leached into the pre-leach tan before they are vulcanized to ensure the best physical properties and reduce moisture content. All the gloves are then moved through the pre-leaching and post-leaching processes into treated hot water at around 80 – 90°C with an overflow system. The post-leaching is used to ensure the minimum latex protein level and to remove the extractable water soluble materials, chemical residue and non-rubber particles.
Cyclone tumbling is the final step in the leaching and vulcanizing process. In this step, the gloves are tumbled, with temperature and time critically controlled to reduce powder content and moisture to a minimum level.
Step 5. Stripping and tumbling After the leached gloves are dipped into a closely controlled wet slurry tank to build up bacterial and protein content, the gloves are finally stripped from the formers with auto-stripping lines.
Step 6. Quality control The quality control process is performed by random sampling after all products have been finished. The products are inspected by several methods. The first method is called airtight inspection. In this method, air blowers are used to investigate whether the air is coming out from the gloves by looking for pin holes which might appear on the glove‘s surface, if so, these gloves are rejected. In this type of inspection, the air stays in the gloves for approximately one hour. The second quality control method to which gloves are subjected is watertight test. This method is fundamentally similar to airtight inspection but in this case water is poured inside the gloves instead of the air. The third quality control method consists of a visual inspection to check for stain marks on the gloves and/or misshaped gloves. Defective gloves are rejected. Lastly, size, thickness and aesthetic appeal are also inspected to ensure that the form of the gloves is in accordance with specifications.
Step 7. Packing The gloves packing area is under a tight controlled dust free environment by using a hygienic filtered air system. Packing operators have a role to perform one last visual inspection and remove defective products before packing the gloves. A hundred pieces of a specific size are first weighed and such weight is made up for packing per box. Finally, the boxes are loaded into cardboard boxes and delivered to customers.
III.LITERATURE REVIEW
The key to the vast storehouse of published literature may open doors to sources of significant problems and explanatory hypothesis and provide helpful orientation for definition of the problem, background for selection of procedure and comparative data for interpretation of results. In order to be creative and original one must read extensively and critically as a stimulus to thinking. Every research begins from where the previous researches have left it, and goes forward, may be one inch or even less, towards finding the solution of a problem or answer to a question.
M.A. Khattak et al (2016) identified the most probable cause of the pipe failure. It was conducted by reviewing the existing design, construction data and pipe material analysis using non-destructive techniques such as VT, PT, MT and UT along with metallographic, hardness and microscopic analysis. The investigation revealed that excessive material loss has occurred in both failure and its adjacent regions due to abrasive grinding, resulting in the formation of a through thickness flaw. These grindings were performed to accommodate the preinstalled piping spool to avoid alteration in the pipe position. RCA demonstrated that this rapid thinning of the steel pipe body later led to its failure. Metallurgical study using photomicrograph shows that the morphology of the steel material was consistent and did not show any evidence of internal corrosion or micro fractures. Further damage to the surface of already excessively reduced thickness occurred due to nominal pipe vibration and atmospheric effect during service. The research work described in the paper has a significant meaning to recognize the root cause of such failures in CS pipes and through given recommendations to eliminate future such happenings.
© 2016, IRJET | Impact Factor value: 4.45 | ISO 9001:2008 Certified Journal
| Page 175
Ashwini.A et al (2015) in their research paper “Rejection Analysis in Piston Manufacturing Unit” Rejection Analysis is a process of identification of quality and productivity related problems which the key factors in manufacturing process. The application of rejection analysis allows studying the failed parts. It helps to capture the minute failing details. It provides effective suggestion to the problem encountered in manufacturing process. It eliminates the scrap and tells which part can be rework. After preliminary study on machining process of piston in 6M production line at FEDERAL MOGUL GOETZE INDIA LTD, it was apparent that production line was having more defect and rework and had rejection percentage rate of about 10% .In order to examine this project, study was conducted to observe the process going on in the production line, to reduce the rejection rate by tracking the root causes and by providing suggestion. Some of tools and techniques used to achieve the objectives were check sheet, Pareto chart, cause and effect diagram and control charts. The methodology employed to achieve the stated objective, includes the study on nature of defect occurrence, collection of data on number of defects occurred during three months of study using check sheet, identification of major defect percentage using Pareto chart, finding the causes using cause and effect diagram and investigating the process is in control or not by statistical control charts. Lastly providing the suggestion regarding minimizing the defect and rework. The outcome of project was reduction in overall rejection rate in production line from 10% to 7 % and thus the production line was able to meet the required demand.
Marco Aurisicchio et al (2016) in their research paper “Rationale mapping and functional modelling enhanced root cause analysis” The research presented in this article aims to provide more effective support to the analysts involved in root cause analysis (RCA) by exploring the combined application of the Issue Based Information System (IBIS) and the Function Analysis Diagram (FAD) methods. The first method (IBIS) introduces the concept of argument-based rationale for explicit justification of the nodes of a cause– effect chain as well as of redesign decisions, while the second method (FAD) introduces the notion of structure-dependent functional modeling of complex systems in normal and failure states. Method: Causation data
from publicly available technical reports of the Space Shuttle Challenger disaster was reverse-engineered using a root cause analysis approach based on the IBIS and FAD notations. IBIS and FAD were implemented using a free and open source software tool known as design VUE. The approach was evaluated by comparing it to a method for root cause analysis widely used in industry and assessing how it satisfies generic requirements for root cause analysis. Results: The results show that the proposed IBIS-FAD approach provides a rich description of the causes for an accident presented in a manner that facilitates information access and understanding. The IBIS notation allowed for explicit modeling of the reasons supporting or refuting failure hypotheses along with evidence. The FAD notation provided a clear and concise method to visualize the complex set of non-linear interactions leading to the failure of a system by annotating graphical schematics of the design with the functions exchanged between its components. Finally, the results show that the approach supports the capture and justification of redesign decisions and ties them to initiating problems in a way that promotes the prevention of accident re-occurrence. Conclusions: Argument-based rationale with IBIS and FAD-style functional modelling are powerful concepts to extend the tool set available to support the root cause analysis process. The approach proposed in this article provides a unique tool that would be of value to academics, practitioners, and regulators concerned with root cause analysis and opportunities to improve the process of understanding adverse events.
connections as the damaged details, which did not suffer from cracks at the time of the measurement. The traffic-induced strain cycles and thus the resulting strain differences in the questionable cross sections were higher than expected and resulted in stresses of max. 85.8 MPa. Calculations showed that the credible remaining fatigue life for this particular structural detail was exceeded after 68 years according to nowadays standards. Extensive discussions, further field and laboratory tests followed to develop a rehabilitation plan for retrofitting the structure with minimum interference of the traffic. Finally, a method with minimum intervention to the structure was elaborated by a consortium of the operator BVG, BAM and producers based on further laboratory and field tests at BAM. Now, the viaduct is saved for the future.
TapobrataDey et al (2014) in their research paper” Improvement in solid oxide fuel cell performance through design modifications: An approach based on root cause analysis”work aims to investigate the performance improvement through design modifications obtained from root cause analysis. The influence of the interfacial resistance (ohmic), both, in terms of the external compression load, i.e., the interaction at the microscopic level and macroscopic contact area, is minimised. The effect of the uniformity of the flow distribution on the performance of the scaled up SOFC is analysed. To these objectives, the base configuration is modified and the influence of the different modifications on the electrochemical performance is studied. At 0.7 V, the performance is observed to be enhanced by 62% through minimization of the contact resistance between interconnect and electrode. It is further improved by 100% with an increase in the apparent contact area for a given cell. Additional 50% enhancement in performance is observed by achieving better uniformity in the flow distribution. Overall ~212% enhancement in the performance is achieved with a design, which consists of all the modifications in one cell contact area for a given cell. Additional 50% enhancement in performance is observed by achieving better uniformity in the flow distribution.
Sui Rongjuan et al (2014) in their research paper “Root cause analysis of stress corrosion at tube-to-tube sheet joints of a waste heat boiler. In this paper, the cause of the waste heat boiler failure was analyzed. The minimum expansion pressure was calculated, and the expansion process of the tube-to-tube sheet joint was simulated by ANSYS software. From the analysis above, the following conclusions can be drawn: (1) Failure analysis revealed that the leakage occurring at the tube-to-tube sheet joints was caused by SCC. The source of tensile stress is mainly the residual stresses due to expanding and welding. The operating medium contains micro chloride. 2) The yield strength of the tube material has a great effect on the minimum expansion pressure. The minimum expansion pressure calculated by the three-stage pressure formula is approximately equal to that stipulated by FEM when the tolerances of tubes and tube-sheets holes are not considered. 3) The long narrow gaps between the tubes and tube sheet holes exist because the expansion pressure used in manufacturing is less than that to remove the gap away. The enrichment of chloride ion in the gaps is the important reason for SCC. Leakage at the tube-to-tube sheet joints occurred in a waste heat boiler. The mode and the root cause of the failure were investigated by chemical composition analysis of the tube material, metallographic structure and crack observation, and corrosion product analysis of the damaged tubes, as well as the operation condition examination of the waste heat boiler.
Vineet V. Gosavi et al(2014)in their research paper” Defect Reduction in Fabricated Components using Root-Cause Analysis”The approach presented in this paper gives an analytical methodology to perform the root cause diagnosis of product service failures. The solution offered here gives interaction of design, process parameters and machines. The root cause and generate better and more comprehensive solutions than could be achieved by conventional brainstorming. The 5-Why root cause analysis method is simple in concept but requires real evidence, sure logic and great discipline in its use to find the root cause of a failure event or problem. 5-Why Table to the true root cause can be completed only if Why Tree for the occurrence is available. There are many incidents and events that can cause the top failure and all the causes and effects have to be found out. If the earlier found out causes go in the wrong direction, then the wrong things will be fixed and root causes will leave behind. The missed causes will sit in the business awaiting the next opportunity to instigate more strife and trouble.
IV. METHODOLOGY
© 2016, IRJET | Impact Factor value: 4.45 | ISO 9001:2008 Certified Journal
| Page 177
The Root Cause Analysis is a four step process involving the following: (i)Data collection
(ii)Cause charting
(iii)Root cause identification (iv)Recommendation
FIG: 1 Methodology Chart
V. DATA COLLECTION AND ANALYSIS
A. Data Collection
Defects data collected consist of mainly defects that occur in a manufacturing of gloves. But our area of
interest is the defects causing production loss. The defects causing rejection of product from the
production process were identified from the data.
Defects data collected are:
1. Beading defects
2. Torn- tearing
3. Sticky defects
4. Weak spots
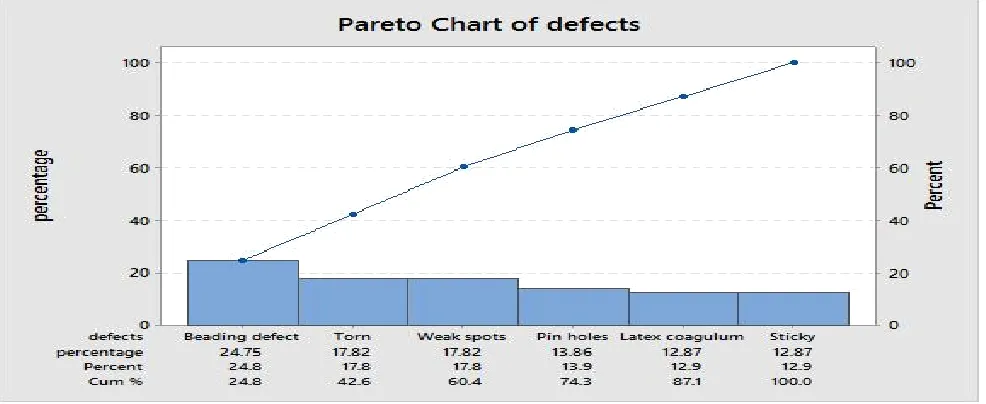
Fig. 3 Cumulative rejection percentage based on the type of defect of industry B during First month
1. Root Cause Identification of Beading
These can be considered external appearance quality defects. The cause of beading is usage of old beading roller,
dipping(adhesive) level down, less latex opening time.
2.Root Cause Identification of Torn:
Torn means tearing rejection. This defect is due to low tensile strength, improper vulcanization, latex over matured, stripping
error by workers. Stripping is done manually, less former gap,extra mechanical piece strikes in the line
.
Calculation-
For Industry A :
Given :In first month production of gloves pieces per day = 2000 For one month = 2000*30
= 60000 pieces per month
Frequency of following defects in Ist month per 60000 pieces is found by observations: For 60000 pieces, the frequency of following defects will be in Ist month:
1. Beading defect = 200*30 =6000defects per month =6000/60000 x 100
=10.00% defects from first month production
=3000 defects per month =3000/60000 x 100
=5.% from first month production
3.Sticky defect = 50*30 =1500 defects per month = 1500/60000 x 100
=2.5 from first month production
4.Weak Spots = 40*30 =1200 defects per month =1200/60000 x 100
=2% from first month production
5.Latex Coagulum = 20*30 =600defects per month = 600/60000 x 100
=1% from first month production
6.Pin holes = 17*30 =510defects per month =510/60000 x 100
=0.85% from first month production
Total no. of defects in Ist month = 2400+2450+2000+1700+1300+1250 =11100
Percentage of overall defective pieces in Ist month = Total no. of defective pieces / total production * 100 = 11100 / 60000 * 100 = 18.5%
Percentage of individual defects =Total no. of individual defects / total no. of defects * 100 1. Beading defect = 2400 / 11100 *100
=21.62%
2. Torn tearing = 2450 / 11100 * 100 =22.07%
3. Sticky defect = 2000 / 11100 * 100 =18.01%
4. Weak Spots = 1700 / 11100 *100 =15.31%
5. Latex Coagulum = 1300 / 11100 *100 =11.71%
6. Pin holes = 1250/ 11100 *100 = 11.26%
In second month production of gloves pieces per day = 2200 For second month = 2200 *30
= 66000 pieces per month
Frequency of following defects in IInd month per 2200 pieces is found by observations: For 66000 pieces, the frequency of following defects will be in IIndmonth :
1. Beading defect= 180*30 =5400 defects per month =5400/66000 x 100
=8.18% from second month production 2.Torn tearing = 110*30
= 3300 defects per month = 3300/66000 x 100 = 5% from second month production 3.Sticky defect = 45*30
=1350 defects per month =1350/66000 x 100
=2.04% from second month product
4.Weak Spots = 48*30 = 1440 defects per month = 1440/66000 x 100
= 2.18% from second month production 5.Latex Coagulum = 19*30
= 570 defects per month = 570/66000 x 100
= 0.86% from second month production 6.Pin holes = 24*30
=720 defects per month =720/66000 x 100
=1.09% from second month production
Total no. of defects in IIst month = 2300+2350+1900+1600+1200+1150 = 10500
Percentage of overall defective pieces in IInd month = Total no. of defective pieces / total production * 100 =10500 / 66000 * 100
=16%
Percentage of individual defects =Total no. of individual defects / total no. of defects * 100 1.Beading defect = 2300 / 10500 *100
=22%
2.Torn tearing = 2300 / 10500 *100 =22.38%
3.Sticky defect = 1900 / 10500 *100 =18.11%
4 Weak Spots = 1600 / 10500 *100 =15.23%
5.Latex coagulum = 1200 / 10500 *100 =11.40%
6.Pin holes = 1150 / 10500 *100 = 11.0%
Therefore :
Average percentage defects of Ist and IInd month = ( Ist month + IInd month) / 2 = ( 18.5 + 16.0 ) / 2
= 17.25% For Industry B : same as industry A a) Therefore
Average percentage defects of Ist and IInd month = = ( Ist month + IInd month) / 2
=Average percentage defects of Ist and IInd month = ( Ist month + IInd month) / 2 =( 22.44 + 31.9 ) / 2
=27.17%
VI. RESULT AND DISSCUSION-
The results drawn by previous calculation and analysis are as follows:
1. Tearing, Weak Spots and beading defects from Industry A during first month production are respectively 5%, 2% and 10%.
2. Tearing, Weak Spots and beading defects from Industry A during second month productionare respectively 5%, 2.18% and 8.18%.
3. Tearing, Weak Spots and beading defects from Industry B during first month production are respectively 8.67%, 1% and 1.53%.
4.Tearing, Weak Spots and beading defects from Industry B during second month production are respectively 12.5%, 1.66% and 2.16%.
concentrating on areas of defect as Tearing, Weak spots, and Beading. We have provided some suggestion related to defect types. So by taking corrective and effective measure it is possible to meet nearer to zero defects. The rejection due to these above mentioned defects are 5% 2% and 10% from Ist month production of industry A and 5%,,2.18% and 8.18 % from IInd month production of industry A and also the average percentage defects of total production from Ist and IInd month of industry B is 27.17% and on the other hand by applying RCA approach the average percentage defects of total production from Ist and IInd month of industry A is reduces upto 17.25%.
The methods by these above mentioned defects can be reduced are:
1. There is gap between coagulant and oven (if removed can reduce cycle time). 2. There is gap between dipping tank and oven.
3. Coagulant and latex in dipping tank are always stirred in tanks , so the stirring is done
inside the tanks that will create waves and improper coating on formers.(stirring should be outside the tank and then stirred liquid come smoothly in tank with proper passage that removes bubble and have proper coating).
4. Latex should be matured.
5.Acid solution must be change after 24 hours. 6. Alkali solution must be maintained at ph-9-11. 7.There should be no bubbles in coagulant.
8. Coagulant gravity must be maintained as per gloves. 9.In coagulant dipping tank latex should be stirred properly. 10.Flocking should be proper and smooth.
VII.CONCLUSION-
Minimization of defect and rework is an important factor ensuring the quality of product. The importance of manufacturing industry in the economy is high. So manufacturing the quality product is essential to sustain in the global market. Customer satisfaction depends on quality of product. Good quality results in good establishment of brand name, good providers and builds reputation in market. We should know that 1 % defect leads to 100% defective for customer to buy product. This study indicates reducing defects in manufacturing process like rework, man hour spent on rework and taking effective measures will enhance the net profit, saves time and improve overall quality of product.REFERENCES
[1] M.A. Khattak , N.Zareen , AniqueMukhtar , S.Kazi , AmenaJalil ,Zaheer Ahmed , Miraj Muhammad Jan (2016) Root cause analysis(RCA)of fractured ASTM A 53 carbon steel pipe at oil & gas company Case Studiesin Engineering Failure Analysis7(2016)1–8.
[2]. Marco Aurisicchio, Rob Bracewell, Becky L. Hooey(2016) Rationale mapping and functional modelling enhanced root cause analysisSafety Science 85 (2016) 241–257.
[3] Pramod K Behera, Bhabani S Sahoo(2016) Leverage of Multiple Predictive Maintenance
Technologies in Root Cause failure analysis of Critical MachineriesProcedia Engineering 144 (2016 ) 351 – 359.
[4] Ashwini.A, Avinash.K.S( 2015) Rejection Analysis in Piston Manufacturing UnitInternational Journal of Innovative Research in Science, Engineering and Technology.
[5] TapobrataDey, DebanandSingdeo , Rajendra N. Basu ,Manaswita Bose , Prakash C. Ghosh (2014) Improvement in solid oxide fuel cell performance through design modifications: An approach based on root cause analysis international journal of hydrogen energy xxx ( 2 0 1 4 ).
[6]. Rosemarie Helmerich , Jürgen Herter(2014) Root cause analysis of cracks in old steel viaductsand retrofittingEngineering Failure Analysis xxx (2014).
[7] . Sui Rongjuan , Wang Weiqiang , Liu Yan , Li Dong , Li Wei( 2014) Root cause analysis of stress corrosion at tube-to-tubesheetjoints of a waste heat boilerEngineering Failure Analysis 45 (2014) 398–405.