IJPSR (2015), Vol. 6, Issue 5 (Research Article)
Received on 10 July, 2014; received in revised form, 13 November, 2014; accepted, 18 April, 2015; published 01 May, 2015
STABILITY INDICATING RP-HPLC METHOD DEVELOPMENT AND VALIDATION FOR SIMULTANEOUS ESTIMATION OF DOXYCYCLINE MONOHYDRATE AND ORNIDAZOLE IN BULK AND PHARMACEUTICAL DOSAGE FORM
A. Srilekha, P. Pavani and B. Sreedhar*
Inorganic and Physical Chemistry Division, Council of Scientific and Industrial Research - Indian Institute of Chemical Technology, Hyderabad 500607, Andhra Pradesh, India
ABSTRACT:A simple, rapid, precise, cost effective, stability indicating RP-HPLC method has been developed and validated for the simultaneous estimation of Doxycycline monohydrate (DOXM) and Ornidazole (ORN) in Bulk and pharmaceutical dosage form. The chromatographic separation was achieved on Hypersil BDS C18 column (250mm ×4.6mm, 5μm) using a
mobile phase consisting of Buffer : Acetonitrile (55:45 v/v) pH 4 adjusted with ortho phosphoric acid at a flow rate of 1ml/min. Detection wavelength was found 260 nm. The retention time found for the drugs DOXM and ORN were 2.8 min and 4.3 min. respectively. The linearity of the method was over the range 12.5 – 75 µg/ml and 62.5– 375 µg/ml for DOXM and ORN, respectively. The validation of method was carried out utilizing ICH guidelines. The described RP-HPLC method was successfully employed for the analysis of pharmaceutical formulations containing combined dosage form. Developed HPLC method can resolve all degradant peaks of both the drugs, so this method is stability indicating in nature.
INTRODUCTION: Doxycycline (DOX) is a tetracyclic antibiotic and is commonly used to treat a variety of infections 1. It is used in prophylaxis against malaria. Doxycycline monohydrate (DOXM) chemically is 2-naphthalene carboxamide -4-(dimethylamino)-1,4,4a,5, 5a, 6, 11, 12a - octahydro-3,5,10,12,12a–pentahydroxy-6-methyl-1,11-dioxo[4S(4α,4aα, 5α, 5aα, 6α, 12aα)] monohydrate. DOXM is a yellow crystalline powder with a molecular weight of 462.45 g/mol. Its empirical formula is C22H24N2O8. H2O 2. It is an
official drug in USP3, IP4, and BP5.
QUICK RESPONSE CODE
DOI:
10.13040/IJPSR.0975-8232.6(5).2228-39
Article can be accessed online on: www.ijpsr.com DOI link: http://dx.doi.org/10.13040/IJPSR.0975-8232.6(5).2228-39
Several analytical techniques like bio analytical methods by HPLC using human plasma, human serum, RP-HPLC and spectrophotometric have been reported for estimation of doxycycline. Ornidazole (ORN) is antiprotozoal medication. ORN is chemically 1-(3-chloro-2-hydroxypropyl)-2-methyl-5-nitroimidazole, used as an anti-infective agent.
ORN is used in the treatment of susceptible protozoal infections and also in the treatment and prophylaxis of anaerobic bacterial infections. It is an official drug in IP4. ORN alone or in combination with other drugs, is reported to be estimated by spectrophotometry and HPLC in biological fluids or pharmaceutical formulations. DOXM 7-9 and ORN 10-17 combination is prescribed for amoebic dysentery. However, no HPLC method for the simultaneous estimation of DOXM and ORN in bulk and pharmaceutical dosage forms has
Keywords:
Doxycycline Monohydrate, Ornidazole, Method development,
Validation, Stability studies Correspondence to Author: B. Sreedhar
Inorganic and Physical Chemistry Division, Council of Scientific and Industrial Research - Indian Institute of Chemical Technology, Hyderabad 500607, Andhra Pradesh , India
been reported so far. No method is available in the pharmacopoeias. No stability-indicating methods have been cited in the literatureconcerned with the determination of the intact drug in presence of its degradation product. This paper presents a study of acidic, alkaline, neutral, oxidative, thermal and photo degradation of DOXM and ORN. The scientific novelty of the present work is that the methods used are simple, rapid, and selective. The present work describes the development of simple, precise andaccurate isocratic reverse phase HPLC method for simultaneous estimation of DOXM and ORN in bulk and pharmaceutical dosage form.The chemical structures of the drugs DOXM and ORN are represented in Fig. 1 and 2, respectively
.H2O
FIG. 1: STRUCTURE OF DOXYCYCLINE MONOHYDRATE
FIG. 2: STRUCTURE OF ORNIDAZOLE
MATERIALS & METHODS: Chemicals and Reagents:
DOXM and ORN were provided by Dr. Reddy’s Laboratories Ltd and ENDOC Pharma, respectively. Tablet formulation (DOBACT DOX), labelled amount 100 mg Doxycycline monohydrate and 500 mg Ornidazole manufactured by Tidal Labs, India was purchased from the local market. Acetonitrile and methanol of HPLC Grade were obtained from Rankem. Potassium dihydrogenortho phosphate and ortho phosphoric acid of analytical grade were obtained from SD Fine Chemicals
(Hyderabad, India). Water [HPLC Grade] was purified by Milli Q purification system.0.45μm Nylon membrane filters were obtained from Spincotech Private Limited, Hyderabad.
Apparatus and Chromatographic Conditions: Instrument:
HPLC analysis was performed on Waters 2695Alliance HPLC system connected with PDA Detector 2996. The drug analysis data were acquired and processed using Empower 2 software.
UV/VIS spectrophotometer: T60PG Instruments
PH meter: Mettler Toledo S 220
Weighing balance: Shimadzu AY 220
Sonicator: Wensar MUC 6L
Temperature: 30°C
Column: Hypersil BDS-C18 250mm x 4.6 mm ID,
5 μm column was used.
Mobile phase: Phosphate Buffer: Acetonitrile (55: 45v/v)
Flow rate: 1 ml per min
Wavelength: 260 nm
Injection volume: 10 µl
Run time: 8 min
Preparation of buffer:
The buffer solution was prepared by dissolving accurately weighed 1.36 grams of potassium dihydrogenortho phosphate (KH2PO4) and
transferred into a clean and dry 1000 ml volumetric flask, about 900 ml of water was added and degassed in an ultrasonic water bath for 15 min,and finally made up with water [HPLC Grade] to get 10mM buffer strength. The final pH of the buffer was adjusted to 4 by using orthophosporic acid. Later the buffer was filtered through 0.45μm nylon membrane filter.
Preparation of stock and working standard solution:
The stock solution was prepared by weighing accurately 5 mg of DOXM and 25 mg ORN and transferred into a clean and dry 10 ml volumetric flask. About 7 ml of diluent was added and sonicated for 30 minand made up to the final volume with diluent. From the above stock solution, 1ml of solution was transferred into a 10ml volumetric flask to that the diluent was added upto the mark to get final concentration of (50µg/ml DOXMand 250µg/ml ORN).
Preparation of sample solution:
Twenty tablets were weighed and powdered. Tablet powder equivalent to 100 mg of DOXM and 500 mg of ORN was accurately weighed and transferred into 100ml volumetric flask to that70ml of diluent was added and sonicated for 30 min. Further, the volume was made up to the mark using diluent and filtered. From the filtered solution 0.1ml was pipetted out into a 10 ml volumetric flask and made upto 10ml with diluents. This is then filtered through 0.45μ membrane filter to obtain clear solution.
Method Validation: The developed method of analysis was validated as per the ICH for the parameters like system suitability, specificity, linearity, precision, accuracy, robustness, limit of detection (LOD) and limit of quantitation (LOQ).
System suitability:
The chromatographic systems used for analysis must pass the system suitability limits before sample analysis can commence. Set up the chromatographic system, allow the HPLC system to stabilize for 40 min. Inject blank preparation (single injection) and standard preparation (six replicates) and record the chromatograms to evaluate the system suitability parameters like resolution (NLT 2.0), tailing factor (NMT 1.5), theoretical plate count (NLT 3000) and % RSD for peak area of six replicate injections of LMS standard (%RSD NMT 2.0).
Specificity:
The evaluation of the specificity of the method was determined against a placebo, blank and sample. The interference of the excipients of the claimed
placebo present in pharmaceutical dosage form was derived from a placebo solution. Furthermore, the specificity of the method toward the drug was established by checking the interference of the degradation products in the drug quantification for
assay during the forced degradation study. The
chromatogram for placebo, blank, standard and sample solution indicating the specificity of developed method.
Linearity:
Linearity was established by least squares linear regression analysis of calibration curve. Linearity was determined in the range of 0 - 75 ppm of DOX and 0 - 375 ppm of OZ.
Limit of detection:
The detection limit of an individual analytical procedure is the lowest amount of analyte in a sample which can be detected but not necessarily quantities as an exact value
Limit of detection (LOD) = σ/ 𝑆× 3.3 where
S – slope of the calibration curve σ – residual standard deviation
Limit of quantification:
It is defined as lowest concentration of analyte in a sample that can be determined with acceptable precision and accuracy and reliability by a given method under stated experimental conditions
It can be determined from linearity curve by applying the following formula
Limit of quantification (LOQ) = σ/𝑆×10
where
S – slope of the calibration curve σ – residual standard deviation
Precision:
System precision: Six replicate injections of the mixture of standard solution at working concentration showed % RSD (% Relative Standard Deviation) less than 2 concerning peak areas for both the drugs, which indicates the acceptable reproducibility and thereby the precision of the system.
the tests of (i) repeatability (Intraday precision) and (ii) Intermediate precision (Inter day precision).
Repeatability (Intraday precision):
Six consecutive injections of the sample at working concentration showed % RSD less than 2 concerning % assay for all the drugs which indicate the method developed is precise by the test of repeatability and hence can be understood that the method gives consistently reproducible results.
Ruggedness (Intermediate Precision / Inter day precision):
Six consecutive injections of the sample solution at working concentration on different days, showed % RSD less than 2 for % assay for all the drugs within and between days, which indicate the method developed is inter day precise / rugged.
Robustness:
The robustness of an analytical method is a measure of its capacity to remain unaffected by small but deliberate variations in method parameters and provides an indication of its reliability during normal usage. It is concluded that the method is robust as it is found that the % RSD is less than 1 concerning % assay despite deliberate variations done concerning flow rate (± 0.1 ml), composition of mobile phase (±10 ml) and temperature (±5ºc).
Stability studies:
In order to establish whether the developed method is stability indicating, both the drugs were stressed under various conditions (acid, base, oxidation and thermal) to perform stability (forced degradation studies).
Acid degradation studies:
To 1 ml of stock solution DOXM and ORN, 3 ml of 2N HCl wasadded and refluxed for 30min at 60C. The resultant solution was diluted to obtain 50µg/ml and 250µg/ml and 10µl solutions were injected in to the system and the chromatograms were recorded to assess the stability of sample.
Alkali degradation studies:
To 1 ml of stock solution DOXM and ORN, 3 ml of 2N NaOH was added and refluxed for
30mins at 60C. The resultant solution was diluted to obtain 50 µg/ml and 250 µg/ml and 10µl were injected into the system and the chromatograms were recorded to assess the stability of sample.
Thermal degradation studies:
The standard drug solutions w e r e placed in oven at 105 C for 6 h to study thermal degradation. For HPLC study, the resultant solution was diluted to 50µg/ml (DOXM) and 250 µg/ml (ORN) solution and 10µl were injected into the system and the chromatograms were recorded to assess the stability of the sample.
Photo stability studies:
The photochemical stability of the drug was also studied by exposing the solution by keeping them in UV chamber for 7 days or 200 Watt hours/m2 in photo stability chamber. For HPLC study, the resultant solution was diluted to obtain 50 µg/ml and 250 µg/ml solutions and 10µl was injected into the system and the chromatograms were recorded to assess the stability of sample.
Neutral degradation studies:
Stress testing under neutral conditions was studied by refluxing the drug in water for 6 h at a temperature of 60ºC. For HPLC study, the resultant solution was diluted to 50 µg/ml and 250 µg/ml solution and 10µl was injected in to the system and the chromatograms were recorded to assess the stability of the sample.
Oxidative degradation:
To 1 ml of stock solution, 1 ml of 20 % hydrogen peroxide (H2O2) was added separately. The solutions were kept for 30 min at 60°C. For HPLC study, the resultant solution was diluted to obtain 50 µg/ml and 250 µg/ml solution and10µl were injected into the system and the chromatograms were recorded to assess the stability of sample
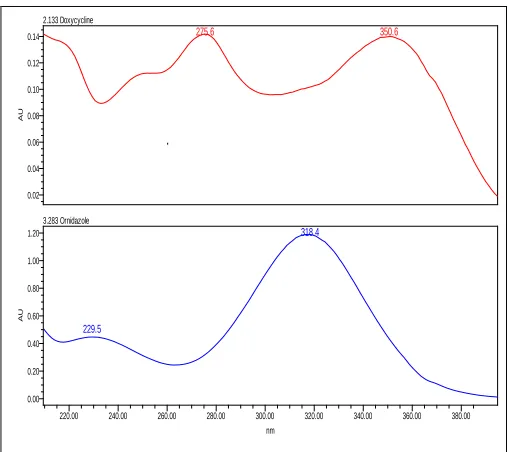
RESULTS AND DISCUSSION: Selection of Wavelength:
so thesuitable wavelength was selected as 260 nm (Fig. 3).
2.133 Doxycycline
275.6 350.6
AU
0.02 0.04 0.06 0.08 0.10 0.12 0.14
3.283 Ornidazole
229.5
318.4
AU
0.00 0.20 0.40 0.60 0.80 1.00 1.20
nm
[image:5.612.312.566.92.435.2]220.00 240.00 260.00 280.00 300.00 320.00 340.00 360.00 380.00
FIG.3: UV SPECTRA OF DOXYCYCLINE MONOHYDRATE AND ORNIDAZOLE
Method development:
Initially, wavelength was selected for the method development and different compositions, pH and flow rate of the mobile phase were tried during method development. Wavelength of 260 nm was selected for the current method since at this wavelength DOXM and ORN show high sensitivity. In the course of optimizing the composition of mobile phase, acetonitrile in combination with various buffers like phosphate and acetate with varying pH values were tried. After a series of preliminary experiments it was concluded that potassium dihydrogenortho phosphate buffer resulted in better peak shape. Peak with good shape and symmetry was observed by the mobile phase consisting of potassium dihydrogenorthophosphate: acetonitrile (pH 4, 10mM) (55:45, v/v) set at a flow rate of 1ml/min.
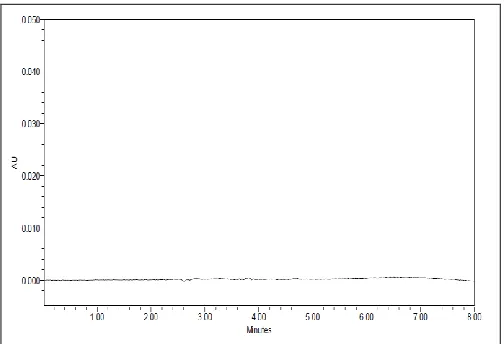
A reverse phase HPLC method was developed keeping in mind the system suitability parameters i.e. tailing factor (T), number of theoretical plates (N), runtime and the cost effectiveness. The optimized method developed resulted in the elution of DOXM at 2.8 min and ORN at 4.3 min. Fig. 4 and 5 represent chromatograms of blank solution and mixture of standard solutions, respectively. The total run time is 8 min with all system suitability
parameters as ideal for the mixture of standard solutions.
FIG.4: TYPICAL CHROMATOGRAM FOR BLANK
SOLUTION
FIG.5: CHROMATOGRAM SHOWING SIMULTANEOUS ESTIMATION OF DOXM AND ORN
System‐suitability tests are an integral part of method development and are used to ensure adequate performance of the chromatographic system. Retention time (Rt), number of theoretical
plates (N), and peak tailing factor (T) were evaluated for six replicate injections of the standards at working concentration. The system suitability parameters for DOXM and ORN by the proposed method are tabulated in Table 1 and it is found that they arewithin acceptable limits
TABLE 1: SYSTEM SUITABILITY PARAMETERS FOR DOXM AND ORN
Parameters* DOXM ORN
Retention time (min) 2.884 4.319 Theoretical plates (N) 3288 9456 Tailing factor (T) 1.23 1.22
Method validation:
[image:5.612.48.302.93.319.2]Harmonization (ICH) guidelines [20] for validation of analytical procedures. The method was validated for the parameters like system suitability, specificity, linearity, accuracy, precision, ruggedness, robustness, limit of detection (LOD) and limit of quantitation (LOQ) and stability studies.
Linearity:
Standard solutions of DOXM and ORN of different concentrations (25, 50, 75, 100, 125, and 150%)
were prepared. Calibration curves were constructed by plotting the concentration of drug versus corresponding mean peak area.
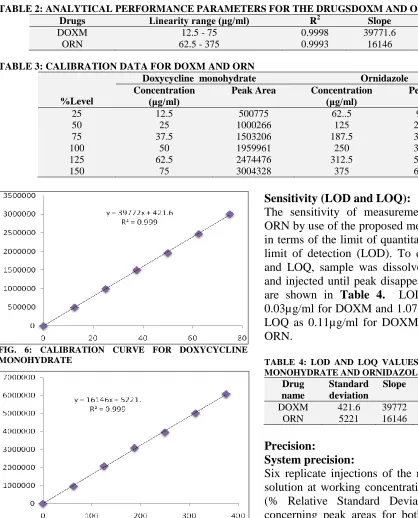
[image:6.612.50.468.214.732.2]The results show that an excellent correlation exists between mean peak area and concentration level for both the drugs and the results are given in Table 2 and 3 and Fig.7 and 8. The method is said to be linear in the range of 12.5-75 μg/ml for DOXM and 62.5 - 375 μg/ml for ORN.
TABLE 2: ANALYTICAL PERFORMANCE PARAMETERS FOR THE DRUGSDOXM AND ORN
TABLE 3: CALIBRATION DATA FOR DOXM AND ORN
%Level
Doxycycline monohydrate Ornidazole Concentration
(μg/ml)
Peak Area Concentration (μg/ml)
Peak Area
25 50 75 100 125 150
12.5 25 37.5
50 62.5
75
500775 1000266 1503206 1959961 2474476 3004328
62..5 125 187.5
250 312.5
375
965052 2088227 3102312 3958001 5028096 6086595
FIG. 6: CALIBRATION CURVE FOR DOXYCYCLINE MONOHYDRATE
FIG.7: CALIBRATION CURVE FOR ORNIDAZOLE
Sensitivity (LOD and LOQ):
The sensitivity of measurement of DOXM and ORN by use of the proposed method was estimated in terms of the limit of quantitation (LOQ) and the limit of detection (LOD). To determine the LOD and LOQ, sample was dissolved in mobile phase and injected until peak disappeared and the results are shown in Table 4. LOD was obtained as 0.03µg/ml for DOXM and 1.07µg/ml for ORN and LOQ as 0.11µg/ml for DOXM and 3.23µg/ml for ORN.
TABLE 4: LOD AND LOQ VALUES FOR DOXYCYCLINE MONOHYDRATE AND ORNIDAZOLE
Drug name
Standard deviation
Slope LOD LOQ
DOXM ORN
421.6 5221
39772 16146
0.03μg/ml
1.07μg/ml 0.11μg/ml 3.23μg/ml
Precision:
System precision:
Six replicate injections of the mixture of standard solution at working concentration showed % RSD (% Relative Standard Deviation) less than 2 concerning peak areas for both the drugs, which indicates the acceptable reproducibility and thereby
Drugs Linearity range (μg/ml) R2 Slope Intercept
DOXM ORN
12.5 - 75 62.5 - 375
0.9998 0.9993
39771.6 16146
the precision of the system. System precision results are tabulated in Table 5.
TABLE 5: SYSTEM PRECISION RESULTS FOR
DOXYCYCLINE MONOHYDRATE AND ORNIDAZOLE Injection no. Doxycycline
Monohydrate
Ornidazole
1 1845742 3873964
2 1847242 3862207
3 1862737 3889841
4 1864737 3878161
5 1864194 3894646
Mean 1856930 3879764
Standard deviation (SD)
9571.636 12917.80
%RSD 0.5 0.33
Method precision:
Method precision was determined by performing assay of sample under the tests of (i) repeatability (Intraday precision) and (ii) Intermediate precision (Inter day precision) performed at working concentration by three different analysts on three consecutive days.
Repeatability (Intraday precision):
Six consecutive injections of the sample at working concentration showed % RSD less than 2 concerning % assay for all the drugs which indicate the method developed is precise by the test of repeatability and hence can be understood that the method gives consistently reproducible results (Table 6).
TABLE 6: REPEATABILITY RESULTS
S No
Area at 260 nm % Assay
DOXM OZ DOXM OZ
1 2 3 4 5 6 Mean SD %RSD 1844557 1850113 1860289 1874876 1865578 1847532 1857158 11795.797 0.64 3914116 3900558 3854870 3862028 3863536 3887854 3880494 23968.02 0.617654 99.23433 99.53323 100.0807 100.8654 100.3652 99.39438 99.91 0.6346 0.64 100.7845 100.4354 99.25901 99.44332 99.48215 100.1083 99.919 0.617 0.618
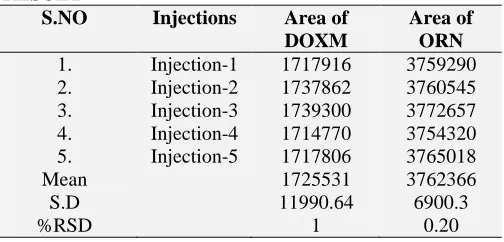
Intermediate Precision / Inter day precision: Six consecutive injections of the sample solution at working concentration on three different days, showed % RSD less than 2 for % assay for all the drugs within and between days, indicating that the method developed is inter day precise / rugged (Table 7).
TABLE 7: INTERMEDIATE (DAY-DAY) PRECISION RESULT
S.NO Injections Area of DOXM Area of ORN 1. 2. 3. 4. 5. Mean S.D %RSD Injection-1 Injection-2 Injection-3 Injection-4 Injection-5 1717916 1737862 1739300 1714770 1717806 1725531 11990.64 1 3759290 3760545 3772657 3754320 3765018 3762366 6900.3 0.20 Accuracy:
Accuracy was determined by means of recovery experiments, by the addition of active drug to pre-analyzed sample at different spiked levels (50-150%). At each level, three determinations were performed and results obtained. The accuracy was calculated from the test results as the percentage of the analyte recovered by the assay. The amounts recovered values of percent mean recovery were calculated as shown in Tables 8 and 9. The accepted limits of recovery are 98%-102% and all observed data are within the required range indicating good recovery values and hence the accuracy of the method developed.
TABLE 8: RESULTS OF ACCURACY STUDIES FOR DOXM Recovery level Amount added (mg) Amount recovered (mg) % recovery Mean % Recovery ± SD %RSD 50% 2.5 2.5 2.5 2.48 2.51 2.47 99.32 100.76 99.10
99.7±0.90 0.91
100% 5 5 5 4.95 4.97 5 99.03 99.54 100.13 99.53±0.5 4 0.551 150% 7.5 7.5 7.5 7.51 7.51 7.43 100.21 100.20 99.16
99.83±0.6 0.601
TABLE 9: RESULTS OF ACCURACY STUDIES FOR ORN Recovery level Amount added (mg) Amount recovered (mg) % recovery Mean % Recovery ± SD %RSD 50% 12.5 12.5 12.5 12.58 12.5 12.4 100.66 100.03 99.23
99.97±0.715 0.715
100% 25 25 25 25.07 24.81 24.81 100.3 99.27 99.38
99.66±0.57 0.57
150% 37.5 37.5 37.5 37.66 37.34 37.44 100.4 99.58 99.84
[image:7.612.313.565.89.210.2]Assay:
The validated method was applied to the determination of DOXM and ORN in commercially available DOBACT DOX tablets. The percentage assay was found to be 99.56% for DOXM and 99.6 % for ORN, respectively. The results of assay indicate that the developed method is selective without interference from excipients of tablet.
Robustness:
The robustness of an analytical method is a measure of its capacity to remain unaffected by small but deliberate variations in method parameters and provides an indication of its reliability during normal usage. It is concluded that the method is robust as it is found that the % RSD is less than 1 concerning % assay despite deliberate variations done concerning flow rate (± 0.1), % organic phase (± 10%), and temperature (±10ºC) (Table 10)
TABLE 10: ROBUSTNESS STUDIES FOR DOXM AND ORN
Specificity:
The specificity of the method was determined
against a blank, placebo and a mixture of sample
drug solutions. Chromatograms reveal that the peaks generated in mixture of sample solution are only because of the drugs as blank (Fig. 4) as well as placebo (Fig. 8) did not show any peaks at the retention times of DOXM and ORN as was seen in Fig.9 establishing the specificity of the method developed (Table 11).
[image:8.612.23.588.205.385.2]FIG. 8: TYPICALCHROMATOGRAM FOR PLACEBO SOLUTION
FIG.9: TYPICAL CHROMATOGRAM FOR SAMPLE
[image:8.612.272.587.207.560.2]SOLUTION
TABLE 11: SPECIFICITY RESULTS
Name of the solution Retention time, (Rt) min
Blank No peak
Placebo No peak
Sample DOXM , 2.8 ORN, 4.2
Furthermore, the specificity of the method towards the drug was established by checking the interference of the degradation products in the drug quantification for assay during the forced degradation study.
Para-meters
Optimized conditions
Used
Doxycycline monohydrate Ornidazole (Rt) min
Area Mean ±%RSD (Rt)
min Area
Mean ± % RSD Flow rate
(± 0.1)
1.0 mL/min
0.9 3.179 2067353 2075251± 0.5 4.581 4309113 4326042 ± 0.6 3.220 2083148 4.667 4342971
1.1 2.546 1566048 1606893± 0.6 3.689 3392544 3415886 ± 1.0 2.577 1647738 3.740 3439227
Mobile phase composition [Buffer : ACN]
55:45v/v
45:65 2.851 1735105 1740156 ± 0.4 4.041 3761358 3760024 ± 0.1 2.857 1745208 4.059 3758689
65:35 2.860 1685645 1681809 ± 0.3 4.159 3636629 3636131 ± 0.0 2.862 1677973 4.338 3635633
Temperature (±10°C)
30
20 2.866 1671750 1684818 ± 1.1 4.186 3596441 3620519 ± 0.9 2.873 1697885 4.191 3644597
[image:8.612.48.300.545.717.2]Stability studies:
In order to establish whether the developed method is stability indicating both the drugs were stressed under various conditions (acid, base, neutral, oxidation and photo stability, thermal) to perform forced degradation studies. The peaks of degraded products were well separated from the analyte peak with good resolution The peak purity of DOXM
and ORN was found to satisfactory under different stress conditions as shown in the chromatograms in
Fig. 10 (a, b, c, d, e) which indicates that the
developed method is stability indicating. Table 11
and 12 illustrate the percentage degradation, purity
[image:9.612.115.501.177.527.2]angle and purity threshold for DOXM and ORN, respectively.
[image:9.612.114.499.551.720.2]FIG.10a: CHROMATOGRAM SHOWING ACID DEGRADATION OF DOXM AND ORN
FIG. 10b: CHROMATOGRAM SHOWING BASIC DEGRADATION OF DOXM AND ORN
FIG.10d: CHROMATOGRAM SHOWING OXIDATIVE DEGRADATION OF DOXM AND ORN
FIG.10e: CHROMATOGRAM SHOWING THERMAL DEGRADATION OF DOXM AND ORN
FIG.10f: CHROMATOGRAM SHOWING PHOTO-STABILITY STUDIES OF DOXM AND ORN
TABLE 11: DEGRADATION STUDIES FOR DOXYCYCLINE MONOHYDRATE Degradation studies Area % Assay % Degradation Purity
angle
Purity threshold Acid
Base Oxidation
Thermal Photo stability
Neutral
1730235 1751032 1764873 1772234 1832819 1852915
92.77 93.88 94.63 95.02 98.27 99.35
-7.68 -6.4 -5.56 -5.12 -1.65 -0.55
0.077 0.995 0.391 0.246 0.978 0.454
[image:10.612.107.505.244.420.2] [image:10.612.70.513.646.743.2]TABLE 12: DEGRADATION STUDIES FOR ORNIDAZOLE Degradation
studies
Area %Assay %Degradation Purity angle Purity threshold Acid Base Oxidation Thermal Photo stability Neutral 3722340 3631839 3667322 3722340 3823045 3880019 92.30 93.23 94.14 95.55 98.14 99.6 -4.54 -7.15 -6.11 -4.5 -1.79 -0.29 0.237 0.126 0.078 0.086 0.090 0.087 0.369 0.317 0.289 0.291 0.286 0.285
CONCLUSION: A simple, sensitive, specific, accurate and precise stability indicating RP-HPLC isocratic method was developed and validated for the routine analysis of bulk and tablet dosage form of doxycycline monohydrate and ornidazole. The method is sensitive enough for the detection of analyte in pharmaceutical formulation when compared to the research works found in the literature. A good linear relationship was observed for both the drugs between concentration ranges of 12.5 to 75µg/ml and 62.5 to 375μg/ml of doxycycline monohydrate and ornidazole respectively. The correlation coefficients were greater than 0.999 for both the drugs. The inter day and intraday precision results were good enough to say that the method developed is precise and reproducible. Accuracy studies revealed that mean recoveries after experiments were between 98 and 102%, an indicative of accurate method. The results of forced degradation studies reveal that the method is stability indicating.
The peak purity of doxycycline monohydrate and ornidazole was found to satisfactory under different stress conditions. There was no interference of any peaks of degradation product with drug peaks.
Hence, results of forced degradation studies reveal
that the method is stability indicating. Simplicity, stability and economical nature make the method superior to the other reported HPLC methods.Accordingly it can be concluded that the developed reverse phase HPLC method is accurate, precise, linear and robust and therefore the method can be used for the routine analysis of doxycycline monohydrate and ornidazole.
ACKNOWLEDGEMENT: We would like to thank the Director, CSIR-Indian Institute of Chemical Technology, Hyderabad for giving us an opportunity to carry out our dissertation work in the institute.
REFERENCES:
1. O’Neil M J. The Merck Index- An encyclopedia of
chemicals, Drugs and Biological, New Jersey, Merck and co., doxycycline monohydrate; 3474:606 and ornidazole 1229:6938
2. Martindale, The Complete references; Pharmaceutical
Press Lambeth High Street, London UK; Thirty sixth edition:1:267,843
3. United States Pharmacopoeia NF. 23; 2004: 667.
4. Indian Pharmacopoeia 2010; 2(3):1257, 1823.
5. British Pharmacopoeia 2003; 3: 676.
6. Uday A. Deokate, Rajesh B.Nawale, Monals.Salvi.
Development and validation of RP-HPLC method for simultaneous estimation of Doxycycline hyclate and Tinidazole in bulk and tablet dosage form. International Journal of Pharmacy and Pharmaceutical Science. 2013; July 5(4): 400-5.
7. Chaitanya Krishna A, sathiyaraj M, saravanan R.S,
chelladurai R and vignesh R. A Novel and Rapid Method to Determine Doxycycline in Human Plasma by Liquid Chromatography Tandem Mass Spectrometry. Indian journal of pharmaceutical science. 2012
8. Ana Carolina Kogawa, Herida Regina Nunes Salgado.
Quantification of Doxycycline hyclate in tablets by HPLC–UV Method. Journal of chromatographic science. 2012: 1-7
9. Liberato Brum Junior, Flávia de Toni Uchoa, Sílvia Stani sçuaski Guterres & Teresa Dalla Costa. Development and Validation of LC-MS/MS Method for the Simultaneous
Determination of Quinine and Doxycycline in
Pharmaceutical Formulations. Journal of Liquid
Chromatography & Related Technologies. 2009; 32(18) : 2699-2711
10. Gandhi. V.M, Nair. S.B, Menezesand. C, Narayan. R. Development of UV-spectrophotometric method for the quantitative estimation of ofloxacin and ornidazole in combined liquid oral dosage form by simultaneous equation method. International Journal of Research in Pharmacy and Chemistry. 2013; 3(1): p.6-10
11. Suhagia BN, Shah SA, Rathod IS, Patel HM, Shah DR, et
al. Determination of gatifloxacin and ornidazole in tablet
dosage forms by high-performance thin-layer
chromatography. Journal of Analytical Sciences. 2006 ;22: 743-745
12. Manisha Puranik, DV Bhawsar, Prachi Rathi, PG Yeole; Simultaneous determination of Ofloxacin and Ornidazole in solid dosage form by RP-HPLC and HPTLC techniques, Indian Journal of pharmaceutical science;72(4),513-517
13. Maheshwari R.K, V. K. Srivastav, and S. Sahu, New
spectrophotometric estimation of ornidazole tablets employing urea as a hydrotropic solubilizing additive, Indian Journal of pharmaceutical science;72(2):258-281.
14. Róna K, Gachálvi B. Simple liquid chromatographic
metronidazole in human serum. Journal of Chromatographic sciences. 420: 228-230.
15. International Conference on Harmonization, guideline
Q1A (R2), Stability testing of new drug substances and products. Federal Register 2003, 3, 29103.
16. International Conference on Harmonization, guideline
Q2A, Text on validation of analytical procedures. Federal Register 1995; 60:11260.
17. International Conference on Harmonization, guideline
Q2B, Validation of analytical procedures: methodology. Federal Register 1997; 62:27463.
All © 2013 are reserved by International Journal of Pharmaceutical Sciences and Research. This Journal licensed under a Creative Commons Attribution-NonCommercial-ShareAlike 3.0 Unported License.
This article can be downloaded to ANDROID OS based mobile. Scan QR Code using Code/Bar Scanner from your mobile. (Scanners are available on Google Playstore)
How to cite this article: