5158
THE DIMENSIONS OF PETRI NETS: MODELLING
STRATEGIES FOR BIOLOGICAL ASPECTS APPLICATION
TO
E. COLI
1OMED HASSAN AHMED, 2ZANA AZEEZ KAKARASH, 3ARAM MAHMOOD AHMED
1, 2 University of Human Development, Department of Information Technology, KRG, Iraq
3 Kurdistan Institution for Strategic Studies and Scientific Research, Department of Information
Technology, KRG, Iraq
E-mail: 1 [email protected], 2[email protected], 3[email protected]
ABSTRACT
Petri net is a formalism which is very beneficial for biologists. The analytical and simulation abilities of Petri net may assist the elaboration of experiments because it can be used to test hypotheses and collect related information. This paper is a survey about PN formalisms regarding gene regulatory network (complex systems of genes, proteins and other types of molecules), considering the advantages and disadvantages of each method. In addition, a model of genetic regulatory network is demonstrated for the response of carbon starvation stress in E. coli. It was previously represented by differential equation; however, it has been transformed into Hybrid functional Petri net (HFPN) model. The HFPN formalism has yielded its suitability for modeling the carbon starvation response network in E. coli cells. Therefore, by utilizing this model on a current available tool, and by using simulations, results have been gained which are identical to previous studies
Keywords: Hybrid functional Petri Net, Gene Regulatory Network, E. coli, Modeling and Simulation.
1. INTRODUCTION
Whole-cell modeling is a developing and research active area in science. Its basic role is to model a single cell accompanied with all its complex systems. However, the major challenge confronted by whole cell modeling lies in the understanding of modeling and simulation of cellular complexity. By overcoming this challenge, we would have a better understanding and be able to model an organism.
Thus, the understanding of whole cell modeling starts from the definition of gene regulatory network. It is a set of genes, or parts of genes, that interrelate with each other to control a specific function of a cell. The development and functionality of cellular systems are controlled by this complex network [5]. Various models such as electrical circuits [21], Boolean networks [3], differential equations [4, 11, 25] and stochastic Petri net [9,10] have been interrogated to construct gene regulatory networks or genetic networks. However, after all, the approach with differential equations is considered to be vital in genetic regulatory networks modeling. As an example, the Piecewise-Linear differential equation model by
Ropers et al. [25], represents a precise model carbon starvation response network in E. coli cells.
Nevertheless, differential equation models of genetic regulation are hard to build and pursue. This is primarily due to the fact that these models do not succeed to depict the way in which we comprehend genetic regulatory networks by instinct. For example, stochastic Petri net [10] or discrete Petri net models [22] are unable to cope with those features that are meant to handle continuous values such as protein concentrations, mRNA, proteins complexity, metabolites ... etc.
ISSN: 1992-8645 www.jatit.org E-ISSN: 1817-3195
5159 legible. In an attempt to find new applications and stimulate new research topics, researchers such as [1, 8, 16, 17] combined theory and the basic Petri net to form a new model and define the associated operations of Petri net in modeling biological processes.
As Matsuno et. al. [20] stated, it is an extension of the discrete Petri net model, which is able to deal with real numbers in continuous manner. As a result, it enhances the understanding of the relationship between continuous values and discrete values, as well as maintaining the features of
discrete Petri net model concurrently.
Consequently, by utilizing HFPN, gene regulatory networks can be modeled.
This paper presents several ordinary biopathway modeling regarding gene regulation: λ phage switching mechanism [20], Drosophila circadian rhythm [16], E. coli lac operon regulatory mechanism [18], and fission yeast cell cycle [28]. Petri net has been used as an effective modeling tool for modeling metabolic and signal transduction pathways as well as regulatory networks of genes. The VON++ to GON program has been utilized by Matsuno et al. [29, 30] and a spectacular progress has been made. In this paper, the genetic regulatory networks have been converted to Petri net applications through utilizing powerful Petri nets and computer techniques. Through marginally extending HPN, HFPN is expressed so that metabolic and signal transduction pathways as well as gene regulatory networks can be modeled by instinct. The HFPN formalism has proved the fact that it is suitable for modelling the carbon starvation response network in E. coli cells. Therefore, using this model on a current available tool, and by using simulations, results have been gained which were identical to previous studies [29].
The paper is arranged in the following manner. Firstly, a brief introduction to Gene regulatory networks and Petri nets are elaborated in Section 2. Next, Section 3 explains the different methods to model gene regulatory networks using Petri nets. Thereafter, Sections 4 and 5, present a case of study in which HFPN is applied to modelling and simulating the genetic regulatory network for the carbon starvation stress response in E. coli cell. Next, in Section 6 our model is simulated. Finally, Section 7 concludes and summaries the progressive results.
2. BACKGROUND
2.1 PETRI Nets
Petri net is a mathematical modeling language. It is basically a network which has four components which are: place, transition, arc, and token. The first component is called “Place” which contains tokens as its content. The second component is called “transition” which is allocated between places. It has arcs that transfer from and toward places. Tokens are consumed by transitions at input places while they are produced at output places. This process is usually called firing a transition. Tokens positioned in places represent the local atomic state by which it indicates the condition of the place it is held in. The function of tokens in places are to mark a net. In other words, they define the PN's global state. The execution or simulation of a PN can be achieved by the firing rule of traveling tokens. In this process, the places that contain tokens and their arcs are pointed towards a transition, the transition can be enabled and might fire by taking away a token from each input place and add that to every single output place. The result of this execution can be presented as graphs or can be analyzed in either qualitative or quantitative manners [22].
2.2 Gene regulatory networks
5160
Fig. 1. Central Dogma [27]
The theory of this system provides modeling and analysis methods. accordingly, this will assist us to further comprehend the biological phenomena [26]. Especially, Petri nets have turned to be the reference modeling formalism for GRNs (see, e.g., [10, 19, 20, 28]): defining test arc and inhibitory arc are for the purpose of expediency. An inhibitory arc with weight w allows the transition to fire merely if the substance of the place at the source of the arc is less than or equal to w. For example, an inhibitory arc can be used to express the function of “repress” in gene regulation. Through firing a test arc does not use any substance of the place at the source of the arc. For example, the transcription process can be represented by test arcs because nothing is used up by this process apart from degradation. Petri nets describe the dynamics governing proteins concentration.
3. MODELLING GRN METHODS
Modeling gene regulatory network requires representing continuous, discrete, and stochastic aspects of gene regulation as well. This fact makes the complexity of such models to be stemmed. Various types of models were examined to represent gene regulatory networks or genetic networks. For example: electrical circuits [21], Boolean networks [2, 3, 15] differential equations [6, 14, 24] stochastic Petri net [9, 10], and hybrid Petri net [19, 20].
An approach that is extensively employed to express gene regulation is differential equations. However, the disadvantage of this method lies in the difficulty of observing the regulation mechanism in the biological sense [20]. Furthermore, if a system is composed of a large network of cascades, it wouldn't be easy to depict
the entire system and observe it intuitively [17, 19]. Petri nets genetic interactions can be used to model the regulatory interactions where both the regulators and targets can be modeled by continuous and discrete elements.
In the below sub sections, several Petri net methods which are commonly used are outlined along with their respective advantages and disadvantages.
3.1 Hybrid Petri nets
The hybrid Petri net model (HPN) [7, 19] was developed as an extension of the discrete PN model. The model is able to deal with real numbers in the continuous manner. In addition, it allows us to express the relationship between continuous values and discrete values in an explicit manner. Concurrently, the decent features of discrete Petri net are kept well. Additionally, stochastic factors, which are viewed as to be vital for representing biological systems, can be incorporated in HPNs appropriately. Furthermore, HPN concept can incorporate conventional biochemical kinetic modeling with gene regulatory networks models of control and delay mechanisms [20].
Vasireddy et. al.[28] utilized HPNs to model gene regulatory networks in fission yeast cell cycle. The cell cycle is a consequent series of events and stages which cause the cell replication. The cell cycles in eukaryotic cells contain two essential processes: DNA synthesis (S-phase) and the mitosis phase (M-phase). Together they form the HPN pathways to regulate the mechanism of both S phase and M-phase promoting factors, as shown in Fig.2.
Nevertheless, the reaction rates in all transitions cannot be described because this model has no formulae. Therefore, it is sensitive to outliers and this model has no formulae to describe reaction rates in all transitions, so it is sensitive to outliers and possesses conflict situation as well (turning PN in a way where firing of one transition disables another transitions [22]), this emerged in pre(d1, T34) and pre(d1, T32) of the structural conflict K =
P1, {T1, T2,….}. In addition, this model is
subject to the definition as stated in [20], except they have used different modelling tool [19] that is determined by the concept of HFPN.
ISSN: 1992-8645 www.jatit.org E-ISSN: 1817-3195
5161 known genetic λ phage switch mechanism. In addition, utilizing HPN model made it possible to represent the gene regulatory network hierarchy. In their work, an existing tool named as VON++ has been used for modeling and simulation purposes. Fig. 3 represents the gene regulatory network that discovers the growth path of λ phage by the HPN. A set of tests and normal arcs have been used to show that mRNA is not consumed in the translation process [17]. In case of firing, a test arc does not consume any content of the place at the source of the arc. For instance, the transcription process can be represented by test arcs because nothing is used up by this process apart from degradation. Fig 4 shows an operon that contains two genes, gene1 and gene2; right with normal arcs, left with test arcs. For the case where the mRNA place is concurrently an input and an output of the transition, normal arc is used, Fig. 4 left. From the definition of HPN [7], the firing speeds of a continuous transition as well as the consuming speed have to be alike through each arc from its source place. The contents of all source places are consumed with the same speed. This speed is also identical with the production speed through each arc from the transition. This is the unfavorable characteristic of HPN [19].
3.2 Hybrid functional Petri nets
Hybrid functional Petri net (HFPN) is composed of three components which are: hybrid Petri net [1, 7], hybrid dynamic net [8], and functional Petri net [12]. discrete input arc, continuous input arc, discrete output arc, continuous output arc , and finally, test input arc are the five types of arcs that HFPN possesses.
A discrete place (continuous place) will point out an input arc (continuous input arc). this way, through firing, the content of the source place will be used up to a discrete transition (continuous transition). A test input arc is pointed out from any types of places to any type of transitions. It will not use up the substance inside the source place. These three types of arcs are known as input arcs. A discrete transition will point out a discrete output arc to any type of places while a continuous transition will point out a continuous output arc a continuous place only. These two types of arcs are known as output arcs [18, 19].
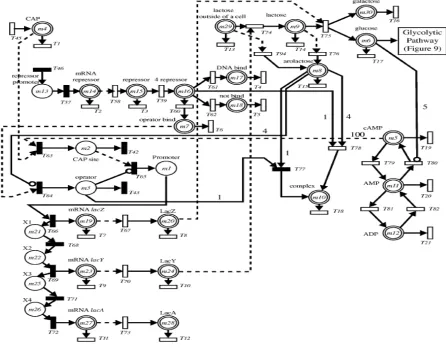
HFPN have also been used with Lac operon gene regulatory mechanism and glycolytic pathway in E. coli. The HFPN modeling begins with transcription control switch, later, it extends through positive and negative regulation increments. Fig. 5 shows HFPN
modeling of the lac operon gene regulatory network [18, 23].
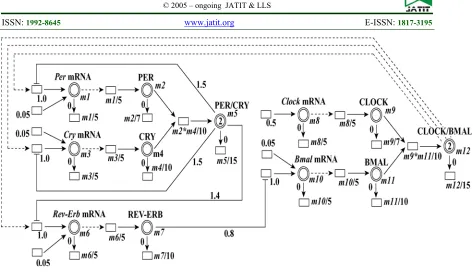
Matsuno et al. [16] applied a hybrid functional Petri net with the purpose of analyzing mammalian circadian genetic control mechanisms. The molecular interaction mechanisms through applying a computational model and using the mammalian circadian clock have been elaborated as a real example. In their paper, an HFPN model of a circadian genetic control system was developed in mammals. They assessed the mammalian circadian genetic control system using GON simulations of the developed HFPN model. Later two inconsistencies in the oscillations of mRNAs, compared with the recognized biological facts, were
discovered. Therefore, to resolve these
inconsistences, the circadian genetic control systems of mammals and fruit flies were compared. Consequently, a molecular interaction path was discovered that was available in the circadian mechanism of fruit flies however it did not exist in the circadian mechanism of mammals. Fig. 6 shows the HFPN model of the circadian gene regulatory mechanism of mammalian.
4. BIOLOGICAL FACTS ON THE NUTRITIONAL STRESS RESPONSE NETWORK IN E. COLI
5162 metabolism is needed merely. The activation of adenylate cyclase (Cya) which is an enzyme that causes the production of the metabolite cAMP, transduces the signal of carbon starvation. Instantly, the metabolite joins and activates the global regulator protein CRP. Moreover, the resulting cAMP.CRP complex is in charge of controlling the expression of key global regulators involving F is and CRP itself.
The global regulatory protein Fis is essential for the stress response. It is in charge for promoting the expression of stable RNA from the rrn operon [4, 25]. Consequently, high levels of Fis are monitored ordinarily for the period of the exponential phase. It is thought that the mutual repression which happens between Fis and cAMP CRP have a critical role in the regulatory network [25]. High levels of negative supercoiling existed at the DNA also promote the expression of Fis. Two topoisomerases are regulating the level of DNA supercoiling. These topoisomerases are GyrAB (which is composed of the products of genes gyrA and gyrB) and TopA. GyrAB promotes supercoiling while TopA removes supercoils.
Expression of TopA will be increased if DNA supercoiling is increased. Therefore, it avoids
excessive supercoiling. Any reduction in
supercoiling makes the expression of gyrA and gyrB to be increased. Next, this high level of GyrAB increases supercoiling.
5. CONSTRUCTION OF HFPN MODEL
Matsuno, et al. [19] did set the fundamental notion of HFPN that permits modeling of biological mechanisms without reforming any mathematical descriptions or any need for programming techniques. Formulating HPFN in this manner provides the maximum flexibility such as modeling of discrete and continuous processes. In addition, it requires no definition of consumed or produced quantities as functions of marking. These features elaborate why HFPN is well suited for biological simulation. Consequently, based on these particular model features, it has been used with Genomic object net for representing Genetic regulatory network for carbon starvation stress response in E.coli.
5.1 Transcriptional regulator
The transcriptional activator, is kind of a protein that boosts gene transcription; such as the global regulator Fis which is able to control the expression of stable RNAs. As known, the process of cell growth and division requires tremendous amounts of stable RNAs to be translated into
mRNAs then into proteins [21]. Therefore, in particular situations where the concentration of the transcriptional activator increases and is encoded by the Fis regulator, an induction takes place. As a result, the rate of protein synthesis increases, this is due to the functionality of Fis protein which activates the expression gene rm, and in this case Fis is a positive regulator of gene rm. The relationship between the rate of protein synthesis and regulator concentration is sigmoidal. Thus, the regulatory mechanism shown in Fig. 8 can be structured based on the sigmoidal function (1) shown below. With the help of the differential equation of Hill functions the regulation can be described as follows:
fis fis fis rrnk
x
x
(1)Where,
rrn
resembles the activity of the gene,
fis
x
is the concentration of regulator Fis,
fis
k
is a phenomenological constant.
Thus, the stable RNAs rate of expression can be reformulated as follows:
3
, fis fis rrn fis
rrn
x
k
s
x
f
(2)Where
k
rrnand3
fis
are constants that designate the rate of synthesis of stable RNAs and the threshold concentration of F is, respectively. In the equation,
the function
f
rrn
x
fis specifies that stable RNAscan be expressed at a rate of
k
rrn, ifx
fis3
fis
,
however they are can't be expressed if
x
fis
3fis.rrn rrn
Fis
ISSN: 1992-8645 www.jatit.org E-ISSN: 1817-3195
5163
5.2 Constructing the model of regulatory mechanism
This section is dedicated to provide a comprehensive model and explain the details for developing the gene expression as per controlled by the transcriptional regulator.
The model as shown in (Fig. 9) proclaims a simple
phenomenological relationship between the
transcriptional regulator concentration and the gene activity. It has a sigmoidal structure. This structure corresponds identically to the experimental observations of bacterial gene regulation. With reasonable estimates and an assumed value of 4 of protein Fis, a gene activity plots was obtained as shown in (Fig. 9). From the figure, it can be observed that the concentration of the protein is greater or equal to the threshold of its associate connector evaluated at 4.0 (M2 ≥ 3.0). The associate connector is in the enabled state where the threshold is specified by pre Fis, T1. The process of translation throughout the model has been constantly transporting Fis mRNA entities to Fis protein at a rate of 0.125 of Fis mRNA's concentration M1. Therefore, since the translation process is directly connected to the quantum of Fis mRNA represented by M1 (where this quantity depends on the M4 gene activatation by protein Fis) its output depends on the S.RNA with quantity rm, the overall equation of quantum changes would be represented as follows:
1 * 125 . 0 / 2 /
1 dt dm dt m
dm
(3)
The degradation rate of concentrations of fis mRNA
and Fis are given by m1*0.25 and m2*0.1,
respectively. Whereas, the equations for quantum change for rrn mRNA and S.RNA are:
3 * 185 . 0 / 4 /
3 dt dm dt m
dm
(4)
The degradation rate of concentrations of rrn
mRNA and S.RNA are given by m3*0.185 and
222 . 0 * 4
m , respectively.
m1 f is mRNA
[image:6.612.325.517.91.213.2]m2 Fis m1/4 m1/8 m2/10 1 1 0,05 rrn1 S.RNA m3 rrn mRNA 0,05 1 m4/4.5 m3/5.4 m3/5.4 0 0 0
Fig. 9 HFPN model of regulation mechanism
The present simulated hybrid Petri net with dynamics of protein concentrations are shown in Fig. 9. The results of this model are consistent with recorded and known biological facts, as well as with results obtained from differential equation models [25].
Fig. 9 (a) demonstrates the rrn promoter activity, and respectively the stable RNAs synthesis rate, as a function of the cellular concentration of Fis protein. However, below a certain threshold concentration of Fis, the stable RNA gene will be poorly expressed as in Fig. 9(b), though above this threshold the maximum level can be expressed.
0 20 40 60 80 100 t 5 10 15 20 25 30 35 40 45 50 rrn
0 20 40 60 80 100 t 0,2 0,4 0,6 0,8 rrn
Fig. 9: (a) Sigmoid relation between the concentration of the transcriptional regulator Fis and the rate of synthesis
[image:6.612.314.481.418.659.2]5164
5.3 Positive And Negative Feedback Loops Mechanism
This section illustrates the growth transition control using the HFPN method through analyzing a quantity of suspected positive and negative feedback loops that can have an impact on the transition process.
5.3.1 Positive feedback loops mechanism
The carbon starvation response network is represented in Fig. 7, which constitutes of several interactions between its components. The connections between different modules in particular, involve a positive feedback loop. The mutual inhibition of fis and crp and a negative feedback loop the homeostatic control of the DNA topology.
Due to the highlighted complexity, difficulty is confronted in understanding the dynamics of the system in an intuitive manner. Therefore, Petri nets modeling and computer simulation can be used to tackle and resolve questions on the dynamics of the carbon starvation response network. In this section, the method is illustrated through a two-gene network, composed of the genes crp and fis as positive feedback loops mechanism. Fig. 10 represents the hybrid function Petri net which describes the mutual inhibition of these genes and is a part of the carbon starvation response network in Fig. 7.
As it has been mentioned earlier in the preview section (2), the mark of continuous places Fis and CRP indicate the concentrations of Fis and CRP proteins, respectively. If the concentration of the protein Fis is below the threshold, it would be expressed as CRP protein. The protein is degraded at rate proportional to its own expression here
135 . 0 * 5
m and m6*0.125 for crp mRNA and
CRP, respectively. To conclude, for the model, the positive feedback loop and the mutual inhibition of Fis and CRP played a fundamental role in the transition from exponential to stationery phase.
5.3.2 Negative feedback loops mechanism
Relative concentration of the enzymes GyrAB and TopA determine the level of the DNA supercoiling. The predicted qualitative evolution of the concentrations of these two proteins in Fig. 13 implies that the DNA supercoiling level increase at the onset of stationary phase. However, this is not what was observed experimentally. On the contrary,
the DNA supercoiling level has decreased when E. coli cells entered the stationary phase [25].
The mechanism of the gene expression control by DNA supercoiling is particularly difficult to model [25]. From Fig. 11 the ratio of the GyrAB and TopA concentrations determine the DNA supercoiling level and this appeared by post (supercoiling, T10) with the firing speed
10 / 14 * 12 m
m .
5.4 HFPN Model
while applying HFPN on a large network, generalized variant of HFPN can be developed at a global level due to its hierarchical concept. having said that, the basic model will be given by the subnet of the Petri net model. besides we are already familiar with the internal functions and behavior of it. Therefore, a system can be created by connecting sub-models together in order to comprehend the whole system and to anticipate its conducts. Fig. 12 demonstrates HFPN model which is a network of key genes, proteins and regulatory interactions comprised in the carbon starvation stress response network in E.coli. This figure (Fig 12) properly contains the HFPN models 2, 7 and Fig.8. The results of the nutritional stress response of our HFPN model showed a consistency with recognized biological facts, in addition to results optioned through differential equations models.
6. SIMULATION RESULTS OF
NUTRITIONAL STRESS RESPONSE
7. Parameters of transitions such as speed, delay
and primary values of places have to be discovered after describing an HFPN of the Genetic regulatory network for carbon starvation stress response to be modeled. The basic of these parameters are those facts and/or biological knowledge that have been discussed in the biological literature.
8. Generally, to find suitable parameters for
simulation, it requires a lot of trial and error processes. . Fig. 12 is Simplified HFPN model which contain six states variables to denote the concentrations of key proteins or RNAs. Additionally, it has one exogenous variable expressing the existence of a nutritional stress signal: Fis, CRP, Cya, Signal, GyrAB. TopA and S.RNA are also described.
ISSN: 1992-8645 www.jatit.org E-ISSN: 1817-3195
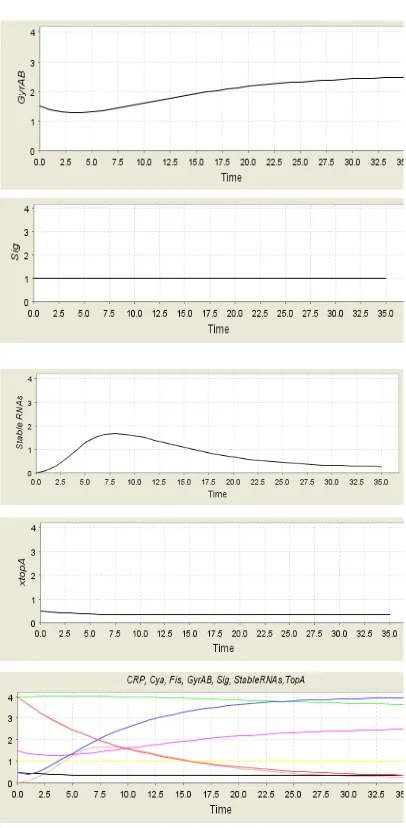
[image:8.612.320.523.105.519.2]5165 Fig. 13 shows the Simulation results of the protein concentrations, in case of having Signal. The behavior denotes the molecular events going with the transition from exponential to stationary phase. Through these simulation results one can have qualitative behavioral predictions that they are supporting the biological experimental results [4, 11, 25] to validate the model. For instance, it is considered validating when the model accurately changes from the phase of exponential to the stationary in terms of growing. The petri net is set to a state denoting the exponential phase meanwhile the signal is activated to denote the existence of carbon starvation. Fig 13 demonstrates the temporal development of selected protein concentrations in the period of the transition from exponential to stationary phase. It is in the state transition graph in a representative path
[image:8.612.91.307.462.725.2]As soon as getting the carbon starvation signal, the concentration of Fis will be decreased. Then, the stable RNA concentration will be decreased. After this event, the next event is about the increment of CRP’s level. When the concentration of GyrAB grows, the concentration of TopA stays invariable. Nevertheless, the level of cAMP.CRP and DNA supercoiling, are not clearly modelled [25]. As anticipated, the results demonstrate that the transition from exponential to stationary phase is blocked; the formation of cAMP, CRP is prevented because of global regulator protein absence. This formation is required to start the phase transition.
Fig. 13 Simulation Results Of The Protein Concentrations, When Signal Is Present. The Behavior
Represents The Molecular Events Accompanying The
Transition From Exponential To Stationary Phase.
9. CONCLUSIONS
In order to deal with real numbers in a continuous manner, the hybrid petri net model (HPN) [1] has been developed as an extension of the discrete petri net model. It also provides a mean to express explicitly the relationship between continuous values and discrete values. These along with keeping the decent features of discrete Petri net well.
5166 [19] with available tool genomic object net [29]. In this paper, a model for the genetic regulatory network has been created for the purpose of both modeling and simulation. This model underlies the carbon starvation stress response in E. coli [11, 25]. The approach used in this paper for modeling and simulating Genetic regulatory network offers an effective test of the hypothesis that is going to be established by biologists. Simulation tests have been used specially to prove the correctness of our model to examine the behavior of genetic regulatory network in details. Furthermore, the
studies for modeling gene regulatory network with HPN as well as HFPN are explained.
[image:9.612.96.554.233.427.2]The validation was achieved by comparing the results obtained with the FN model and HPN tool; both methods have the same reasoning outcomes. It verifies that the confidence value of the cells growth can be successfully reasoned by the proposed model. This process can be applied to other genetic regulatory networks algorithms as well, including those with more complex regulatory relationships.
Fig. 2. Hybrid Petri net model of cell cycle regulation in Fission Yeast of both S-phase and M-phase [28].
[image:9.612.93.548.477.702.2]ISSN: 1992-8645 www.jatit.org E-ISSN: 1817-3195
5167
m1
S1 m2
mRNA
m3 P1
m4 P2 m5
mRNA m6
S2 m7 F
m1
S1 m2
mRNA
m3 P1
m4 P2 m5
mRNA m6
[image:10.612.94.459.85.250.2]S2 m7 F
Fig. 4. HPN model for two-gene operon model: Right with normal arcs, Left with test arcs
[image:10.612.95.541.303.652.2]5168
Fig. 6.HFPN model of the mammalian circadian gene regulatory mechanism
Fig. 7 . Genetic regulatory network for carbon starvation stress response in E. coli.
GyrAB
Fis Stable RNA
Signal CRP
Supercoiling
TopA
[image:11.612.105.487.396.548.2]ISSN: 1992-8645 www.jatit.org E-ISSN: 1817-3195
5169
m5 crp mRNA
m6 CRP
m2 Fis
m1
f is mRNA
1
m5/3.89
m2/10 m1/4
m1/8
0,05 1
0,05
m5/7.4 m6/8
[image:12.612.94.521.62.348.2]6 5
Fig. 10 HFPN as positive feedback loops mechanism of fis and crp the mutual inhibition.
m16 supercoiling m15
topA mRNA
m14 TopA
m12 GyrAB m13
gyrAB mRNA 1
m16/10
m12*m14/10 0,05
m15/5
m15/4 m14/4
m12/9.42 m13/4.82
m13/18.5
0,05 1
3,5 2,7
2
1,5
[image:12.612.119.496.388.631.2]5170
m1 fis mRNA m2 Fis
m4 S.RNA m3
rrn mRNA
m10 cya mRNA
m9 CYA
m6 CRP m5
crp mRNA
m7 cAMP m8
cAMP.CRP m11
Signal
m13 gyrAB mRNA
m12 GyrAB
m14 TopA m15
topA mRNA m16
supercoiling 1
0,05
m1/8
m1/4 m2/10 m3/5.4 m4/4.5 m3/5.4
0,05 1
1
0,05
m10/5
m10/6 m9*0.02
m6/2 m5/7.4
m5/3.89
0,05
m6*m7/10
m7/10 m8/10
0.5
1
0,05
m13/18.5
m13/4.82 m12/9.42 m15/4 m14/4 m15/5
0,05 m12*m14/10
m16/10
1 1 5
4,5
6
2 1
3 4
3,5
1,5 3,5
2
2,7
[image:13.612.109.497.74.491.2]3
Fig. 12 Simplified HFPN model of Genetic regulatory network for carbon starvation stress response in E. coli
REFERENCES
[1] H. Alla, and R. David, (1998) Continuous and hybrid Petri nets. Journal of Circuits, Systems, and Computers, 8(1), 159–188.
[2] T. Akutsu, S. Kuhara, O. Maruyama, and S. Miyano, Identification of gene regulatory networks by strategic gene disruptions and gene over expressions, Proc. 9th ACM-SIAM Symp. Discrete Algorithms, 695-702, 1998.
[3] T. Akutsu, S. Miyano, and S. Kuhara, Identification of genetic networks from a small number of gene expression patterns under the Boolean network model, Pacific Symposium on Biocomputing'99, 17-28, 1999.
[4] G. Batt, D. Ropers, H. de Jong, J. Geiselmann, R. Mateescu, M. Page and D. Schneider. Validation of
qualitative models of genetic regulatory networks by model checking: analysis of the nutritional stress response in Escherichia coli. Bioinformatics, 21:i19–i28, 2005.
[5] J. M. Bower and H. Bolouri. Computational Modelling of Genetic and Biochemical Networks. MIT Press, 2001.
[6] T. Chen, H. L. He, and G. M. Church, Modeling gene expression with differential equations, Pacific Symposium on Biocomputing'99, 29-40, 1999. [7] R. David, H. Alla. Discrete, Continuous, and
Hybrid Petri Nets. vol. 3-540-22480-7, Springer, Berlin, 2005.
[8] R.I. Hamed. Modeling and Simulation of Lac
Operon Regulation of E. coli bacterium Using
Intelligent Fuzzy System. Saudi Journal of
ISSN: 1992-8645 www.jatit.org E-ISSN: 1817-3195
5171 [9] P. J. E. Goss and J. Peccoud, Analysis of the
stabilizing effect of Rom on the genetic network controlling ColE1 plasmid replication, Pacific Symposium on Biocomputing'99, 65-76, 1999. [10]P. J. E. Goss and J. Peccoud, Quantitative modeling
of stochastic systems in molecular biology by using stochastic Petri nets, Proc. Natl. Acad. Sci. USA, 95, 6750-6755, 1998.
[11]R. Hengge-Aronis,: The general stress response in Escherichia coli. In: Storz, G., Hengge-Aronis, R. (eds.) Bacterial Stress Responses, 161–77. ASM Press (2000).
[12]R. Hofest¨adt, and S. Thelen. Quantitative modeling of biochemical networks, In Silico Biology 1, 39– 53. 1998.
[13] R.I. Hame. Esophageal cancer prediction based on qualitative features using adaptive fuzzy reasoning method. J. King Saud. Univ. -Comput. Info. Sci. 27, 129–139, 2015.
[14]K. Kyoda and H. Kitano, Simulation of genetic interaction for Drosophila leg formation, Pacific Symposium on Biocomputing'99, 77-89, 1999. [15]S. Liang, S. Fuhrman, and R. Somogyi, REVEAL, a
general reverse engineering algorithm for inference of genetic network architectures, Pacific Symposium on Biocomputing 3, 18-29, 1998. [16]H. Matsuno, S.I.T. Inouye, Y. Okitsu, Y. Fujii, and
S. Miyano. A new regulatory interaction suggested by simulations for circadian genetic control mechanism in mammals. J Bioinform Comput Biol. v4 i1. 139-153, 2006.
[17]H. Matsuno, A. Doi. Hybrid Petri Net Representation of Gene Regulatory Network. Available at: http://helix-web.stanford. edu/psb00/matsuno.pdf. Accessed January 5, 2005.
[18]H. Matsuno, Sachie Fujita, Atsushi Doi, Masao Nagasaki, Satoru Miyano. Towards Biopathway Modeling and Simulation. ICATPN 2003: 3-22.
[19]H. Matsuno, Y. Tanaka, H. Aoshima, A. Doi, M. Matsui, S. Miyano. Biopathways Representation and Simulation on Hybrid Functional Petri Net, In Silico Biology, 3(3), 389–404, 2003.
[20]H. Matsuno, A. Doi, M. Nagasaki, and S. Miyano. Hybrid Petri net representation of gene regulatory network. Pacific Symposium on Biocomputing, 338–349. 2000.
[21] R.I. Hamed, Ahson, S.I. Confidence value
prediction of DNA sequencing with Petri net model.
J. King Saud. Univ. -Comput. Info. Sci. 23, 79–89. 2011.
[22]T. Murata. Petri nets: properties, analysis and applications. Proceedings of the IEEE, 77(4):541– 580, 1989.
[23]R.I. Hamed, Ahson, S.I., Parveen, R. Designing genetic regulatory networks using fuzzy Petri nets
approach. Int. J. Autom. Comput. 7, 403–412.
2010.
[24]B. Novak, A. Csikasz-Nagy, B. Gyorffy, K. Chen, and J. J. Tyson, Mathematical model of the fission yeast cell cycle with checkpoint controls at the G1/S, G2/M and metaphase/anaphase transitions, Biophysical Chemistry 72, 185-200, 1998.
[25]R.I. Hamed, Ahson, S.I., Parveen, R., 2010a. Designing genetic regulatory networks using fuzzy Petri nets approach. Int. J. Autom. Comput. 7, 403– 412.
[26]E. D. Sontag: Molecular systems biology and control. European Journal of Control. 11, 396–435, 2005.
[27]R.I. Hamed, Ahson, S.I., Parveen, R. A new approach for modelling gene regulatory networks using fuzzy petri nets. J. Integr. Bioinform. 7, 113. 2010.
[28]R. Vasireddy and S. Biswas. Modeling Gene Regulatory Network in Fission Yeast Cell Cycle Using Hybrid Petri Nets. ICONIP. 1310-1315, 2004
[29]Genomic object net: http://www.GenomicObject .Net/.
[30]Raed I. Hamed.Analysing the Score Matching Of DNA Sequencing Using an Expert System of
Neuro-Fuzzy. Journal of Theoretical and Applied
![Fig. 1. Central Dogma [27]](https://thumb-us.123doks.com/thumbv2/123dok_us/8906053.956877/3.612.95.305.66.281/fig-central-dogma.webp)

![Fig. 2. Hybrid Petri net model of cell cycle regulation in Fission Yeast of both S-phase and M-phase [28]](https://thumb-us.123doks.com/thumbv2/123dok_us/8906053.956877/9.612.93.548.477.702/hybrid-petri-model-cycle-regulation-fission-yeast-phase.webp)