Full Length Research Article
QUALITY EVALUATION OF A SELECTED PARTITION: AN APPROACH BASED ON
RESAMPLING METHODS
1, *
Osvaldo Silva,
2Helena Bacelar-Nicolau,
3Fernando Nicolau and
4Áurea Sousa
1
University of Azores, Department of Mathematics, CICS.UAc/CICS.NOVA.UAc, Portugal
2University of Lisbon, Faculty of Psychology and ISAMB-FML, Portugal
3
New University of Lisbon, FCT, Department of Mathematics, Portugal
4University of Azores, Department of Mathematics, CEEAplA, Portugal
ARTICLE INFO ABSTRACT
The aim of this work on cluster analysis is to provide a methodology to analyse and assess the quality of a selected partition (the best partition according to several validation indexes). In the proposed approach, the evaluation of the stability and of the consistency of the results of the selected partition (original partition) was done using the comparison between this partition and each of the partitions (with the same number of clusters that the original one) obtained by resampling. A special emphasis is given to an index defined by linear combination of four indicators, which allows evaluating the adjustment between the original partition and each of the partitions (and / or set of obtained partitions) obtained from resampling data. The application of these indexes is exemplified using a set of real data, and the main conclusions are summarized and discussed.
\
Copyright©2016, Osvaldo Silva et al. This is an open access article distributed under the Creative Commons Attribution License, which permits unrestricted use, distribution, and reproduction in any medium, provided the original work is properly cited.
INTRODUCTION
Cluster analysis involves the organization of a set of elements into groups (classes or clusters) with a high intra-group homogeneity and a high inter-group heterogeneity (Jain and Dubes, 1988). The quality of the results is often difficult to assess, given the existence of a number of factors that influence them and the multiplicity of possible clustering results. Depending on the comparison measures (between elements and between clusters) and of all strategies adopted, different clustering structures can be obtained. It should be noted also that many of the comparison measures between elements are affected by the addition of outliers, which affects the quality of the results. Thus, it is important the use and development of validation methodologies, based on the comparison of partitions using resampling methods. A major reason for using validation, in the context of comparing a set of partitions, is that results of different clustering methods from the same dataset may differ substantially.
*Corresponding author: Osvaldo Silva,
Department of Mathematics, University of Azores, CICS.UAc/CICS.NOVA.UAc, Portugal.
An obtained partition is stable when it is not much affected by small changes (either using subsamples, introduction of noise, outliers or missing values) in the initial data (Ben-Hur et al.,
2002) or by using different clustering algorithms. Thus, a result of a classification is considered stable when it captures the underlying structure of the dataset under the assumption that this partition can be reproduced with other data obtained from the same dataset (Lange et al., 2004). A low variability in the partitions is interpreted as a high consistency of the obtained results (Cheng and Milligan, 1996). In this context, we highlight the importance of verifying the permanence of the elements to be classified in certain clusters in the set of the partitions to be compared. Several indexes based on the concept of stability have been proposed (e.g., Domany and Levine, 2001; Ben-Hur et al., 2002; Lange et al., 2004; Smolkin and Ghosh, 2003; Fridlyand and Dudoit, 2001; Bertoni and Valentini, 2007). However, it is often unclear how these indexes are used in practice (Hennig, 2004), given that a single index provides a limited classification evaluation. Silva
et al. (2012) presented a global approach concerning to the evaluation of the quality of clustering results obtained by different clustering algorithms using multiple information
ISSN: 2230-9926
International Journal of Development Research
Vol. 06, Issue, 07, pp.8640-8646, July,2016
DEVELOPMENT RESEARCH
Article History: Received 24th April, 2016
Received in revised form 26th May, 2016
Accepted 29th June, 2016
Published online 31st July, 2016 Key Words:
Comparing partitions, Cluster stability,
(e.g., stability, homogeneity and isolation of the clusters). The purpose of this paper is to analyse some indexes to evaluate the quality of partitions based on several types of information, including the values (corresponding to each level of the dendrograms) concerning with the: i) number of common elements in the clusters of the two partitions, ii) information associated with the isolation and homogeneity of each of the clusters, iii) global statistics of levels, STAT, and iv) fusion coefficient, CF. The use of these indexes based on a real dataset is illustrated in the section concerning to the main results.
Measures of agreement and stability of the clustering results by resampling
Let E= {x1,..., xm} be a set of m elements (h =1,..., m), to be
classified, Po = {c1,c2, ..., ck}a partition into k clusters obtained
from the initial data matrix, P
c1 ,c2 ,...,ck
another partition into k clusters, obtained from the data matrix corresponding to the resampling
(1 ≤
≤ r), and r the number of resamples. Based on this notation, some measures of agreement and stability are referred in this section. The first are related to the two partitions, P0 andP. For each element,h, (h=1,…, m) we compare the cluster in which his included in the original partition (base), P0, with the cluster in which h
belongs in the partition P, considering also the information regarding the number of elements in each cluster. The stability indexes are obtained based on the comparison of the original partition, P0, with each one of the partitions obtained in the
r random resamples.
Indexes based only on the common elements
Let ci (i=1,..,k) be the cluster of partition Po, obtained from the initial data matrix,
c
i the corresponding cluster of partition
P
, obtained with the data from resampling
. The agreement index (AI) between each cluster ci, i =1,…,k, of the partition Po and the corresponding cluster,c
i ,of partitionP
,may be defined by:
i j i k j 1 i ic
card
c
c
card
max
c
c
AI
,
, (1)The corresponding agreement index between the partitions Po and
P
may be defined by:
,
,
,..., 1 0
i i
k
i AI c c
Median P
P AI
. (2)
The higher the values obtained through formulae (1) and (2) the better the consistency of the obtained results. The stability index for the cluster ci belonging to the initial partition Po may be obtained based on the comparison between this partition,
Po, and the corresponding partitions of the r resamples, according to the following formula:
r i i
i Median AI c c
c
E ,
,..., 1
(3)
The stability index concerning to the original partition, Po, can
be calculated through:
0,
,..., 1
0 Median AI P P
P E
r
, (4)
Where AI
P0,P
is obtained by formula (2). The higher thevalues obtained through formulas (3) and (4), the higher will be the stability of the obtained results.
Index based on the concepts of homogeneity and isolation
In cluster analysis, the concepts of homogeneity (compactness) and isolation or separation are behind the idea of classes (clusters). That is, it is intended that a cluster is a set of similar entities and that entities belonging to different clusters are not similar (Everitt, 1993). Based on these concepts, the Silhouette index (Rousseeuw, 1987), known as Sil, was developed in order to assess the relative compactness and isolation of clusters, and distinguishing between their core and outlying members. The values of Sil are comprised between -1 and +1. Negative values of this index indicate that the element is more similar to elements of another cluster, and values near +1 indicate that the element strongly belongs to the cluster in which it has been placed. The indexes in this section are based on a modified version of this index (Sousa et al., 2014). In this section, we present an agreement index between the original partition, P0, and the partition obtained through resampling,
P
, based on information associated to the isolation andhomogeneity of each cluster (
i
i c
c ), with
=1,…,r, where
i
c
is the cluster of the resample
for which a maximum of
j
i c
c
card , j=1,…,k, is verified. Therefore, the following
steps consist in the calculation of the values of:
i. Sil for each element h,
i i c
c
h ,denoted by Sil(h), and for each cluster
i i c
c , denoted by
i i c c classe
Sil ,
based on the proximity matrix concerning to the original data;
ii. Sil for each element h, h
ci ci
, denoted by Sil (h), and for each cluster
ci ci
, denoted by classe
ci ci
Sil , based on the proximity matrix
related to the data matrix obtained from the
resample
=1,…, r;
iii. agreement index of element h, h
cici
, using the expression: Sil (h) (h) Sil (h) AISil , (5)
Where Sil(h) and Sil (h) were indicated, respectively, in i)
and ii);
iv) agreement index between
i
i c
c and , considering the homogeneity and the isolation of the elements, defined by:
i i i i i i Sil c c classe Sil c c classe Sil c c AI v)agreement index between Po and P, given by:
Sil i i
k i
Sil P P Median AI c c
AI , ,
,..., 1 0
; (7)
vi) Stability index of element h, h
cic j
, which can bedefined by:
( )
) ( ,...,1 AI h
Median h E Sil r Sil
; (8)
vii) stability index of
c
i,
defined by:
r Sil i i
i
Sil c Median AI c c
E ,
,..., 1
; (9)
viii) stability index of Po, defined by the expression:
AI P P
Median P
E Sil
r
Sil( ) 0,
,..., 1 0
; (10)
xi) global consistency index of resample
, defined by:
( )
) (
,...,
1 AI h
Median ICG Sil m h Sil
(11)
If the values of the agreement indexes given by formulae (6) and (7) are within the interval [0.975, 1.025], then we must admit that there are similar results between the original partition, P0, and the corresponding partition of the
resample, P , as far as homogeneity and isolation areconcerned. Thus, if the values in these indexes are within the interval [0.975, 1.025], for the partitions obtained through multiple resamples there will be a greater confidence in the choice of the original partition and in the robustness of the results. In that case, the values obtained through formulas (9) to (10) will be very close to 1. In contrast, values of the agreement index corresponding to formulas (6) and (7) that are less than 0.975 (respectively, higher than 1.025) mean that the corresponding structure of the original partition is better (respectively, worse) than the one of the resample
, regarding to homogeneity and isolation.Indexes based on the preordination associated with each of the partitions
The global statistics of levels, STAT, is a global statistic that measures the information given by the corresponding partition, compared to the initial preordination associated with the used (dis)similarity coefficient (e.g., Lerman 1981; Bacelar-Nicolau, 1980, 1988). A good cut-off level corresponds to a partition in which the STAT index shows a significant increase, relatively to the values provided by the neighboring levels. Once the most significant partition (the best partition according to some validation indexes) of the original dataset,
Po = {c1, c2, ..., c k}, containing k clusters is chosen, we will compare it with the partitions with the same number of clusters obtained through resampling, noting the number of common elements in each of the k clusters of the two partitions and identifying the set of pairs assembled in the same cluster and the set of separated pairs. Subsequently, the values of the
agreement and stability indexes defined by the following expressions can be calculated:
0 i i P P n 2 k 1 i c c 20,P
P STAT STAT C C AI card STAT
(12) And
AI
P
P
Median
P
E
STATr 0
STAT 0
,
,..., 1
(13)If preordination on a certain level, v, is equal for the two partitions being compared, the respective STAT values are equal and hence their ratio, which is part of formula (12) is equal to the unity. The weight used in determining the index
AI
STAT
P
0,
P
takes into account the number of pairs of elements together in the same cluster in the partitions P0and
P
in relation to the total number of pairs. The higher thevalue of AISTAT
P0,P
that is, the closer of the unity, the greater the degree of agreement between the two partitions. Thus, the value of ESTAT
P0 gives us an indication of the degree of stability of the original partition.Indexes based on the fusion coefficient
The fusion coefficient is the numerical value at which various cases merge to form a cluster in the context of hierarchical methods. For each of the obtained dendrograms, the corresponding fusion coefficient values, CF, may be noted for each of the levels, v, then determining the rate of variation,
ΔCF
, of the values of this coefficient when switching from level v-1 to level v, by the following expression:1) CF(v 1) CF(v CF(v) ΔCF(v)
, (14)
denoted by CF(v). Let
CF (k) ando ) k ( CF
be valuesobtained in the partition level corresponding to k clusters,
respectively, in resample
, with
=1,…,r, and the original classification. Using this notation, we can calculate the ratiobetween the values of
CFo(k)from the original partition, P0,and
CF (k), from the partitionP
, with
=1,…,r, defined by the expression:
. ,
) (
) (
0 o
k CF
k CF
CF P P
AI
(15)
A value of
AI
CF
P
0,
P
close to 1 indicates a strong association between the original partition and the partitionobtained in there sample
. Note, in particular, that if the condition AICF
P0,P
1,
1,,r
is verified, the original partition, P0 will present a very high stability. We can also calculate the stability index of partition P0, using thefollowing formula:
AI
P
P
Median
P
E
CFr
CF
0
,
,..., 1 0
, (16)Where values close to 1 indicate a strong stability of the original partition. Note that, the Sil, STAT and CF indexes are based in different types of information and their values depend on the used comparison measures. Therefore, what we propose are modified functions of these indexes in order to standardize their values. TheAI
P0 ,P
,ICGSil(),AISTAT
P0,P
, and
P P
AICF 0, indexes given by the formulae (2), (11), (12),
and (15) may be combined in a table, such as Table 1. In addition, based on this table, we can assess the degree of agreement between the four indicators in the set of r resamples using the Kendall correlation coefficient, in order to evaluate the agreement between these indicators in the overall set of resamples. Based on the linear combination of the indexes presented in Table 1, we consider the index defined bythe following expression:
Ajust
(
)
=1*AI
P
0,
P
+2*ICG
Sil(
)
+3*
P
P
AI
STAT 0,
+4*AI
CF
P
0,
P
, (17)where 1, 2, 3 and 4 are the weights associated with each
of the coefficients, 1+2+3+4=1, and
=1,…,r. The Ajust)
(
index aims to assess the adjustment between the original partition and each of the partitions referring to each one of the resamples. The global adjustment between the original partition and the set of partitions obtained through resampling may be evaluated based on the values of the index Ajust(
)
in the set of the r resamples, as shown in the following expression:
( )
,...,
1
Ajust
Median Ajust_Glob
r
. (18)
In case we want to compare various methods, the values obtained by the Ajust_Glob index for each of the methods allow their sorting according to the obtained degree of adjustment. Thus, we obtain an indication of which methods provide a more similar structure to that of the partition considered to be the most significant in the original data set. Considering also the values of the indexes AI
P0,P
,) (
ICGSil , AISTAT
P0,P
, andAI
CF
P
0,
P
obtained inthe r resample, as shown in Table 1, one can resort to Kendall concordance coefficient and the corresponding significance test, for an overall assessment of the degree of agreement of the r resample in relation to the values of these indexes.
RESULTS
The Ascending Hierarchical Cluster Analysis (AHCA) of twenty-two variables (items) present in a questionnaire, which correspond to statements concerning attitudes / beliefs of the students towards Statistics in the courses of Human and Social Sciences in Higher Education (Silva et al., 2007, 2009), was performed in order to obtain a typology of the variables. The AHCA was based on the affinity coefficient combined with twenty five aggregation criteria, twelve of which were classical and thirteen probabilistic (Nicolau, 1983; Nicolau and Bacelar-Nicolau, 1998).In the case of the analyzed dataset, using only the information given by the data themselves and the set of partitions obtained from twenty-five aggregation criteria, the selected partition, according to the (Goodman and Kruskal, 1954), DIF (Bacelar-Nicolau, 1980), Sil (Sousa
et al., 2014) indexes and to the U Mann Whitney statistics (1947), is a partition into four clusters: c1: {V1, V2,V11, V14,
V15}; c 2: {V3, V9,V21, V22, V4,V16, V20, V6, V17,
V19}; c3: {V5, V7, V8}; and c4: {V10, V13, V18, V12}. In
order to undertake an assessment of the quality of this partition, we opted for the use of resampling within a methodology for evaluating and comparing partitions (Silva, 2011). Fifty sub-samples were obtained from the initial data (sampling rate of 80%) using the simple random sampling. Then, we applied the same AHCA algorithm to data matrices corresponding to the various sub-samples and wrote the constitution of the partitions into four clusters for each one of the resamples. In the context of comparing the most significant partition obtained from the initial data set with each partition obtained from the fifty subsamples, we used the indexes presented in the second section for the case of usage of the resampling methods, so as to test the stability and agreement of the obtained results. In Table 2 we present the values relative to the indexes
i i c c
AI , andAI
P0,P
, withi=1,…, 4 and
=1,…,50, which correspond, respectively, to the formulae (1) and (2). We also present the values of the
ciE andE
P0 indexes to assess, respectively, the stability of each cluster and of the original partition. In the case of
P P
The large values of the median concerning to theAI
P0,P
,
ciE and E
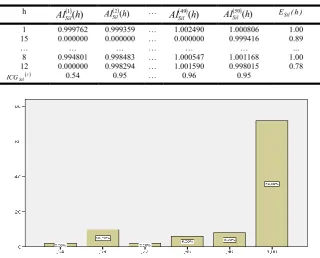
P0 indexes showed in Table 2 point to a good agreement and stability of the clusters and of the original partition (most values are equal to one). Moreover, the corresponding mean values allow to complement the information associated with these indexes in order to identify, for example, the more stable clusters (in this case are the first three clusters). Thus, in Figure 1, we present the values of the ICGSIL () index using the mean instead of the median in theformula (11). Table 3 shows the results obtained from the application of theAISil (h)
,ESil(h), and ICGSil indexes. From this table the values may be obtained from other indexes, namely from the ESil
ci index, i=1,…,4, whichvalues are,
respectively, 0.99, 0.93, 0.98, and 0.88, and from the ESil
P0index which value is 0.94. As can be seen from Table 3, the values of ESil(h) index, h=1,…,22, defined by formula (8), support the conclusion that the variables V1,V11, V2,V14, V9,V21, V22, V7, and V8 have a perfect fit, while the variables V4,V16, V20, V6, and V17 are those which have a lower degree of stability due to the presence of these variables not in the same cluster in some of the partitions obtained by resampling. It appears that the most stable clusters are c1 and
c3, while the less stable is the cluster c4, as indicated by
iSil
c
[image:5.595.153.437.76.141.2]E
index, i=1,…,4. It is noteworthy the high stability of the original partition, as can be concluded from the value (0.94) obtained by the ESil
P0 index. From Figure 1, it is concluded that, although there is an appreciable amplitudeTable 1 – Values ofAI
P ,P
0 , ICGSIL(), AISTAT
P0,P
and AICF
P0,P
in r resamplesResample
AI
P0,P
ICGSIL() AISTATP0,P AICF
P0,P
1 AI
P0,P1
ICGSIL (1) AISTAT(P0,P1) AICF(P0,P1)2 AI
P0,P2
ICGSIL (2) AISTAT(P0,P2) AICF(P0,P2) … … … …
[image:5.595.142.456.174.262.2]r AI
P0,Pr
ICGSIL (r) AISTAT(P0,Pr) AICF(P0,Pr)Table 2. Evaluation of agreement and stability of the clusters and of the original partition
Agreement Resample
AI
c1,c1
2 2,c
c
AI AI
c3,c3
4 4,c
c
AI AI
P0,P
1 0.8 0.5 1 0 0.65; 0.575
… … … …
50 1 0,9 1 1 1; 0.975
Stability
c1E E
c2 E c3 E
c4 E P0 [image:5.595.136.457.290.548.2]1; 0.988 1; 0.976 1; 0.98 1; 0.88 1; 0.956
Table 3. Agreement and stability indexes based on the Sil values
h
) (
1
h AISil
) (
2 h
AISil … ( )
49
h AISil
) ( 50
h
AISil ESil(h)
1 0.999762 0.999359 … 1.002490 1.000806 1.00 15 0.000000 0.000000 … 0.000000 0.999416 0.89
… … … ...
8 0.994801 0.998483 … 1.000547 1.001168 1.00 12 0.000000 0.998294 … 1.001590 0.998015 0.78
Sil
ICG 0.54 0.95 … 0.96 0.95
with respect to the values of the global consistency index,
), (
ICGSIL
=1,…,50, each of the r resamples (formula (11)) when compared with the original partition, most of these resamples (72%) have a perfect consistency, with only a small fraction of resamples (2%) having a relatively low consistency. The Ajust(
)
index given by formula (17) returned the highest values concerning resample partitions that had a more similar structure to that of the original partition. In this example, we included in formula (17) only the
P P
AI 0, andICGSil() indexes. The obtained value (0.908) for theAjust_Globindex corresponding to formula (18) is an indication that the original partition, P0, is robust.
DISCUSSION
The indexes presented in this paper allow us to assess the adjustment between the original partition and each of the partitions obtained from resampling methods, using the multiple information provided by some agreement indexes, calculated for the several levels of the dendrograms. We have also presented a general adjustment (Ajust_Glob) index. The values associated with the Ajust
(
)
index in the various resamples were calculated in order to evaluate the global adjustment between the original partition and each of the partitions belonging to each one of resamples, while the values obtained by the Ajust_Glob index aim to assess the overall adjustment between the original partition and all the partitions obtained by resampling. In the case of the data set "Attitudes and Beliefs towards Statistics" the application of the used indexes allowed us to verify that the partition under evaluation is robust and consistent. The used indexes allow a better evaluation of the stability and consistency of a selected partition, since a high stability is associated with a high consistency of the results. However, it is important to note that obtaining stable results does not necessarily imply the identification of the most concordant partition with the actual existing structure in the population. The use of various strategies to evaluate the agreement and stability of the reference partition gives us the possibility to obtain additional information we consider relevant to support the situation under analysis.REFERENCES
Aldenderfer, M.S. and Blashfield, R.K. 1984. Cluster Analysis. Sage University Papers.
Bacelar-Nicolau, H. 1980. Contributions to the study of comparison coefficients in cluster analysis.Ph.D.Thesis (in Portuguese), Universidade de Lisboa, Portugal.
Bacelar-Nicolau, H. 1988. Two Probabilistic Models for Classification of Variables in Frequency Tables. In: Classification and Related Methods of Data Analysis, H.H. Bock (Ed.), Nort-Holland, 181-186.
Ben-Hur, A., Elisseeff, A., Guyon, I. 2002. A Stability based Method for Discovering Structure in Clustered Data. In Pacific Symposium on Biocomputing, 6-17.
Bertoni, A., Valentini, G. 2007. Model Order Selection for Bio-Molecular Data Clustering.BMC Bioinformatics 2007, 8 (Suppl.3).
Cheng, R., Milligan, G. W. 1996. Measuring the Influence of Individual Data Points in a Cluster Analysis. Journal of Classification, 315-35.
Everitt, B. S. 1993. Cluster Analysis (3 ed.. Edward Arnold). Fridlyand J., Dudoit, S. 2001. Applications of Resampling
Methods to Estimate the Number of Clusters and to Improve the Accuracy of a Clustering Method. Technical Report 600, Department of Statistics, University of California, Berkeley.
Goodman, L. A. and Kruskal, W.H. 1954. Measures of Association for Cross-Classifications. Journal of the American Statistical Association, 49, 732-64.
Hennig, C. 2004. A General Robustness and Stability Theory for Cluster Analysis. Preprint 2004-07, Fachbereich Mathematik - SPST, Hamburg.
Jain, A. K. and Dubes, R. C. 1988. Algorithms for Clustering Data. NJ Prentice Hall.
Lange, T., Roth, V., Braun, M., Buhmann, 2004. Stability based Validation of Clustering Solutions. Neural
Computation, 16(6):1299-1323.
Lerman, I. C. 1981. Classification et Analyse Ordinale des Données. Paris, Dunod.
Levine, E., Domany, E. 2001. Resampling Method for Unsupervised Estimation of Cluster Validity. Neural
Computation, 13(11): 2573-2593.
Mann, H. B., Whitney, D. R. 1947. On a Test of Whether One of Two Random Variables is Stochastically Larger than the Other. Annals of Mathematical Statistics, 50-60.
Mojena, R. 1977. Hierarchical grouping methods and stopping rules: an evaluation. Computer Journal, 20, pp. 359-363. Mojena, R. and Wishart, D. 1980. Stopping rules for Ward´s
clustering method. Proceedings of COMPSTAT 1980. Wurzburg, Germany: Physika-Verlag.
Nicolau, F.C. 1983. Cluster analysis and distribution function,
Methods of Operations Research, vol. 45, pp. 431-433. Nicolau, F.C. and Bacelar-Nicolau, H. 1998. Some trends in
the classification of variables. In: Hayashi, C., Ohsumi, N., Yajima, K., Tanaka, Y., Bock, H.-H., &Baba, Y. Eds.), Data Science, Classification, and Related Methods. Springer-Verlag, pp. 89-98.
Rousseeuw, P. J. 1987. Silhouettes: A Graphical Aid to the Interpretation and Validation of Cluster Analysis. Journal
of Computation and Applied Mathematics, 20, 53-65.
Silva O., Bacelar-Nicolau, H., Nicolau, F. 2009. Como Avaliar a Consistência dos Resultados de uma Análise Classificatória Hierárquica. In: Oliveira, I. et al. Eds. Actas do XVI Congresso Anual da Sociedade Portuguesa de Estatística, 2008, Edições S.P.E., 661-672.
Silva O., Bacelar-Nicolau, H., Nicolau, F.C. 2007. Utilização da Análise Classificatória para Avaliar as Atitudes/Crenças em Relação à Estatística de Alunos da Área de Ciências Sociais e Humanas. In: Ferrão, M. et al. Eds. Actas do XIV Congresso Anual da Sociedade Portuguesa de Estatística, 2006, Edições S.P.E, 751-759.
Silva, O. 2011. Contributions to the Evaluation and Comparison of Partition in Cluster Analysis. Ph.D. Thesis (in Portuguese), Universidade dos Açores.
Smolkin, M., Ghosh, D. 2003. Cluster Stability Scores for Microarray Data in Cancer Studies. BMC Bioinformatics, 36 (4).
Sousa, Á., Nicolau, F.C., Bacelar-Nicolau, H., Silva, O. 2014. Cluster Analysis using Affinity Coefficient in order to identify religious beliefs Profiles. European Scientific Journal (ESJ), vol. 3 (Special edition), 252 – 261.