Polynomial Color Image Compression
Ghadah Al-Khafaji¹٭ and Marwa Bassim ²٭
¹ Department of Computers, College of Science, University of Baghdad, Baghdad, Iraq. ² Department of Computers, College of Science, University of Baghdad, Baghdad, Iraq.
Abstract
In this paper a color polynomial image compression scheme is suggested, it is based on utilizing the color bands of RGB color system solely along with exploiting the linear polynomial coding of variable block sizes according to the correlation embedded between bands. The test results of the suggested method are promising especially in case with mixed symbol encoder techniques compared with different symbol encoder techniques.
Keywords — Color image compression, polynomial coding, and mixed between symbol encoder techniques
I. INTRODUCTION
Compression methods are being rapidly developed to compress large data files such as images, where data compression in multimedia applications has lately become more vital [1]. Generally, a compression system represents the essential form of information processing used to manipulate significant information properly, while losing insignificant information, which is called the redundancy [2].
Image compression techniques are categorized into two main types depending on the redundancy removal way, namely lossless and lossy. Lossless types techniques are characterized by their simplicity and no loss of information allowed (the reconstructed identical to the original data), that utilized the statistical redundancy only with low compression rate, such as Huffman coding, Arithmetic coding, Run Length coding and Lempel-Ziv algorithm. While lossy types techniques are characterized by degrade image quality (the original data cannot be reconstructed exactly from the compressed data there is some degradation on image quality) that utilized the psycho-visual redundancy, either solely or combined with statistical redundancy with higher compression rate, such as Vector Quantization, Fractal, JPEG and Block Truncation coding [3].
In general, color images suffer from spectral redundancy (i.e., statistical redundancy) embedded between its bands, in addition to its main redundancy types, where neighbouring bands are not independent but highly correlated. Color images usually decomposed into Red (R), Green (G) and Blue (B) color bands. The only limitation of using this representation that it requires large amount of information, so low compression ratio achieved [4].
Various techniques adopted to overcome the color compression system complexity along with improving efficiency [5-10].
Today, the polynomial coding techniques adopted by researchers to compress image efficiently, based on modeling concept of Taylor series approximation base, for more details see [11-17]. Ghadah et al. (2016) [18], introduced a simple hybrid color compression technique of RGB color system base, that effectively mixed between the hard/soft thresholding techniques of block base and the spatial/frequency domains, where the polynomial coding and the wavelet transform exploited. The results showed the optimizing in the compression ratio along with preserving the image quality by mixing hard and soft thresholding.
In this paper, a traditional color polynomial coding technique of RGB base utilized with variable block sizes that varies according to correlation embedded between color image bands, along with exploits the mixed of symbol encoder techniques. The suggested color compression system discussed in section 2 and the results are given in section 3, followed by the conclusions in section 4.
II. THEPRPOSEDSYSTEM
In this suggested system the color image bands compress independently using the traditional linear polynomial coding of variable block sizes that changes according to the amount of correlation embedded between color image bands, also using different symbol encoder techniques in an attempt to mixed between them to increase the compression performance.
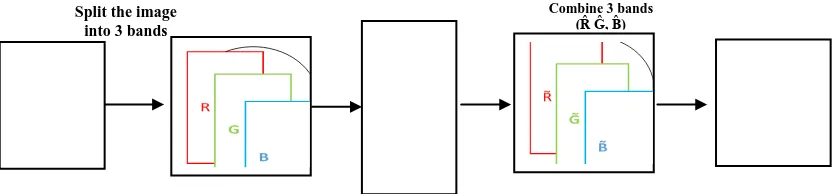
The implementation of the proposed system is explained in the following steps, the layout is illustrated in figure (1):
Step 1: Load the input uncompressed color image I of BMP format of size N×N.
Step 2 : Split the I into its bands (IR, IG, IB), each of
size N×N of high spectral redundancy, where IR,IG,IB
corresponding to R,G and B image bands respectively, then compute the cross correlation between color image bands according to equation below.
) 1 ...( ... ) (
) (
)] (
) [(
) , (
2 1
0 1
0
2 1
0
my ybandi mx
xbandi
my ybandi mx xbandi yband
xband R
n
i n
i n
i
yband respectively. Here the cross correlation computed between IR, IG, then IR, IB and IB, IG.
Step 3: Apply the polynomial coding techniques directly for each band, using different block sizes, where the technique involves the following sub steps:
1- Partition the image bands non-overlapped blocks, where for highly correlated band n×n adopted, while for less correlated 2n×2n and for small one 4n×4n.
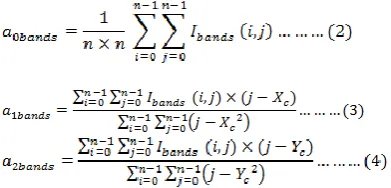
2- Compute the linear polynomial coefficients according to equations (2-4).
Where a0bands coefficient corresponds to the mean
(average) of block of sizes (n×n, 2n×2n, 4n×4n) of image bands Ibands where Ibands have three bands of
IR,IG,IB. The a1bands and a2bands coefficients represent
the ratio of sum pixel multiplied by the distance from the center to the squared distance in i and j coordinates respectively, and the (j-xc) and (i-yc)
corresponds to measure the distance of pixel coordinates to the block center (xc, yc) [11].
) 5 ...( ... ... 2 1
yc n
xc
3- Use the scalar uniform quantization/dequantization process for the estimated coefficients with different quantization step of each coefficient of each band.
) 8 ...( ) ( ) 7 ( ... ) ( ) 6 ...( ) ( 2 2 2 2 2 2 1 1 1 1 1 1 0 0 0 0 0 0 bands a bands bands bands a bands bands bands a bands bands band a bands bands bands a bands bands bands a bands bands QS Q a D a QS a round Q a QS Q a D a s QS a round Q a QS Q a D a QS a round Q a
Where a0bandsQ,a1bandsQ,a2bandsQ are the polynomial
quantized values,
bands a bands a bands
a QS QS
QS 0 , 1 , 2 are the
quantization steps of the polynomial coefficients, and
D a D a D
a0bands , bands1 , 2bands are polynomial dequantized
values.
dequantized values.
4- Create the predicted images Ĩbands using the
dequantized polynomial coefficients of each encoded block representation: ) 9 ...( ... )... ( ) ( ~ 2 1
0bands bands c bands c bands a D a D j x a D i y
I
5- Find the residuals as the difference between the original image bands and the predicted bands created
6- Quantize/dequantize the residual images uniformly with different quantization steps.
Step 4: Encode the compressed information of quantized coefficients and residuals, using different symbol encoder techniques and mixed between them. Step 5: Reconstruct the decoded compressed imageIˆ(i,j), by first rebuild each band separately by adding the residual dequantized image along with the predicted image, followed by adding the reconstructed bands to reconstruct the compressed or decoded image.
III. EXPERIMENTAL AND RESULTS
Three standard color images are selected for testing the proposed compression system (see figure 2 for an overview). Lena is characterized by a wide variety of image details, making it a complex highly detailed picture, while girl small or less variations in image detail, having large smooth areas with low detail. Medical lies somewhere between the two. All the images are a square of the same size, 256×256, and color of (24 bits/pixel). To evaluate the performance of the proposed compression system two objective measures utilized, the compression ratio used (CR) which is the ratio between the original image size and the compressed size (equation 13), and the peak signal to noise ratio (PSNR) (equation 14), where a large PSNR value implicitly means high image quality and close to the original image and vice versa.
( ,ˆ) 10 log10 ( ) ...( 14)
2 MSE yLevel MaximumGra I I PSNR
ˆ(, ) (, )
...(15) 1 ) ˆ , ( 2 1 0 1 0 N i N j j i I j i I N N I I MSETable 1 illustrates the cross correlation embedded between the color bands, identify the spectral redundancy related to Red/Green, Red/Blue, and Green/Blue bands, where in most cases the Green band adopted as a highly correlated band of block size n×n, either the Red and Blue corresponding to less correlated and small correlated of sizes 2n×2n and 4n×4n respectively
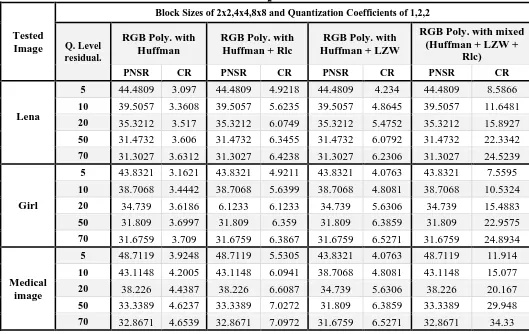
from 5-70, along with different symbol encoder techniques of Huffman coding , Huffman coding with Run Length coding , Huffman coding with LZW and with mixed between them all (Huffman coding with LZW and Run Length Coding).
There are a number of highlight issues need to be mentioned according to the above result:
1. Obviously, the quantization step of residual image affected both the compression ratio (CR) and the quality in terms of PSNR. 2. The tradeoff inverse relation between CR
and quality is clearly shown, where for low CR attains the high PNSR value, and vice versa.
3. The lower compression ratio achieved using the Huffman technique due the simplify of simple encoder, which by incorporating more technique higher compression attained especially by mixing the probability based along with dictionary based techniques. 4. Obviously, the compression ratio and PNSR
are directly affected by the image's
characteristics or details, where for highly detailed images less compression ratio and high PNSR archived compared to images with small and moderate details.
Fig 2: The test image a -'Lena ' b- Girl' ' c-Medical'
Table 1: The Cross Correlation of Tested Images Which Utilized as a Statistical Guide to the Image Correlation, or the Redundancy Present Within the Image Features or Contents.
Tested Images
Cross Correlation between Color image bands of spectral redundancy
IRIG IRIB IGIB
Lena 0.8895 0.7089 0.9222
Girl 0.7712 0.6819 0.9126
Medical Image 1.0000 1.0000 1.0000
Fig 1: The Proposed System Structure.
.
Uncompress ed Original color Image
I
Apply linear polynom
ial Coding of each band separatel
y
Decoded approximat
ely color image Ĩ Combine 3 bands
(R̂ Ĝ, B̂)
Table 2: The Color Polynomial Linear Compression Performance of Compression Ratio and PSNR for Tested Images.
Tested Image
Block Sizes of 2x2,4x4,8x8 and Quantization Coefficients of 1,2,2
Q. Level residual.
RGB Poly. with Huffman
RGB Poly. with Huffman + Rlc
RGB Poly. with Huffman + LZW
RGB Poly. with mixed (Huffman + LZW +
Rlc)
PNSR CR PNSR CR PNSR CR PNSR CR
Lena
5 44.4809 3.097 44.4809 4.9218 44.4809 4.234 44.4809 8.5866
10 39.5057 3.3608 39.5057 5.6235 39.5057 4.8645 39.5057 11.6481
20 35.3212 3.517 35.3212 6.0749 35.3212 5.4752 35.3212 15.8927
50 31.4732 3.606 31.4732 6.3455 31.4732 6.0792 31.4732 22.3342
70 31.3027 3.6312 31.3027 6.4238 31.3027 6.2306 31.3027 24.5239
Girl
5 43.8321 3.1621 43.8321 4.9211 43.8321 4.0763 43.8321 7.5595
10 38.7068 3.4442 38.7068 5.6399 38.7068 4.8081 38.7068 10.5324
20 34.739 3.6186 6.1233 6.1233 34.739 5.6306 34.739 15.4883
50 31.809 3.6997 31.809 6.359 31.809 6.3859 31.809 22.9575
70 31.6759 3.709 31.6759 6.3867 31.6759 6.5271 31.6759 24.8934
Medical image
5 48.7119 3.9248 48.7119 5.5305 43.8321 4.0763 48.7119 11.914
10 43.1148 4.2005 43.1148 6.0941 38.7068 4.8081 43.1148 15.077
20 38.226 4.4387 38.226 6.6087 34.739 5.6306 38.226 20.167
50 33.3389 4.6237 33.3389 7.0272 31.809 6.3859 33.3389 29.948
70 32.8671 4.6539 32.8671 7.0972 31.6759 6.5271 32.8671 34.33
III.CONCLUSIONS
The test results clearly showed the efficiency of the of the proposed system where correlation measure adopted to determine the block size of the polynomial coding of RGB color system, also showed the superiority of the mixed symbol encoder techniques
ACKNOWLEDGMENT
The heading of the Acknowledgment section and the References section must not be numbered. Causal Productions wishes to acknowledge Michael Shell and other contributors for developing and maintaining the IJETT LaTeX style files which have been used in the preparation of this template. To see the list of contributors, please refer to the top of file IJETT Tran.cls in the IJETT LaTeX distribution.
REFERENCES
[1] Mohammed, M. and Ghadah, Al-K. 2013. Applied Minimized Matrix Size Algorithm on the Transformed Images by DCT and DWT used for Image Compression. International Journal of Computer Applications, 70(15), 33-40.
[2] Al-Khafaji, G. 2012. Intra and Inter Frame Compression
[3] Ghadah, Al-K., Noor S. M., and Uhood Al-H. 2017. Hybrid Mixed Color Image Compression. International Journal of Engineering Research and Management, 4(6), 62-69.
[4] Ghadah, Al-K. and Noor, S. M. 2016. Image Compression based on Adaptive Polynomial Coding of Hard & Soft Thresholding. Iraqi Journal of Science, 57(2B), 1302-1307. [5] Ghadah, Al-K., Noor S. M., and Uhood Al-H. 2016. Hybrid Color Image Compression of Hard & Soft Mixed Thresholding Techniques. International Journal of Computer Science and Mobile Computing, 5(7), 375-381. [6] Haidar, R. S., Loay. E. G., and Ghadah, K.T. 2015. Partial
Encryption for Colored Images Based on Face Detection. International Journal of Advanced Research in Computer Science and Software Engineering, 5(8), 25-35.
[7] Anitha, S. 2011. 2D Image Compression Technique-A Survey. International Journal of Scientific & Engineering Research, 2(7), 1-6.
[8] Bahi, L. R. and Kobayashi, H. 1974. Image Data Compression by Predictive Coding II: Encoding Algorithms. IBM Journal of Research and Development, 19, 172-179.
[9] Balram, N. and Moura, J. M. F. 1996. Noncausal Predictive Image Codec. IEEE Transactions on Image Processing, 5(8), 1229-1242.
[10] Barnsley, M. F. and Sloan, A. D. 1988. A Better Way to Compress Images, BYTE Magazine, 13(1), 215-223. [11] Rasha, Al T. 2015. Intra Frame Compression Using
Adaptive Polynomial Coding .MSc. thesis, Baghdad University, Collage of Science.
[13] Ghadah, Al-K. 2013. Image Compression based on Quadtree and Polynomial. International Journal of Computer Applications (IJCAs), 76(3),31-37.
[14] Ghadah, Al-K. 2013. Hybrid Image Compression based on Polynomial and Block Truncation Coding. Electrical, Communication, Computer, Power, and Control Engineering (ICECCPCE), 2013, International Conference on Mosul, IEEE.
[15] Ghadah, Al-K., and Maha, A. 2016. Lossless and Lossy Polynomial Image Compression. IOSR Journal of Computer Engineering (ISO JCE),18(4), 56-62.
[16] Ghadah, Al-K and Hazeem, Al-K, 2014. Medical Image Compression using Wavelet Quadrants of Polynomial Prediction Coding & Bit Plane Slicing. International
Journal of Advanced Research in Computer Science and Software Engineering, 4(6), 32-36.
[17] Ghadah, Al-K. and Rafaa, Y. 2017. Lossy Image Compression Using Wavelet Transform, Polynomial Prediction and Block Truncation Coding. IOSR Journal of Computer Engineering (IOSR-JCE), 19(4),34-38. [18] Al-Khafaji, G., Mahdi, N., and Al-Hassani, U. 2016.
Hybrid Color Image Compression of Hard & Soft Mixed Thresholding Techniques. International Journal of Computer Science and Mobile Computing, 5(7), 375-381. [19] Shi, Y. Q. and Sun, H. 2000. Image and Video