Taguchi Optimization of MIG Welding Parameters Affecting
Tensile Strength of C20 Welds
Diganta Kalita
1#*, Parimal Bakul Barua
2#1M.E. Student, 2Professor and H.O.D.
#Department of Mechanical Engineering, Jorhat Engineering College, Jorhat, Assam, India
Abstract
—
The objective of this research work is to investigate the effect of the three process parameters of Metal Inert Gas Welding (MIG), welding current, voltage and shielding gas flow rate on tensile strength of welded joints having Grade C20 Carbon Steel as parent metal and ER70S-4 electrode. An experiment has been designed using Taguchi’s Orthogonal Array L9, taking welding current, voltage and shielding gas flow rate as factors having three levels each. The selected levels for welding current are 170 A, 200 A, 230 A and for voltage are 20 V, 25 V, 30 V and for shielding gas flow rate (CO2) are 8 lit/min, 12 lit/min, 16lit/min. The experiments were conducted using TORNADO MIG 400 welding machine with three repetitions. ANOVA analysis of the experimental results shows welding current and welding voltage have significant effect whereas gas flow rate has insignificant effect on tensile strength of the weld. The optimal set of process parameters for optimal tensile strength (475.87 N/mm2) found to be are: 200 A welding current, 30 V welding voltage and 8 lit/min gas flow rate. The effect of shielding gas flow rate being found insignificant, kept at the most economic level (8 lit/min).
Keywords— MIG Welding, Taguchi Technique, Tensile Strength.
I. INTRODUCTION
Metal Inert Gas (MIG) welding is well known and most widely used arc welding process in today‘s world. It is used to weld verity of materials, ferrous and non ferrous. The weld quality of MIG welding largely depends on the various process parameters, viz. current, voltage, shielding gas flow rate, welding speed, wire feed rate, electrode angle, wire diameter, arc length etc. In the present investigation effect of three important parameters, welding current, voltage and shielding gas flow rate; are studied and optimized for tensile strength of the weld. MIG arc welding is performed on low carbon steel C20 under CO2 gas shielding. Carbon Steel Grade C20 is an unalloyed low carbon mild steel having low strength with good machinability and is suitable for welding. During the welding Electrode wire ER70S-4 is used. It is a kind of mild steel copper coated welding wire, suitable with CO2 gas shielding. An experiment has been designed using Taguchi L9 Orthogonal Array (OA) for the current study. For the selection of the input process parameters and their levels, various published literature were studied and the already stated three parameters with three levels each were chosen.
II. LITERATUREREVIEW
Chavda, S. P., et al (2014) [1] investigated the effect of welding parameters : current, welding voltage, Gas flow rate and wire feed rate on weld strength, weld pool geometry of medium Carbon Steel material during welding by Taguchi method. Kumar, D., et al. (2014) [2] studied optimization of the process parameters in GMAW by Taguchi‘s experimental design method. L9 Orthogonal Array was selected to optimize input welding parameters: voltage, current and gas flow rate affecting tensile strength on 1018 Mild Steel. The optimal settings are: current of 220 A, voltage of 40V and gas flow rate of 17 lit/min. Verma, S., et al. (2014) [3] performed experiments for obtaining better bead height and bead width separately. The optimal parameters combination of bead height for CRC steel 513 GR-D was welding voltage 26 volts, welding current 170 amps and the wire extension 10 mm, and for bead width was welding voltage 22 volts, current 190 amps and the wire extension 10 mm. Kadani, M., et al. (2014) [4] used Taguchi‘s orthogonal array design to develop a simple bead geometry based criterion for selection of MIG welding process parameters to obtain the desired responses. Wire feed rate (3-6m/min), arc voltage (14-18volt), welding speed (1.5-1.9mm/min), gas flow rate (8-16lit/min) and 6 to 8mm plate thickness are selected as the input process parameters. Patel, C., et al. (2013) [5] studied the following process parameters: welding current, wire diameter and wire feed rate to investigate their influence for MIG welding and TIG welding. By use of GRA optimisation technique, the optimal parameter values for better hardness for MIG are 100amp current, 1.2 mm wire diameter and 3 m/min wire feed rate. Similarly the values obtained for TIG are 80 amp current and 0.8mm wire diameter on Carbon Steel (plain). Vishwakarma, B., et al. (2013) [6] studied the effect of electrode diameter, welding current, voltage and welding techniques on mechanical properties of mild steel and process parameters classification into two groups (primary and secondary). It was observed in microstructure examination that with increasing current and voltage the grains tends to be coarser, while with increasing electrode diameter it tends to be finer. The experiments were performed between current range100A to 200A and voltage in between 10 V to 30
V. Boob, A. N., et al. (2013) [7] performed
input process parameters : welding current (150-200amp), welding voltage (30 volt) and welding speed (156-276mm/min) and concluded that increase in welding speed decreases the width of heat affected zone. Singh, V., (2013) [8] applied taguchi optimization method to find the optimal process parameters for Tensile Strength. The optimised values thus found for better tensile strength are 40 CFH gas flow rate, 35V voltage and 1.5mm welding position gap. Patil, U. S., et al. (2013) [9] applied Artificial Neural Fuzzy Interface system to optimize the process parameters for MMA welding of stainless steel and mild steel. Optimum metal deposition is found out for greater weld strength. Sapakal, S. V., et al. (2012)[10] presented optimization of influence parameters current, voltage and welding speed on penetration depth of MS material with the help of Taguchi‘s design.. The penetration obtained is 5.25mm with optimal welding parameters. Satish, R. et al. (2012)[11] investigated variation in heat input resulted in significant changes in the mechanical properties of the weld. Lower heat input resulted in lower tensile strength and too high heat input also resulted in reduced tensile strength. Gas flow (12.5 lpm) rate is the factor that significantly contributed to a higher percentage and has greater influence on the tensile strength followed by contributions from current (110 amp to 115 amp) and bevel angle (450). Kumar, L. S. et al. (2011) [12] compared weld quality of MIG and TIG welded austenitic stainless steel. It is concluded that TIG welded specimens have higher ultimate tensile strength whereas MIG welded specimens are more ductile.
III.OBJECTIVEOFPRESENTWORK
The objective of the present work is to investigate the effect of three important input parameters of MIG welding: current, voltage and CO2 gas flow rate on the Tensile Strength of welded joints having C20 grade low carbon mild steel as parent metal. Also the second objective of this work is to optimize the aforesaid input parameters for Maximum Tensile Strength of the weld.
IV.METHODOLOGY
To fulfil the above objectives, an experiment has been designed using Taguchi‘s experimental design technique. From various literature survey the following three factors with three levels each, are selected as shown in TABLE I.
TABLE I
INPUT FACTORS AND THEIR LEVELS
Input
Factor Unit Level 1 Level 2 Level 3
Factor A
(Current) amp 170 (A1) 200 (A2) 230 (A3)
Factor B
(Voltage) V 20 (B1) 25 (B2) 30 (B3)
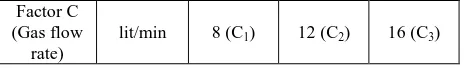
Factor C (Gas flow
rate)
lit/min 8 (C1) 12 (C2) 16 (C3)
These factors are independent of each other and can be controlled separately.
A. Selection of Orthogonal Array
For the present investigation, the selection procedure of Orthogonal Array (OA) is given below:
Input factors of the experiment:
a) Current (three levels: 150 A, 200 A, 250 A) b) Voltage (three levels: 20 V, 25 V, 30 V)
c) Gas flow rate (three levels: 8 lit/min, 12 lit/min, 16 lit/min)
DOF of Factor A (current), fA = level – 1 = 3 – 1 = 2 DOF of Factor B (voltage), fB = level – 1 = 3 – 1 = 2 DOF of Factor C (gas flow rate), fC = level – 1 = 3 – 1 = 2 DOF of the experiment, fexp= fA + fB + fC = 2 + 2 + 2 = 6
The smallest three level Taguchi OA is L9, which has four columns.
DOF of L9 OA,
fL9 = Number of columns x (Level – 1) = 4 x (3 – 1) = 8 As DOF of the experiment is less than DOF of L9 OA, hence L9 OA is selected.
B. Column Assignment of the Factors
The factors are assigned to columns of L9 OA consulting the triangular table of three level OA. The column assignment is shown in TABLE II.
TABLE II
COLUMN ASSIGNMENT OF THE FACTORS
No of
Trials
Factors (Columns)
Current (A) Voltage (V) Gas flow rate
(lit/min) Unused
1 170 20 8 1
2 170 25 12 2
3 170 30 16 3
4 200 20 12 3
5 200 25 16 1
6 200 30 8 2
7 230 20 16 2
8 230 25 8 3
C. Response Variable
The response variable chosen here is Tensile strength of MIG welding on low carbon steel C20 (ISI). Here it has been assumed that higher the tensile strength of the welded parts better is the performance. All the trials have been performed using the same machine to cancel out the effect of machine variables. The summery of the experiment is given TABLE II.
D. Materials
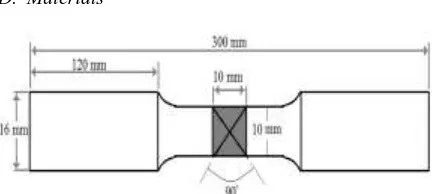
Fig. 1: Dimension of test specimen.
The materials used for welding is low carbon steel C20 round bars of diameter 16 mm. with chemical composition as presented in TABLE III, and ER70S-4 consumable electrodes. Round bars of diameter 16 mm by 300 mm length were sectioned from the bar as shown in Fig 1. Twenty seven pieces of samples were prepared for experimentation. Each of these samples was turned with V grove and welded together using Metal Inert Gas Arc Welding (MIG). The ER70S-4 electrodes were used with DC arc welding process by varying welding current with a terminal voltage and gas flow as listed in TABLE I. The chemical composition of electrode wire ER70S-4 is given in TABLE III.
TABLE III
CHEMICAL COMPOSITION OF WELDING WIRE ER70S-4 [13]
C Mn Si P S Cu
0.07~
0.15
%
1.00~
1.50
%
0.65~
0.85
%
≤0.025
%
≤0.035
% ≤0.50
%
E. Test specimen material
All the test specimens are made of Carbon Steel Grade C20, which is an unalloyed low carbon mild steel grade supplied as a hot rolled or bright drawn finish bar. Carbon Steel Grade C20 is an unalloyed low carbon mild steel having low strength with good machinability and is suitable for welding. It is used as more general purpose steel for multiple applications. Common Uses are lightly stressed bolts, fixings, shafts, spacers, hubs and bushings, bracketry, linkages and base plates etc. The mechanical properties and chemical composition are listed in TABLE IV and TABLE V respectively.
TABLE IV
MECHANICAL PROPERTIES OF C20 STEEL [14]
Mechanical Properties Range
Tensile strength 432-510 MPa
Elastic modulus 190-210 GPa
Bulk modulus 140 GPa
Shear modulus 80 GPa
Poisson's ratio 0.27-0.30
Elongation at break 0.15%
Hardness, Brinell 156
Hardness, Rockwell B 85
Hardness, Vickers 160
Machinability 65
TABLE V
CHEMICAL COMPOSITION OF C20 STEEL [14]
F. Experimental Setup
All the trials were conducted on the same machine (TORNADO MIG 400) to cancel out the effect of machine variables.
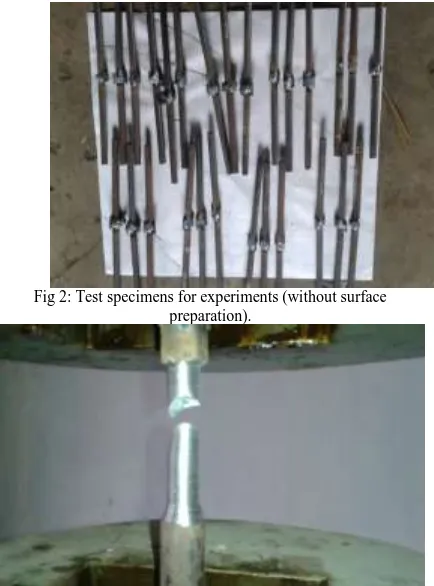
The twenty seven test pieces of C20 grade MS rod were first turned to make a V-groove with minimum diameter in which the welded material was to be filled up. After welding, the samples were turned again to remove the excess material and were subjected to tensile test on UTM (Universal Testing Machine), Model KUT-40 (E) Capacity 400KN, Ratnakar Enterprises, Maharashtra. The test specimens for experiments and failure after tensile test are shown in Fig 2 and Fig 3 respectively.
Elements Minimum (%) Maximum (%)
Carbon, C 0.15 0.25
Manganese, Mn 0.6 0.9
Silicon, Si 0.05 0.35
Sulphur, S --- 0.06
Fig 2: Test specimens for experiments (without surface preparation).
Fig 3: Test specimen after Tensile test.
G. Experimental Data Analysis
The experimental results were analysed with the following methods:
i. Main Effect plot ii. Raw data ANOVA iii. S/N data ANOVA
The Main Effect plots were drawn to select optimum level setting of a significant factor. Raw data ANOVA and S/N data ANOVA are carried out to find, wheatear a factor affect mean or variance or both mean and variance of the response variable. The factors which are found to affect neither mean nor variance should be adjusted to its most economical level, whereas those factors which have significant effect at least on mean or variance of the response variable should be adjusted to their optimal level from the main effect plot.
V. RESULTS&DISCUSSION
The experimental data are shown in TABLE V.
TABLE V
TENSILE STRENGTH OF THE TEST SAMPLES AT VARIOUS FACTOR SETTING
Where R1, R2, R3 are repetitions against each of the trail conditions.
Main effect plot of Factor A (Current), Factor B (Voltage) and Factor C (Gas flow rate) are shown in Fig 4, Fig 5 and Fig 6 respectively.
Trial No.
Input Factor Tensile Strength (Response Variable),
N/mm2 AVG
( N/mm2)
S/N (dB)
Current
(Amp) Voltage (V)
Gas flow
(Lit/min) R1 R2 R3
1 170 20 8 211.57 170.89 190.97 191.14 45.528
2 170 25 12 365.03 388.52 376.03 376.53 51.507
3 170 30 16 434.04 432.40 431.22 432.55 52.721
4 200 20 12 277.34 267.94 270.35 271.88 48.685
5 200 25 16 415.72 389.94 401.55 402.40 52.084
6 200 30 8 470.54 476.40 474.37 473.77 53.511
7 230 20 16 201.56 180.96 189.81 190.78 45.585
8 230 25 8 328.48 337.03 324.77 330.09 50.370
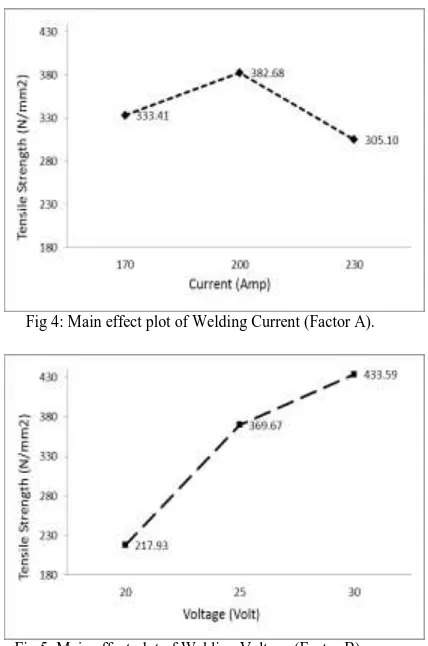
Fig 4: Main effect plot of Welding Current (Factor A).
Fig 5: Main effect plot of Welding Voltage (Factor B).
From Fig. 4 it can be seen that tensile strength of the weld increases, when welding current increases from 170 amp to 200 amp, but it drops suddenly when the current is further increased to 230 amp. This observation is also reported by Kumar, D., et al. (2014) [2]. Thus optimum setting for current is 200 amp (A2).
Fig 6: Main effect plot of Gas Flow rate (Factor C).
From Fig. 5 it is observed that the Tensile strength increases when the voltage is increased from 20V to 30V. It is because of the increase in granule size, the tensile strength increases. This is also supported by the studies of Kumar, D., et al. (2014) [2]. From Fig. 5, the optimum setting of Factor B (Welding voltage) can be found at 30 V (B3).
From the above main effect plot (Fig. 6) it is observed that the tensile strength increases when the gas flow rate is increased from 8lit/min to 12lit/min but any more increase in the gas rate causes the tensile strength to decrease again. It is due to change in grain size of microstructure as studied by Chavda, S. P., et al (2014) [1]. This is also supported by the studies of Kumar, D., et al. (2014) [2]. However the effect of shielding gas flow rate (Factor C) is found to be minimal on Tensile strength of the weld. At 12 lit/min (C2) gas flow rate, tensile strength is found to be maximum.
TABLE VI and TABLE VII shows Raw data ANOVA and S/N data ANOVA result respectively.
TABLE VI RAW DATA ANOVA
Source f SS MS F SS' P F(0.05)
Critical Comment
Current (Factor A) 2 27745.047 13872.523 76.843 27383.985 10.807 3.493 Significant
Voltage (Factor B) 2 220850.503 110425.251 611.670 220489.441 87.019 3.493 Significant
Gas flow (Factor C) 2 1174.893 587.447 3.254 813.832 0.321 3.493 Insignificant
Error 20 3610.618 180.531 1 4693.803 1.852
Total 26 253381.061 125065.752 100
Where,
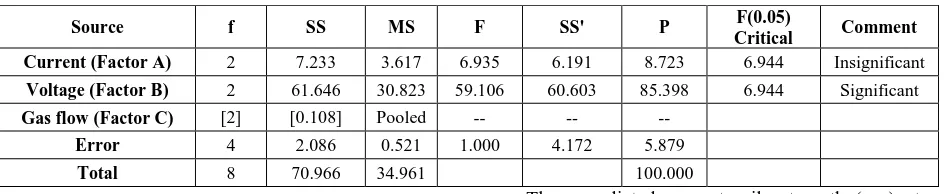
TABLE VII
S/N DATA ANOVA (POOLED)
Source f SS MS F SS' P F(0.05)
Critical Comment
Current (Factor A) 2 7.233 3.617 6.935 6.191 8.723 6.944 Insignificant
Voltage (Factor B) 2 61.646 30.823 59.106 60.603 85.398 6.944 Significant
Gas flow (Factor C) [2] [0.108] Pooled -- -- --
Error 4 2.086 0.521 1.000 4.172 5.879
Total 8 70.966 34.961 100.000
From Raw data ANOVA (TABLE VI) and S/N data ANOVA (TABLE VII) result it can be seen that welding voltage has significant effect, both on mean and variation of the Tensile strength of the weld having 87.019% and 85.398% contribution respectively, whereas welding current has significant effect on mean only (10.807% contribution). The effect of shielding gas (CO2) flow rate is insignificant both on mean and variation of the Tensile strength of the weld.
A. Prediction of Tensile Strength at Optimum From main effect plots, the optimum level of the factors:
Factor A (Current): 200 amp (A2) Factor B (Voltage): 30 V (B3)
Factor C (Gas Flow rate): 12 Lit/min (C2)
Since, from ANOVA analysis it is seen that Factor C does not have significant effect both on mean and variation of the response variable; its first level (C1) is chosen instead of its second level (C2) as the optimum level, C1 being the most economical setting. Thus for Factor C the optimum level is 8 lit/min (C1).
At optimal input factor setting A2B3C1 the mean Tensile Strength (µTS) of the weld is predicted by the following equation [15]:
µTS = µ + (A2avg - µ) + (B3avg- µ)
Where,
µ= Mean of all data points.
A2avg= Average of all data points having A2 level.
B3avg= Average of all data points having B3 level.
The effect of Factor C is omitted from the above equation as Factor C is an insignificant factor.
From TABLE V, µ= 340.4 N/mm2 A2avg= 382.68 N/mm
2
B3avg= 433.59 N/mm2
Thus, predicted mean tensile strength (µTS) at A2B3C1 setting = 475.87 N/mm2
B. Confirmation Experiment
To ascertain the results thus obtained a confirmation experiment is conducted with the optimum setting (A2B3C1 ) found from earlier experimentations. The results of confirmation experiment is shown in TABLE VIII.
TABLE VIII
RESULTS OF CONFIRMATION EXPERIMENT
Repetition No.
Input Setting Tensile
Strength
N/mm2
Current (Amp)
Voltage (V)
Gas flow (Lit/min)
R1 200 30 8 473.56
R2 200 30 8 475.12
VI.CONCLUSION
In the present work the effect of three important parameters of MIG welding; welding voltage, current and shielding gas flow rate on the tensile strength of C20 steel has been studied. An experiment has been designed using Taguchi‘s L9 Orthogonal Array with three repetitions. All welding work has been carried out using ER70S-4 electrodes.
Result shows that welding voltage has significant effect, both on mean and variation of the Tensile strength of the weld having 87.019% and 85.398% contribution respectively, whereas welding current has significant effect on mean only (10.807% contribution). Shielding gas flow rate has insignificant effect on the tensile strength of the weld.
From analysis of experimental data the optimal setting is found to be:
Welding current: 200 amp. Welding voltage: 30 V.
Shielding gas flow rate (CO2): 8 Lit/min.
The predicted mean tensile strength of the weld, at the above optimal setting is found to be 475.87 N/mm2.
REFERENCES
[1] Satyaduttsinh P. Chavda, Jayesh V.Desai and Tushar M.Patel, ―A Review on Optimization of MIG Welding Parameters using Taguchi‘s DOE Method‖, International Journal of Engineering and Management Research, vol.4(1), pp. 16-21, February 2014.
[2] Deepak Kumar and Sandeep Jindal, ―Optimization of Process Parameters of Gas Metal ARC Welding by Taguchi‘s Experimental Design Method‖, International Journal of Surface Engineering & Materials Technology, vol. 4 (1), pp. 24-27, January-June 2014.
[3] Sudesh Verma and Rajdeep Singh, ―Optimization of Process Parameters of Metal Inert Gas Welding By Taguchi Method On CRC Steel IS 513 GR ‗D‘‘,
International Journal of Advance Research In Science And Engineering IJARSE, vol. 3 (9), pp. 187-197, September 2014.
[4] Mallikarjun Kadani and DR. G. K. Purohit, ―Developing A Bead Geometry Based Criterion For Selection Of Process Parameters Of Metal Inert Gas Welding Using Taguchi Techniques‖, Journal of Information , Knowledge and Research in Mechanical Engineering, Vol.3 (1), pp. 589-597, November 2013- October 2014. [5] Chandresh. N. Patel and Sandip Chaudhary, ―Parametric
Optimization of Weld Strength of Metal Inert Gas Welding and Tungsten Inert Gas Welding By Using Analysis of Variance and Grey Relational Analysis‖,
International Journal of Research in Modern Engineering and Emerging Technology, Vol.1 (3), pp. 48-56, April 2013.
[6] B. Vishwakarma, M. Verma, and T. K. Mishra, ―Investigation of Welding Parameters on Mechanical Properties of Different Welding Joints of Mild Steel‖,
International Journal on Mechanical Engineering and Robotics (IJMER), Vol.1 (1), pp. 23-27, 2013.
[7] Ajay N. Boob and G. K.Gattani, ―Study on Effect of Manual Metal Arc Welding Process Parameters on Width of Heat Affected Zone (Haz) For MS 1005 Steel‖,
International Journal of Modern Engineering Research (IJMER), Vol. 3 (3), pp. 1493-1500 May-June 2013. [8] Vikram Singh, ―An Investigation for Gas Metal Arc
Welding optimum Parameters of Mild Steel AISI 1016 using Taguchi Method‖, International Journal of Engineering and Advanced Technology (IJEAT),Vol. 2 (6), pp. 407-409, August 2013.
[9] U. S. Patil and M. S. Kadam, ―Effect of Welding Process Parameters in MMAW for Joining Of Dissimilar Metals and Parameter Optimization Using Artificial Neural Fuzzy Interface System‖, International Journal of Mechanical Engineering and Technology, vol. 4 (2), pp.79-85, April 2013.
[10] S. V. Sapakal and M. T. Telsang, ―Parametric Optimization Of MIG Welding Using Taguchi Design Method‖, International Journal of Advanced Engineering Research and Studies, Vol.1 (4), pp. 28–30, July- September 2012.
[11] R. Satish, B. Naveen and V. S. Rao, ―Process Parameter Optimization of Dissimilar Pipe Joints Using GTAW‖,
International Journal of Engineering Research and Applications (IJERA), Vol. 2 (3), pp. 2525-2530, 2012. [12] L. Suresh Kumar, S. M. Verma, P. Radhakrishna Prasad,
P. Kiran kumar and T. Siva Shanker, ―Experimental Investigation for Welding Aspects of AISI 304 & 316 by Taguchi Technique for the Process of TIG & MIG Welding‖, International Journal of Engineering Trends and Technology, vol. 2 (2), pp. 28-33, 2011.
[13] Yunhe Welding Materials Co. LTD. Website [online], Available:
http://en.czyunhe.cn/products_detail/&productId=87572d bd-4cd8-4f5d-a813-e9a8c0906d11.html.
[14] K. Mahadevan and K. Balaveera Reddy, Design Data Hand Book, 3rdEdition, CBS Publishers and Distributors,
Delhi, 1987, pp. 418
[15] P. J. Ross , Taguchi Techniques for Quality Engineering, 1st edition, McGraw-Hill Book Company, New York ,