Deterministic Mathematical Model Of Cholera,
Predicting Chances Of Its Outbreak
Sani A. Fakai, M. O. Ibrahim, A. Danbaba
ABSTRACT: - Outbreaks of cholera occur suddenly, if not controlled, can spread like wild bush fire. In this work, a determistic mathematical model of cholera was developed from some modifications of previous cholera models. A system of three differential equations was used. Analysis was performed on the Jacobian matrix assuming zero Vibrio Cholerae environments. The basic reproduction number Ro was obtained as
𝛆𝛂𝐩
𝐤(𝛄+𝛕)(𝐠−𝐥+𝛚) and the critical
number or threshold Sc was also obtained as
𝐤(𝛄+𝛕)(𝐠−𝐥+𝛚)
𝛆𝛂 . These two values are used to predict occurrence of cholera outbreak in a community. Zero
equilibrium state is stable when Ro < 1 and unstable when Ro > 1, these conditions are explained in respect to the model’s parameters.
Key words: - Vibrio Cholerae, therapeutic, threshold, toxigenic, hygienic, basic reproduction number, contaminated.
————————————————————
INTRODUCTION
Cholera is said to be the epidemic that urge health education in the early nineteenth century, due to its contagious nature which if allow deteriorating, it has no respect to class of people, and it is still maintaining this threatening gesture. Mathematical modelling being the mainstay of epidemiological theory, is crucial to apply in studying cholera dynamics because ability to model disease dynamics can be used to forecast the danger of a major epidemic. Hartley et al (2006) stated that ―Cholera is an ancient disease that continues to cause epidemic and pandemic disease despite on-going effort to limit its spread. Mathematical models provide one means of assessing the utility of various proposed interventions‖. Since a good understanding of the transmission, dynamics and ecology of cholera in emergent regions can help to improve the control of future epidemics, mathematical models provide a quantitative and potentially valuable tool for this purpose. In its extreme manifestation, cholera is one of the most rapidly fatal illnesses known. A healthy person may become hypertensive within an hour of the onset of symptoms and may die within 2 – 3 hours if no treatment is provided. Categorically if infected, the disease progress from the first liquid stool to shock in 4 – 12 hours with death following in 18hours to several days. Cholera cases were categorised by Akor (2007) as ―10% of cholera cases present with copious painless, watery diarrhoea (rice-water diarrhoea or stool) and are associated with high mortality rate. The remaining 90% have either mild diarrhoea no symptoms at all. Vomiting may occur in 80% of cases and abdominal pain and muscle cramps, shock, and renal failure are features of severest infection‖.
Typical cholera begins over quite a short period of time with stomach pains without feeling sick. There may also be a mild fever, diarrhoea and vomiting begins and may continue for several hours. This is followed by copious, watery diarrhoea that is pale and flaky and looks like rice-water. The fluid loss may be as high as one litre per hour. Rapid loss of enormous quantity of fluid and electrolytes lead to intensive dehydration with muscular cramps. The skin becomes cold dummy and rankled and the eyes become sunken. The urine output reduces drastically and the patient becomes mentally alert. Blood pressure falls and the pulse sound can be heard. If the fluids and electrolytes are not replaced immediately the patient can die instantly due to acute circulatory failure. About one hundred million Vibrio Cholerae bacteria must be typically ingested to cause cholera disease in a normal healthy adult. It may not reach that amount in people with lower gastric acidity. According to Isere and Osemwenkhae (2010) ―Experiment suggests that a dose of 106 cells/ml is expected to cause cholera outbreak‖. Yoon and Mekalano (2006) ―It is tempting to speculate in ORS may have contributed to an vivo selection of El Tor strains, at least in those patients that were not simultaneously treated with antibiotics‖. ―Because the infectious dose of V. Cholerae is known to be quite high for humans with normally acidic contents, transmission via contaminated food may be more important than transmission through contaminated water alone. The objective of this research study is to marry the ideas and pattern adopted by Codeco (2001), Wang and Liao (2010), Mukandavire et al (2010) and Hartley et al (2006). To produce a harmonized model with four differential equations that change to three differential equations by dropping recovered population’s equation 𝒅𝑹
𝒅𝒕, which is assumed to
have merged with the susceptible equation 𝒅𝑺
𝒅𝒕 . Two vital
parameters were incorporated to predict the dynamics of cholera outbreak are: 1.The rate of therapeutic treatment of cholera disease denoted by τ. and 2. The rate of reduction of Vibrios Cholerae bacteria as a result of sanitation and hygienic measures taken by people is denoted by ω. If no immunity, recovered people easily become susceptible after infection. Recovery equation has less effect in the model; hence recovery equation is dropped as in Tian, et al (2010). Analysis will be conducted on equations 4, 5 and 6.
____________________________
Sani A. Fakai, M. O. Ibrahim and A. Danbaba
THE MODEL’S EQUATIONS
The dynamics of the disease is given by a system of differential equations below:
𝒅𝑺
𝒅𝒕= 𝒏𝒑 − 𝜶𝒉 𝑩 𝑺 − 𝒏𝑺 1
𝒅𝑰
𝒅𝒕= 𝜶𝒉 𝑩 𝑺 − (𝜸 + 𝝉)𝑰 2
𝒅𝑩
𝒅𝒕 = 𝜺𝑰 − (𝒈 − 𝒍 + 𝝎)𝑩 3
S is the susceptible and it comprises all the individuals in the community. The individuals are either born in the community or they immigrated into it at the rate np, susceptible S become infected with cholera at the rate α, infected I contribute to the population of Vibrio Cholerae at a rate ε, infected people either die from cholera disease or recover at a rate γ. Recovered people become susceptible again, since it is assumed that no immunity after infection. Chance of catching cholera as a result of contact with contaminated food or water is h(B). Equation 1 describe the dynamics of susceptible in the community with size p. Susceptible individuals are recruited at the rate np, they became infected at the rate αh(B), where α is the rate of consuming contaminated food or water. h(B)= 𝑩
𝒌+𝑩 where B
is the concentration of toxigenic Vibrio Cholerae bacteria in food and water and k is the concentration of Vibrio Cholerae in food and water that yields 50% chance of catching cholera disease. Equation 2 describes the dynamics of infected people in the community. Infected people increase as susceptible become infected and their number decreases as the infected recover or die as a result of cholera disease. Also measures to curtail the spread of the disease, such as hygiene and total sanitation indirectly affect infections. Equation 3 describes the dynamics of pathogenic Vibrio Cholerae in the environment, comprising the contaminated food or water consumed by people. The total population at time t, denoted by p(t) is given by
p(t) = S(t) + I(t) + R(t).
Substituting 𝑩
𝒌+𝑩 for h(B), We have: 𝒅𝑺
𝒅𝒕= 𝒏𝒑 − 𝜶𝑩𝑺
𝒌+𝑩− 𝒏𝑺 4
𝒅𝑰 𝒅𝒕=
𝜶𝑩𝑺
𝒌+𝑩− (𝜸 + 𝝉)𝑰 5
𝒅𝑩
𝒅𝒕 = 𝜺𝑰 − (𝒈 − 𝒍 + 𝝎)𝑩 6
As in Isere and Osemwenkhae (2010), with S = p, I = B = 0, equation 4 becomes linear differential equation:
𝒅𝑺 𝒅𝒕= 𝒏𝒑 −
𝜶𝑩𝑺 𝒌+𝑩− 𝒏𝑺
⟹ 𝒅𝑺
𝒅𝒕= 𝒏𝒑 − 𝒏𝑺
𝒅𝑺
𝒅𝒕+ 𝒏𝑺 = 𝒏𝒑
∫ 𝒆𝒏𝒕=∫ 𝒏𝒑𝒆𝒏𝒕𝒅𝒕 + 𝒄
= ∫ 𝒑𝒆𝒏𝒕+ 𝒄
𝑰𝒇 𝒄 = (𝑺 − 𝒑)𝒆−𝒏𝒕
𝑆(𝑡) = 𝒑 + (𝑺 − 𝒑)𝒆−𝒏𝒕
Where Si is the initial number of susceptible individuals
As t→∞, Si = 𝑝 then S →𝑝
this is the asymptotic population size. It proves the attainment or achievement of disease free equilibrium. As in Bayleyegn (2009), in analysing the model, the Jacobian matrix will now be:
JE =
−𝐧 −𝐤+𝐁𝛂𝐁 𝟎 𝐤+𝐁𝛂𝐒 − 𝛂𝐁𝐒 k+B 𝟐
𝛂𝐁 𝐤+𝐁
𝟎
− (γ − τ) − 𝛂𝐒 𝐤+𝐁+
𝛂𝐁𝐒 k +B 𝟐
𝛆 −(ɡ − Ɩ + ω)
…….7
JE is the Jacobian of equilibrium variables.
STABILITY ANALYSIS
Now if a small number of infective is introduced into the community, will there be disease Free State? From Akor (2007) only 10% cholera cases comes with diarrhoea and vomiting, but all infected people can contribute to the increase and spread of Vibrio Cholerae in the environment. When there are no Vibrio Cholerae bacteria in community, B = 0, nobody is infected with cholera, I = 0 and the population remains S = p. Analysing system of the model using these values, we start by obtaining the determinant of JE at S = 𝑝 and I = B = 0, and find the roots of the
characteristic equation thus:
Det.J(𝑝,0,0 ) =
−𝐧 − 𝛌 𝟎 −𝛂𝐩 𝐤 𝟎
𝟎
− (γ + τ) − 𝛌 𝛂𝐩 𝐤 𝛆 − (ɡ − Ɩ + ω) − 𝛌
= 0
(- n - λ)[(-(γ+τ)-λ)(-λ-(ɡ-Ɩ+ω)) - (εα𝑝)/k] – 0 + 0 = 0………8
Clearly λ1 = -n
and (-γ - τ - λ)(-λ - ɡ + Ɩ - ω) - 𝜺𝜶𝒑
kλ2
+ kλ(γ+τ+ɡ-Ɩ+ω) + k(γ(ɡ-Ɩ+ω) + τ(ɡ-Ɩ+ω)) – εα𝑝 = 0
kλ2 + kλ(γ+τ+ɡ-Ɩ+ω) + k(γ+τ)(ɡ-Ɩ+ω) – εα 𝑝 = 0
𝝀 =−𝒌 𝛾+𝜏+ɡ−Ɩ+𝜔 ± 𝒌(𝜸+𝝉+ɡ−Ɩ+𝝎) 𝟐−𝟒𝒌(𝒌(𝜸+𝝉)(ɡ−Ɩ+𝝎)−𝜺𝜶𝒑)
𝟐𝒌
=−𝒌 𝛾+𝜏+ɡ−Ɩ+𝜔 ± 𝟒𝒌𝜺𝜶𝒑−𝟒𝒌 𝒌 𝜸+𝝉 ɡ−Ɩ+𝝎 +[𝒌(𝜸+𝝉+ɡ−Ɩ+𝝎)]²
𝟐𝒌
𝝀 = −𝒌 𝛾+𝜏+ɡ−Ɩ+𝜔 ± 𝟒𝒌(𝜺𝜶𝒑− 𝒌 𝜸+𝝉 ɡ−Ɩ+𝝎 +[𝑘(𝛾 +𝜏+ɡ−Ɩ+𝜔)]
𝟐
𝟐𝒌
𝝀₂ =−𝒌 𝛾+𝜏+ɡ−Ɩ+𝜔 + 𝟒𝒌(𝜺𝜶𝒑− 𝒌 𝜸+𝝉 ɡ−Ɩ+𝝎 +[𝑘(𝛾 +𝜏+ɡ−Ɩ+𝜔)]
𝟐
𝟐𝒌
𝝀₃ =−𝒌 (𝛾+𝜏+ɡ−Ɩ+𝜔)− 𝟒𝒌(𝜺𝜶𝒑− 𝒌 𝜸+𝝉 ɡ−Ɩ+𝝎 +[𝑘(𝛾 +𝜏+ɡ−Ɩ+𝜔)]
𝟐
𝟐𝒌
For λ2 to be negative so that the disease-free equilibrium to be asymptotically stable, such that the disease dies out with time,
𝟒𝒌(𝜺𝜶𝒑 − 𝒌(𝜸 + 𝝉)(ɡ − Ɩ + 𝝎)) + [𝒌(𝜸 + 𝝉 + ɡ − Ɩ + 𝝎)]𝟐 < 𝒌(𝛾 + 𝜏 + ɡ − Ɩ + 𝜔)...10
THE BASIC REPRODUCTION NUMBER R
oAND THE CRITICAL NUMBER (TRESHOLD) S
cOF THE
MODEL
We have established that:
𝟒𝒌(𝜺𝜶𝒑 − 𝒌(𝜸 + 𝝉)(ɡ − Ɩ + 𝝎)) + [𝒌(𝜸 + 𝝉 + ɡ − Ɩ + 𝝎)]𝟐< 𝒌(𝛾 + 𝜏 + ɡ − Ɩ + 𝜔)
For the disease to dies out with time. Hence if
𝟒𝒌𝜺𝜶𝒑 − 𝟒𝒌𝟐(𝜸 + 𝝉)(ɡ − Ɩ + 𝝎) + [𝒌(𝜸 + 𝝉 + ɡ − Ɩ + 𝝎)]² < 𝒌(𝛾 + 𝜏 + ɡ − Ɩ + 𝜔)
we observe that
𝟒𝒌𝜺𝜶𝒑 − 𝟒𝒌2 𝜸 + 𝝉 ɡ − Ɩ + 𝝎 < 0 for the condition in equation (10) to hold.
[ 𝟒𝒌𝜺𝜶𝒑 𝟒𝒌²(𝜸+𝝉)(ɡ−Ɩ+𝝎)−
𝟒𝒌²(𝜸+𝝉)(ɡ−Ɩ+𝝎)
𝟒𝒌²(𝜸+𝝉)(ɡ−Ɩ+𝝎)]𝟒𝒌²(𝜸 + 𝝉)(ɡ − Ɩ + 𝝎) < 0
= ( 𝟒𝒌𝜺𝜶𝒑
𝟒𝒌²(𝜸 + 𝝉)(ɡ − Ɩ + 𝝎)− 𝟏)𝟒𝒌²(𝜸 + 𝝉)(ɡ − Ɩ + 𝝎) < 0
Since 𝟒𝒌²(𝜸 + 𝝉)(ɡ − Ɩ + 𝝎) > 0
Therefore ( 𝟒𝒌𝜺𝜶𝒑
𝟒𝒌²(𝜸+𝝉)(ɡ−Ɩ+𝝎)− 𝟏) < 0
This implies 𝜺𝜶𝒑
𝒌(𝜸+𝝉)(𝒈−𝒍+𝝎)− 𝟏 < 0
Suppose 𝜺𝜶𝒑
𝒌(𝜸+𝝉)(𝒈−𝒍+𝝎) = RO………11
We get Ro – 1< 0
This means Ro < 1
Therefore the basic reproduction number of the model is
Ro = 𝜺𝜶𝒑 𝒌(𝜸+𝝉)(𝒈−𝒍+𝝎)
The basic reproduction number Ro was defined by Fraser et
al (2011) as: ―The number of secondary infections generated by a primary infection in susceptible population and which thus measure the intrinsic transmissibility of an infectious agent. For an epidemic to expand in the early stage of spread more than one secondary case has to be generated by the primary case and hence we need
Ro > 1‖.
Theorem 1: The disease-free equilibrium state of this model is locally asymptotically stable if Ro < 1 and unstable if Ro >
1. From theorem 1, the disease-free equilibrium state is reached, since Ro obtained in this model is less than one, it
means that when S = 𝑝, I = B = 0, there will be no cholera outbreak. The critical number or threshold, denoted by Sc of
this model is 𝒑
𝑹ₒ which means Sc =
𝒌(𝜸+𝝉)(𝒈−𝒍+𝝎) 𝜺𝜶 These
values Ro and Sc are used to predict and estimate cholera
outbreak as follows: If the number of susceptible in the population is greater than the critical number Sc, an
outbreak of cholera will occur, the outbreak can be endemic or pandemic. If the number of susceptible in the population is less than the critical number Sc, the number of cases of
cholera will decrease and will return to zero. When Ro < 1,
the stability of the disease-free equilibrium state is stable. When Ro > 1 the stability of disease-free equilibrium is
unstable, that’s stability of cholera epidemic is stable.
CONCLUSION
In our findings, we were made to know that vibrios cholerae bacteria, is not only ingested from drinking water, but also in food poorly handled interms hygienic and sanity conditions. Rate of growth of vibrios cholerae in the environment will increase, if sanity and hygienic measures decreases. In the analysis, the stability of zero equilibrium state is obtained. Disease-free equilibrium is achieved at zero infectives and zero toxigenic bacteria nunber. Critical number (threshold) Sc is obtained, which is one of the yard
stick of predicting cholera outbreak. If the number of susceptible in the population is greater than the critical number (Sc) cholera outbreak will occur. Otherwise, the
cases of cholera will decrease and return to zero. Another yard stick for predicting cholera outbreak in this work, is the basic reproduction number (Ro). If Ro is greater than one,
cholera outbreak will occur in the concern community, if it is less than one the case(s) will reduce(s) and die(s) out. If Ro
= 1, the case is undetermined. From this work if ω and τ are high this will result in decrease in ɡ. The Ro will be less than
one and the Sc will be greater than the susceptible. Which
implies no cholera outbreak. If ω and τ are low ɡ will be high Ro > 1 and Sc will be less than the susceptible which
means cholera outbreak will occur. There is need to assertain the minimum rates of ω and τ which must be maintained to assure hinderance of cholera outbreak. It should be noted that cholera outbreak can occur in a region where it had never occured before, the chance of this happening is higher when Ro > 1.
REFERENCES
[1]. Akor A. N. (2007). Handbook on Management of Tropical Disease in Developing Countries. A Guide to the Diagnosis and Treatment of Common Diseases in the Tropics. Bamise Printing Press Lokoja Nigeria.
[2]. Baylyegn, Y.N. (2009) Mathematical Analysis of a Model of Cholera Transmission Dynamics. Postgraduate Diploma Project in the African Institute for Mathematical Science South Africa.
[3]. Codeco C. T. (2001). Endemic and epidemic dynamic of cholera: the role of the aquatic reservoir. BioMedcentral Infectious diseases 1:1. 1471- 2334.
[4]. Fraser, C., Riley S. Aderson R. M. and Ferguson N. M. (2004). Factors that make an Infectious Disease Outbreak Controllable. Proceedings of the National Academy of Sciences of the USA.
[5]. Hartley D. M., Morris J. G. Jr. Smith D. L. (2006). Hyper infectivity: A Critical Element in the Ability of V. Cholerae to cause Epidemic? PLOS medicine. 3(1)
[6]. Isere O. A. and E. Osemwenkhae J. (2010) Vibrio Cholerae in Nigeria. A Logistic Investigation of its Stability in its Habitat Nigerian Annals of Natural Sciences, 10(1) 71-76.
[7]. Mukandavire Z., Liao S., Wang J. and Gaff H. (2011). Estimating the basic reproduction number for the 2008-2009 cholera outbreak in Zimbabwe.
Proceedings of the National Academy of Sciences of the USA. 108(21) 8767-8772
[8]. Tian J. P., Liao S and Wang J. (2010) Dynamical Analysis and Control Strategies in Modelling Cholera. PDF Downloaded from www.altavista.com
on 13-10-2011; 1-15
[9]. Yoon S. S. And Mekalanos J. J. (2006). 2,3-Butanediol Synthesis and the Emergence of the Vibrio Cholera El Tor Biotype. Infection and Immunity: American Society for Microbiology. 6547-6556
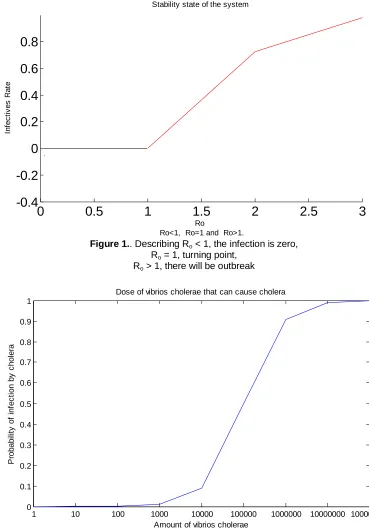
Figure 1.. Describing Ro < 1, the infection is zero,
Ro = 1, turning point,
Ro > 1, there will be outbreak
Figure 2.. Describing amount of vibrios cholerae that when ingested can cause the corresponding probability of catching
cholera disease.
0
0.5
1
1.5
2
2.5
3
-0.4
-0.2
0
0.2
0.4
0.6
0.8
Ro
Ro<1, Ro=1 and Ro>1.
In
fe
c
ti
v
e
s
R
a
te
Stability state of the system
1 10 100 1000 10000 100000 1000000 10000000 100000000 0
0.1 0.2 0.3 0.4 0.5 0.6 0.7 0.8 0.9 1
Amount of vibrios cholerae
P
ro
b
a
b
ili
ty
o
f
in
fe
c
ti
o
n
b
y
c
h
o
le
ra