University of Pennsylvania
ScholarlyCommons
Publicly Accessible Penn Dissertations
1-1-2015
Building and Mining an Atlas of the Mammalian
Circadian Transcriptome
Ray Zhang
University of Pennsylvania, [email protected]
Follow this and additional works at:
http://repository.upenn.edu/edissertations
Part of the
Bioinformatics Commons
, and the
Genetics Commons
Recommended Citation
Zhang, Ray, "Building and Mining an Atlas of the Mammalian Circadian Transcriptome" (2015).Publicly Accessible Penn Dissertations. 1171.
Building and Mining an Atlas of the Mammalian Circadian Transcriptome
Abstract
Nearly all mammals possess internal clocks that synchronize with the day-night cycles of their environments. These circadian clocks help temporally segregate competing or incompatible physiological processes to anticipated appropriate times of the day. As the mammalian clock system is principally regulated by
transcription factors, numerous previous studies have sought to characterize gene-transcript oscillations as a primary means of gaining insight into what pathways are controlled by the clock. However, most studies have only examined one or two specific tissue types at a time, often with suboptimal sampling resolution. Little work has been done to analyze clock control at the organism level. Furthermore, despite the apparent importance of circadian rhythms in nearly all major physiological processes, actionable medical knowledge has been difficult to extract. This lack of translational insight is not due to a simple lack of data, but rather to gaps in assembling a big picture from scattered data and to deficiencies in analytical methods.
The goal of this dissertation was to overcome these shortcomings by forging a comprehensive atlas of the mammalian circadian transcriptome. High-throughput techniques were used to identify circadian transcript rhythms at a high sampling resolution in twelve different organs. This work brought to light critical systemic roles of the mammalian circadian clock at the organism level, while providing a blueprint for future
advancements in chronotherapy. Findings from this work have actionable implications for the dosing of many important drugs. An algorithm for analyzing gene-phase set enrichment was also developed to address insufficiencies in existing methods. Applying this algorithm to earlier data uncovered insights into the relative timing of circadian genes that were missed when using existing methods. Further mining of data from other labs revealed unexpected findings that challenge current paradigms in the field. Taken in sum, the work presented in this dissertation is an evaluation into how our internal clocks schedule the myriad aspects of our physiology on a daily basis, with striking ramifications for clinical medicine.
Degree Type
Dissertation
Degree Name
Doctor of Philosophy (PhD)
Graduate Group
Genomics & Computational Biology
First Advisor
John B. Hogenesch
Keywords
biology, circadian, genomics, pathway, systems, transcriptome
Subject Categories
BUILDING AND MINING AN ATLAS OF THE MAMMALIAN CIRCADIAN
TRANSCRIPTOME
Ray Zhang
A DISSERTATION
in
Genomics and Computational Biology
Presented to the Faculties of the University of Pennsylvania
in
Partial Fulfillment of the Requirements for the
Degree of Doctor of Philosophy
2015
Supervisor of Dissertation
_________________________
John B. Hogenesch, Ph.D., Professor of Pharmacology
Graduate Group Chairperson
_________________________
Li-San Wang, Ph.D., Associate Professor of Pathology and Laboratory Medicine
Dissertation Committee
Maja Bucan, Ph.D., Professor of Genetics
Warren J. Ewens, Ph.D., Professor of Genetics
BUILDING AND MINING AN ATLAS OF THE MAMMALIAN CIRCADIAN TRANSCRIPTOME
COPYRIGHT
2015
Ray Zhang
This work is licensed under the Creative Commons Attribution- NonCommercial-ShareAlike 3.0 License
ACKNOWLEDGMENTS
Several people have contributed critically to the work presented in this
dissertation. John B. Hogenesch conceived the research presented in chapter 2 and was
the primary mentor throughout. Michael E. Hughes also conceived the research
presented in chapter 2 and oversaw and performed the organ collection and RNA
isolation. Nicholas F. Lahens analyzed sequencing and ncRNA data. Heather I. Balance
prepared organ samples for array hybridization and sequencing. Ron C. Anafi conceived
the research presented in chapter 3 and was mentor during algorithm design and testing.
All of these people have contributed towards the writing.
Additionally, Jeanne Geskes, Trey Sato, George Paschos, Julie Baggs,
Takeshige Kunieda, Zivjena Vucetic, Lei Yin, Boning Li, and Kathy Totoki helped with
circadian time-point collection. Penn Genome Frontiers Institute sequencing core helped
with library construction and sequencing. Penn Molecular Profiling Facility helped with
preparation and running of microarrays. Katharina Hayer and the Penn ITMAT
bioinformatics core assisted with data analysis. Jacki Growe, Lauren Francey, Anthony
George-Olarerin, Ibrahim H. Kavakli, Anand Venkataraman, Gang Wu, Maja Bucan,
Warren J. Ewens, Christian J. Stoeckert, and Rafael A. Irizarry all provided intellectual
feedback and suggestions towards the work.
ABSTRACT
BUILDING AN ATLAS OF THE MAMMALIAN CIRCADIAN TRANSCRIPTOME
Ray Zhang
John B. Hogenesch
Nearly all mammals possess internal clocks that synchronize with the day-night
cycles of their environments. These circadian clocks help temporally segregate
competing or incompatible physiological processes to anticipated appropriate times of
the day. As the mammalian clock system is principally regulated by transcription factors,
numerous previous studies have sought to characterize gene-transcript oscillations as a
primary means of gaining insight into what pathways are controlled by the clock.
However, most studies have only examined one or two specific tissue types at a time,
often with suboptimal sampling resolution. Little work has been done to analyze clock
control at the organism level. Furthermore, despite the apparent importance of circadian
rhythms in nearly all major physiological processes, actionable medical knowledge has
been difficult to extract. This lack of translational insight is not due to a simple lack of
data, but rather to gaps in assembling a big picture from scattered data and to
deficiencies in analytical methods.
The goal of this dissertation was to overcome these shortcomings by forging a
comprehensive atlas of the mammalian circadian transcriptome. High-throughput
techniques were used to identify circadian transcript rhythms at a high sampling
resolution in twelve different organs. This work brought to light critical systemic roles of
the mammalian circadian clock at the organism level, while providing a blueprint for
implications for the dosing of many important drugs. An algorithm for analyzing
gene-phase set enrichment was also developed to address insufficiencies in existing methods.
Applying this algorithm to earlier data uncovered insights into the relative timing of
circadian genes that were missed when using existing methods. Further mining of data
from other labs revealed unexpected findings that challenge current paradigms in the
field. Taken in sum, the work presented in this dissertation is an evaluation into how our
internal clocks schedule the myriad aspects of our physiology on a daily basis, with
TABLE OF CONTENTS
ACKNOWLEDGMENTS ... IV
ABSTRACT ... V
TABLE OF CONTENTS ... VII
LIST OF TABLES ... IX
LIST OF FIGURES ... X
CHAPTER 1: A REVIEW OF CIRCADIAN RHYTHMS ... 1
Core components of the mammalian circadian clock ... 2
Hierarchy of clocks in mammals... 5
Genome-wide circadian gene expression ... 7
Effects of the clock on the body ... 10
Goals of this dissertation ... 13
CHAPTER 2: A CIRCADIAN GENE EXPRESSION ATLAS IN MAMMALS ... 15
Genes and non-coding transcripts ... 16
Gene parameters ... 24
Pathways ... 30
Drug targets and disease ... 34
Discussion ... 40
Methods ... 43
Supplementary Methods ... 44
Gene-phase set enrichment algorithm ... 53
Case study 1: mice in the natural state ... 57
Case study 2: mice in a perturbed state ... 60
Case study 3: binding of the core circadian transcription factors to DNA ... 65
Case study 4: the cell cycle of two cancer cell lines ... 68
Discussion ... 73
Methods ... 74
CHAPTER 4: CLOSING REMARKS ... 77
Future directions ... 78
Final thoughts ... 80
LIST OF TABLES
Table 2.1: Drugs of the top-100 best-seller list that target circadian genes
and have half-life < 6h ... 35
Table 3.1: Phase shift of degradation or synthesis pathways after restricting
feeding time. ... 64
LIST OF FIGURES
Figure 1.1: The core loops of the circadian clock of mammals. ... 3
Figure 1.2: Central and peripheral clocks.. ... 5
Figure 1.3: The biological clock is located within the suprachiasmatic nucleus in
the brain.. ... 7
Figure 1.4: Example of circadian gene expression.. ... 10
Figure 1.5: Biological clock affects the daily rhythm of many physiological
processes.. ... 12
Figure 2.1: Identifying oscillating transcripts across different organs.. ... 17
Figure 2.2. Breakdown of circadian genes and ncRNAs.. ... 18
Figure 2.3: Conserved circadian ncRNAS. ... 20
Figure 2.4: Representative examples of conserved circadian ncRNAs and
anti-sense transcripts... 23
Figure 2.5: Parameters of circadian genes across organs. ... 25
Figure 2.6: Genomic characteristics of circadian genes. ... 27
Figure 2.7: Expression of core circadian oscillator genes across organs. ... 29
Figure 2.8: Discovering oscillation influence on pathways. ... 30
Figure 2.9: Exploring pathways across biological space and time. ... 32
Figure 2.10: Circadian disease genes and drug targets. ... 37
Figure 2.11: Mir22 reduces endogenous PTGS1 in NIH3T3 cells. ... 37
Figure 2.12: Correlation between association significance of diseases with
circadian genes and NIH research funding towards each disease. ... 39
Figure 3.1: Simulated Kolmogorov-Smirnov (KS) test and Kuiper test results. ... 54
Figure 3.3: Phase-clustered pathways in skeletal muscle. ... 59
Figure 3.4: Comparison of phase-clustered pathways in liver derived from two
different algorithms for estimating individual gene phases. ... 60
Figure 3.5: Comparison of phase shifts between the individual gene level and the
gene-set level after two different perturbations. ... 62
Figure 3.6: Phases of circadian genes targeted by core clock transcription factors.
... 67
Figure 3.7: Summary diagram of pathways comprising cell-cycle periodic genes
in HeLa cells. ... 69
Figure 3.8: Summary diagram of pathways comprising cell-cycle periodic genes
in U2OS cells. ... 70
CHAPTER 1:
A REVIEW OF CIRCADIAN RHYTHMS
Life evolved on a rotating planet. As a consequence, biological adaptations to the
phenomenon of oscillation are some of the most fundamental and well-preserved
features of living organisms. When the development of the scientific method introduced
quantitative observations to the study of biology, circadian rhythms were one of the first
curiosities of life to receive rigorous investigation. In as early as 1729, a French
astronomer named Jean-Jacques d’Ortous de Mairan published evidence that Mimosa
plant leaves opened and closed on a 24-hour cycle, even when placed in a box of
constant darkness(Lemmer 2009). The leaves would unfurl as if the time of sunrise had
been anticipated through some form of internal clock. However, it was not until the
1950s that the term “circadian,” derived from the Greek words “circa” (approximately)
and “diem” (day), was introduced into the formal scientific literature by Franz
Halberg(HALBERG 1953), whom many consider to be the father of the field. Since that
time, research into circadian rhythms has expanded tremendously to the point of
widespread interest.
The biological circadian clock was first appreciated to be encoded by genetic
information when the Per gene was discovered in Drosophila melanogaster in 1971(Konopka & Benzer 1971). These early experiments used forward genetics to
identify genes causing a mutant phenotype wherein 24-hour rhythms of the animal were
critical genes involved in the clock, in a numerous variety of organisms, and reported
involvement of the clock in controlling aspects of physiology such as sleep, development,
metabolism, signal transduction, and immune function. In 1990, a seminal paper by
Hardin et al.(Hardin et al. 1990) proposed a basic network model that would eventually evolve into our canonic understanding of the molecular clock. This model involves a core
transcriptional negative-feedback loop whose kinetics are such that turnover of the loop
takes 24 hours, coinciding with the environmental cycle of day and night.
Core components of the mammalian circadian clock
It is now appreciated that the molecular circadian clock in mammals is principally
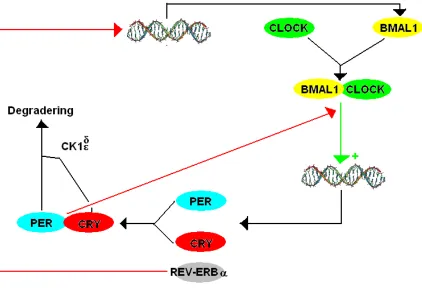
composed of two arms (Figure 1.1). The “positive” arm consists of the transcriptional
activators CLOCK (circadian locomotor output cycles kaput) and BMAL1 (brain and
muscle Arnt-like protein). These two members of the basic helix-loop-helix (bHLH)-PAS
(Period-Arnt-Single-minded) transcription factor family heterodimerize in the cytoplasm
to form a complex that can translocate to the nucleus to initiate transcription of genes in
the “negative” arm: the Period (Per1, Per2, Per3) and Cryptochrome (Cry1, Cry2)
genes(Yoo et al. 2005). The PER and CRY gene products of the negative arm are
transcriptional repressors, which also heterodimerize in the cytoplasm to form a complex
that can translocate into the nucleus. In the nucleus, PER-CRY complexes inhibit
BMAL1 complexes, imposing negative feedback onto the loop. As
CLOCK-BMAL1 complex activity decreases, formation of PER-CRY complexes halts as a
result(van der Horst et al. 1999). As PER-CRY complexes recede and are degraded,
approximately 24 hours to take place and is robust to steady-state changes in
temperature or metabolism(Takahashi et al. 2008).
Figure 1.1: The core loops of the circadian clock of mammals.
PER=Period, CRY=Cryptochrome, BMAL1=Brain and Muscle ARNT-like 1 CK1d/e=Casein
kinase 1 delta/epsilon. red arrows indicate inhibition and green ones indicate stimulation. This
image is by Nitramus and is licensed under the GNU Free Documentation License at Creative
Commons (Circadian clock of mammals.PNG). The DNA molecule is by Michael Ströck and
licensed under GFDL at Commons (DNA Overview.PNG).
The core transcription-factor loop is secondarily modulated by interactions with a
involves the nuclear hormone receptors REV-ERB (reverse-erb) alpha and ROR
(retinoic acid receptor-related orphan receptor) alpha/beta, which bind to enhancer
elements that repress or induce Bmal1 transcription, respectively(Preitner et al. 2002). In turn, CLOCK-BMAL1 complexes regulate the production of REV-ERB in a similar
manner as with PER and CRY. PPAR (peroxisome proliferator-activated receptor) alpha
and its coactivator PGC1 (peroxisome proliferators-activated receptor gamma
coactivator 1) alpha further modulate this accessory loop to regulate expression of
Bmal1(Liu et al. 2007). This involvement of PPAR in the circadian clock is significant because PPAR ligands are clinically prescribed for the control of hyperlipidemia and
hyperglycemia, especially for patients with diabetes. Evidence that disruption of
circadian rhythms is linked to metabolic disorders, one of the leading causes of morbidity
in the United States, has been increasingly brought to light(Marciano et al. 2014).
Post-transcriptional processes also play a substantial role in the regulation of the
core clock system. These processes presently make up an active area of research.
Phosphorylation of PER2 promotes dimerization with CRY(Yagita et al. 2002), while
phosphorylation of PER1 modulates nuclear translocation(Vielhaber et al. 2000).
Hyperphosphorylation of CRY by CK1 (casein kinase 1) epsilon is an important
mechanism for regulating degradation of the PER-CRY complex. Likewise, SUMOylation
of BMAL1, which occurs in a circadian rhythm, modulates degradation of the
Hierarchy of clocks in mammals
For the mammalian circadian clock system, a distinction is made between the
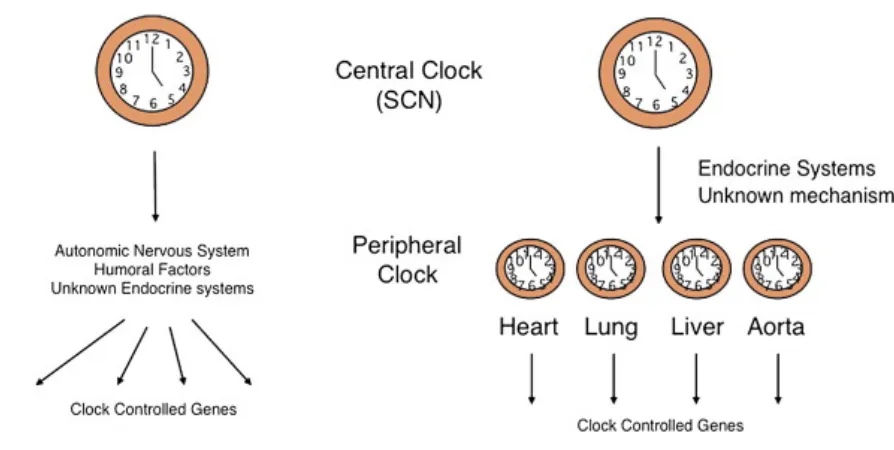
“central” clock and “peripheral” clocks (Figure 1.2). The central clock is that of the
suprachiasmatic nuclei (SCN) of the hypothalamus (Figure 1.3). It is considered as the
body’s master clock, to which clocks in the rest of the body (periphery) are synchronized.
The SCN pacemaker is entrained daily by light cues from the environment that stimulate
specialized photoreceptors in the retina(Golombek & Rosenstein 2010), and, for
mammals, light is the only major stimulus capable of setting the master clock under
normal conditions.
Figure 1.2: Central and peripheral clocks.
The body has other secondary or peripheral circadian clocks, located in various organs, but all
are influenced by the central circadian clock in the suprachiasmatic nucleus. This image has been
In contrast, peripheral clocks, though synchronized by the central rhythm, are not
directly affected by light and actually oscillate independently of the central nervous
system. Studies have shown that peripheral tissues can maintain their own circadian
rhythms for days even after complete experimental isolation from the SCN(Yoo et al.
2004). Rather than light itself, other cues are responsible for principally resetting in
peripheral tissues, the best-known example of which is feeding(Hara et al. 2001). Due to
this discrepancy in the primary resetting stimulus between the SCN and periphery, it is
possible for central clocks to become decoupled and phase-shifted from peripheral
clocks, as has been observed in mice under conditions of restricted feed time(Damiola et
al. 2000). Mismatches in rhythm phase between tissues is likely to have deleterious
systemic effects and has been associated with diseases such as Huntington’s(Maywood
Figure 1.3: The biological clock is located within the suprachiasmatic nucleus in the brain.
This image has been reproduced from Psychology Continuing Education(Anon n.d.).
Genome-wide circadian gene expression
Around the start of the 21st century, microarray technology heralded the ability for
large-scale observation of gene expression across an entire genome. Numerous studies
aimed at identifying the circadian transcriptome in various tissues and under different
conditions were published(Ueda et al. 2002; Panda et al. 2002; Duffield et al. 2002;
Storch et al. 2002). Multiple studies concurred that approximately 10-15% of genes in
the mammalian genome are expressed in a circadian rhythm. However, the overall
expression pattern of such genes could differ greatly between different tissues. For
circadian genes in the liver tended to have peak expression distributed broadly
throughout the day. Furthermore, the identities of circadian genes also tended to be
quite different between tissues. Out of 650 circadian genes that were detected in the
SCN or liver by Panda et al., only 28 were found in common between both organs. Similar findings of tissue-specificity amongst circadian genes were reported in similar
studies of other tissues. With the recent advent of high-throughput sequencing
technologies, many groups have prepared to further investigate this line of research
using RNA-sequencing instead of, or in addition to, microarrays.
Most studies of this type have held to the same methodological principles that
were used by Jean-Jacques d’Ortous de Mairan back in 1729. The subject of study,
whether it be an animal or plant, is first entrained to baseline oscillations in the
environment. In modern research, this typically means exposure to a controlled
environment with alternating 12-hours of light and 12-hours of dark, for several days,
while other environmental stimuli such as temperature, noise, and food are held constant.
The subject is then “released” into constant darkness and observed by various means.
Under constant darkness, features that are driven by the subject’s circadian clock, such
as circadian gene expression, will continue to oscillate, while those that are driven
directly in reaction to light will lose rhythmicity. Through applying genomic techniques to
this study design, researchers have sought to identify how much of the genome is
circadian.
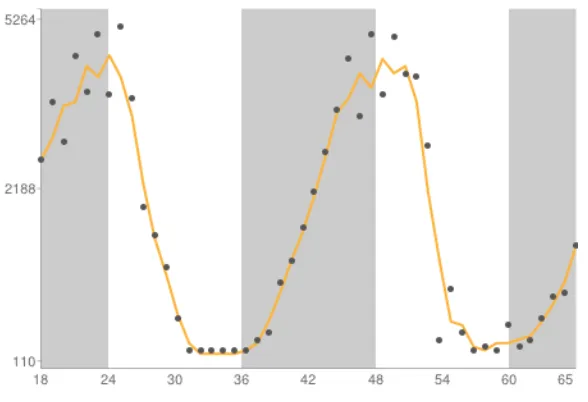
While the canonic estimate has been that 10-15% of mammalian genes oscillate
in a circadian rhythm (Figure 1.4), this answer is not clear-cut for several reasons. Firstly,
technical aspects of microarray technology and normalization can strongly bias the data
an invasive procedure that demands the subject to be sacrificed. Thus, each data point
from circadian gene-expression time-series have almost always come from different
individuals, which introduces additional layers of error. Thirdly, studies are often
extremely limited in the number of circadian cycles (days) that may be observed at an
acceptable temporal resolution due to cost. By the Nyquist theorem, a certain sampling
rate must be achieved in order to faithfully recover an oscillatory signal. Most studies
have used a sampling resolution of 6- or 4-hours, over two (sometimes even one) days.
Thus, most studies have been underpowered to detect circadian rhythms. Finally, the
statistical tests used to detect oscillations in gene expression have varied significantly
from study to study, ranging from goodness-of-fit based tests such as COSOPT(Nelson
et al. n.d.) and JTK_CYCLE(Hughes et al. 2010), to Fourier-based algorithms such as
Lomb-Scargle(Glynn et al. 2006) and Arser(Yang & Su 2010). These tests have been
known to yield discrepant results under different circumstances(Wu et al. 2014). Taken
altogether, the exact degree to which the mammalian genome is under circadian control,
Figure 1.4: Example of circadian gene expression.
Gene expression profile of the Bmal1 gene, also known as Arntl, in mouse liver. X-axis units are
hours (circadian time), while y-axis units are arbitrary expression units. This plot was downloaded
from the CircaDB database (http://bioinf.itmat.upenn.edu/circa/), with data deriving from a study
by Hughes et al.(Hughes et al. 2009)
Effects of the clock on the body
The circadian clock allows an organism the ability to anticipate critical events in
their surroundings, such as sunrise, rather than merely to react to them. It allows
different structures within the body to temporally segregate competing or incompatible
processes, such as rest vs. wakefulness or synthesis vs. degradation, and furthermore
allows these processes to be synchronized to the appropriate time of day(Robertson et
al. 2008). This internal preparation has been shown to provide selection advantage in a
variety of organisms. Reproductive fitness and/or growth are noticeably worsened in
Arabidopsis thaliana(Dodd et al. 2005)when the endogenous clock is either mutated or made asynchronous with a 24-hour light/dark cycle.
In fact, the circadian clock seems to have a role in nearly all major aspects of
physiology, including sleep, feeding, growth, movement, hormone secretion, and
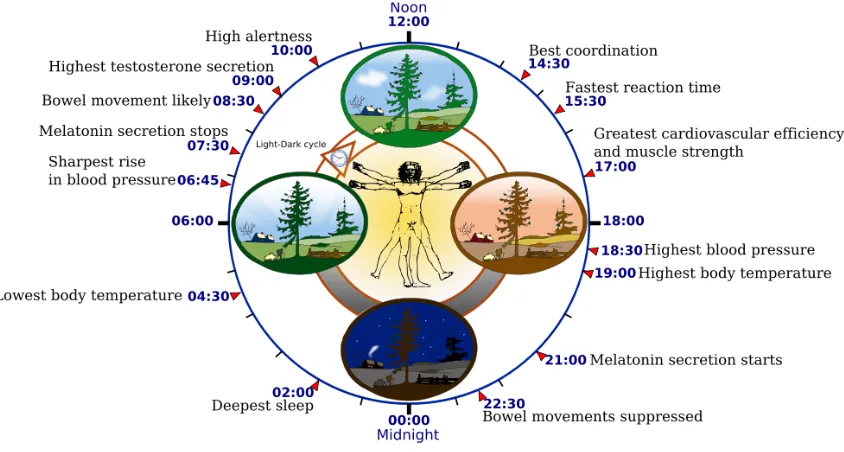
immune function(Sharma 2003)(Figure 1.5). Disruption of an animal’s normal circadian
rhythms affects glucose homeostasis, lipid metabolism, cardiovascular disease, and
chemotherapeutic sensitivity(Martino et al. 2008; Scheer et al. 2009; Buxton et al. 2012).
Mutations in genes controlling the circadian clock result in increased sensitivity to
mutagens(Fu et al. 2002; Hoffman et al. 2010), while alterations in cell cycle checkpoints
precede cancer(Kastan & Bartek 2004). Shift work is epidemiologically linked to
increased risk of obesity(De Bacquer et al. 2009), diabetes(Maury et al. 2010),
cardiovascular disease(Faraut et al. 2012), and cancers of the breast(Davis et al. 2001;
Grundy et al. 2013), prostate(Flynn-Evans et al. 2013), endometrium(Viswanathan et al.
2007), and other organs(Sahar & Sassone-Corsi 2009; Parent et al. 2012). The history
of our evolution has been so fundamentally dependent on the perpetual cycle of day and
Figure 1.5: Biological clock affects the daily rhythm of many physiological processes.
This diagram depicts the circadian patterns typical of someone who rises early in morning, eats
lunch around noon, and sleeps at night (10 p.m.). Although circadian rhythms tend to be
synchronized with cycles of light and dark, other factors - such as ambient temperature, meal
times, stress and exercise - can influence the timing as well. The work was done with Inkscape by
YassineMrabet. Informations were provided from "The Body Clock Guide to Better Health" by
Michael Smolensky and Lynne Lamberg; Henry Holt and Company, Publishers (2000).
Landscape was sampled from Open Clip Art Library (Ryan, Public domain). Vitruvian Man and
the clock were sampled from Image:P human body.svg (GNU licence) and Image:Nuvola apps
clock.png, respectively. This image is licensed under the GNU Free Documentation License at
Creative Commons.
There is growing pharmaceutical interest in leveraging circadian rhythms to
improve treatment – a concept referred to as “chronotherapy.” Studies have found that
profile of treatment(Baraldo 2008). A notable example is seen in the treatment of
hypertension(Hermida et al. 2007), as blood pressure has long been known to rise
during the day and decline during the night. Other examples include the treatment of
asthma(Pincus et al. 1995), and the use of non-steroidal anti-inflammatory drugs
(NSAIDS)(Levi & Schibler 2007) and statins(Mück et al. 2000), which have all been
found to work better at certain times of the day. Chemotherapy has been suggested to
be more tolerable for patients whose circadian rhythms are properly maintained after
treatment(Ortiz-Tudela et al. 2014). Despite these findings, however, circadian rhythms
are generally not yet part of any primary consideration in the clinical setting for most
other situations as translatable research on this topic is still in its infancy. A full
understanding of the clock at the systems level will likely have a tremendous impact on
our ability to improve health.
Goals of this dissertation
Nearly all mammals possess internal clocks that synchronize with the day-night
cycles of their environments. These circadian clocks help temporally segregate
competing or incompatible physiological processes to anticipated appropriate times of
the day. As the mammalian clock system is principally regulated by transcription factors,
numerous previous studies have sought to characterize gene-transcript oscillations as a
primary means of gaining insight into what pathways are controlled by the clock.
However, most studies have only examined one or two specific tissue types at a time,
often with suboptimal sampling resolution. Little work has been done to analyze clock
control at the organism level. Furthermore, despite the apparent importance of circadian
been difficult to extract. This lack of translational insight is not due to a simple lack of
data, but rather to gaps in assembling a big picture from scattered data and to
deficiencies in analytical methods.
The goal of this dissertation was to overcome these shortcomings by forging a
comprehensive atlas of the mammalian circadian transcriptome. High-throughput
techniques were used to identify circadian transcript rhythms at a high sampling
resolution in twelve different organs. This work brought to light critical systemic roles of
the mammalian circadian clock at the organism level, while providing a blueprint for
future advancements in chronotherapy. Findings from this work have actionable
implications for the dosing of many important drugs. An algorithm for analyzing
gene-phase set enrichment was also developed to address insufficiencies in existing methods.
Applying this algorithm to earlier data uncovered insights into the relative timing of
circadian genes that were missed when using existing methods. Further mining of data
from other labs revealed unexpected findings that challenge current paradigms in the
field. Taken in sum, the work presented in this dissertation is an evaluation into how our
internal clocks schedule the myriad aspects of our physiology on a daily basis, with
striking ramifications for clinical medicine.
The overarching focus of this work has been to lay a foundation for extracting
knowledge about circadian rhythms that will be directly impactful in changing the
landscape of medicine. My hope is that the findings herein can stimulate an eventual
shift in clinical paradigms towards a more serious consideration of circadian time during
CHAPTER 2:
A CIRCADIAN GENE EXPRESSION ATLAS IN MAMMALS
Circadian rhythms are endogenous 24-hour oscillations in behavior and
biological processes found in all kingdoms of life. This internal clock allows an organism
to adapt its physiology in anticipationof transitions between night and day. The circadian
clock drives oscillations in a diverse set of biological processes, including sleep,
locomotor activity, blood pressure, body temperature, and blood hormone levels(Levi &
Schibler 2007; Curtis & Fitzgerald 2006). Disruption of normal circadian rhythms leads to
clinically relevant disorders including neurodegeneration and metabolic
disorders(Hastings & Goedert 2013; Marcheva et al. 2010). In mammals, the molecular
basis for these physiological rhythms arises from the interactions between two
transcriptional/translational feedback loops (reviewed in(Lowrey & Takahashi 2011)).
Many members of the core clock regulate the expression of other transcripts. These
clock-controlled genes mediate the molecular clock’s effect on downstream rhythms in
physiology.
In an effort to map these connections between the core clock and the diverse
biological processes it regulates, researchers have devoted significant time and effort to
studying transcriptional rhythms (Panda et al. 2002; Storch et al. 2002; Hughes et al.
2009; Koike et al. 2012; Vollmers et al. 2012). While extremely informative, most
circadian studies of this nature have analyzed one or two organs using microarrays, and
regulation of the non-coding transcriptome. To address these gaps in our knowledge, we
used RNA-sequencing (RNA-seq) and DNA arrays to profile the transcriptomes of twelve
different mouse organs: adrenal gland, aorta, brainstem, brown fat, cerebellum, heart,
hypothalamus, kidney, liver, lung, skeletal muscle, and white fat. We sampled organs
every 6 hours by RNA-seq and every 2 hours by arrays, to develop an atlas of mouse
biological space and time.
Using this resource, we examined the genomic characteristics of the rhythmic
coding and non-coding transcriptomes, the differences between organs in timing (phase)
and identity of oscillating transcripts, and the functional implications of rhythmic
regulation in various biological pathways. Lastly, we explored the potential medical
impact of circadian genes as drug targets and disease-associated genes. It is our hope
that this work provides a rich dataset to the research community that could power many
future studies.
Genes and non-coding transcripts
We defined a background set of 19,788 known protein-coding mouse genes and
for each organ we used the JTK_CYCLE(Hughes et al. 2010) algorithm to detect
24-hour oscillations in transcript abundance. For this protein-coding gene analysis, we
leveraged the high temporal resolution of the array data to accurately identify circadian
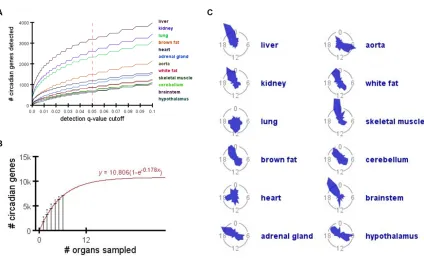
genes. We set a 5% false-discovery-rate for detection, though the specific value of this
cutoff did not affect the relative amount of rhythmic transcripts detected between organs
(Figure 2.1A). In this context, we defined the term “circadian gene” as any gene
identified as cycling with a 24-hour period by JTK_CYCLE, and passing the FDR cutoff
identify the expressed spliceforms of these circadian genes, and for our analysis of the
non-coding transcriptome.
Figure 2.1: Identifying oscillating transcripts across different organs.
A) The number of oscillating transcripts identified in each tissue as a function of the JTK_CYCLE
significance cutoff. B) The average total number of oscillating genes detected as a function of the
number of organs sampled. This is a repetition of the calculation performed in Figure 2.2C, using
only data from organs with a more homogeneous composition (liver, kidney, lung, heart, adrenal
gland, and skeletal muscle). Error bars represent standard deviation. Best-fit model has been
overlayed in red. C) Radial diagrams showing the phase distribution of oscillating genes in each
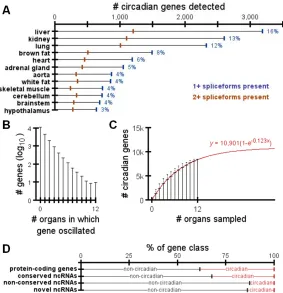
Following these analyses, we found liver had the most circadian genes (3,186),
while hypothalamus had the fewest (642) (Figure 2.2A). In fact, the three brain regions
(cerebellum, brainstem and hypothalamus) had the fewest circadian genes, collectively.
Due to the technical difficulty of precisely sampling brain regions, we assume that
heterogeneous mixtures of cell types within these complex organs may express different
sets of genes, or may be out of phase with each other. This
transcript/phase-discrepancy within the same organ would make it difficult to accurately identify circadian
genes in these brain regions. On average, 46% (s.d.=0.036%) of circadian
protein-coding genes expressed multiple spliceforms detected in the RNA-seq data.
A) Number of protein-coding genes in each organ with circadian expression. Blue marks indicate
the number of genes with at least 1 spliceform detected by RNA-seq. Orange marks indicate the
number of genes with at least 2 spliceforms detected by RNA-seq. Blue numbers to the right of
each bar list the percentage of protein-coding genes which rhythmic expression in each organ. B)
Distribution of the number of organs in which a protein-coding gene oscillated. C) Average total
number of circadian genes detected as a function of the number of organs sampled. Error bars
represent standard deviation. Best-fit model has been overlayed in red. D) Percentages of each
transcript class that did vs. did-not oscillate in at least one organ.
Transcript abundance for 43% of protein-coding genes oscillated in at least one
organ (Figure 2.2B). Only ten genes oscillated in all organs: Arntl, Dbp, Nr1d1, Nr1d2, Per1, Per2 and Per3 (core clock factors), as well as Usp2, Tsc22d3, and Tspan4. While the organs we analyzed provide a broad sampling across the entire organism, there are
still many more to study which may contain additional circadian genes. The average
number of total circadian genes, y, detected by randomly sampling x organs was closely modeled by the exponential function y=a(1-e-bx), where e is Euler’s number and the coefficients a (asymptote) and b (rate of asymptotic approach) equal 10,901 and 0.123, respectively (R2>0.99; Figure 2.2C). This estimate remains unchanged if we exclude the
potentially noisy, heterogeneous organs discussed above (Figure 2.3B). In other words,
as we continue to sample additional organs, we predict ~10,901 mouse protein-coding
genes (55% of the background set) will show circadian oscillations somewhere in the
body.
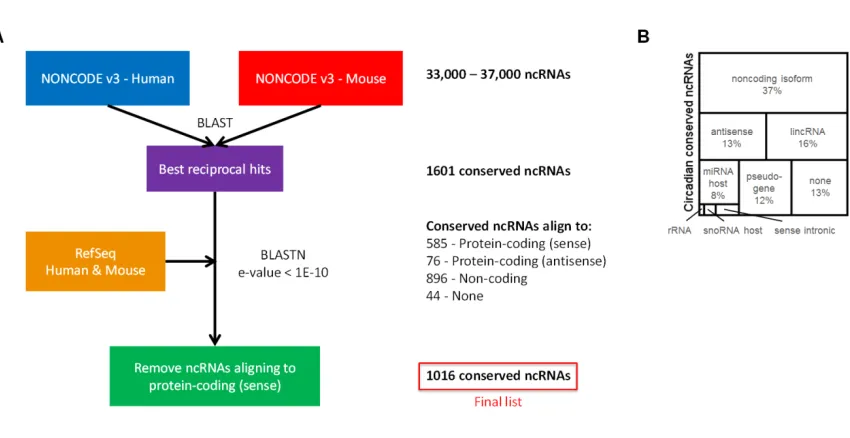
To study the non-coding transcriptome, we used the NONCODE to define a
background set of 1,016 mouse-human conserved ncRNAs (Figure 2.3A;
proportion compared to protein-coding genes), while non-conserved ncRNAs were less
likely to oscillate (Figure 2.2D). This suggests our set of conserved ncRNAs may be
functionally relevant. Unlike protein-coding genes, no individual ncRNA oscillated in
more than five organs. This is unsurprising, given that ncRNA expression is known to be
organ-specific(Washietl et al. 2014). We also found 712 of 5,154 unannotated, spliced
non-coding transcripts (Supplementary Methods) had rhythmic expression. 80% of these
aligned to the human genome (BLASTN, E<10-10, sequence identity >70%), indicating
they are conserved between human and mouse.
Figure 2.3: Conserved circadian ncRNAS.
(A) Method overview for identifying conserved ncRNAs. Full details on this method are available
in the main text of the paper and in the Supplementary Methods. (B) Functional types of circadian
conserved ncRNAs. Types were defined by GENCODE and Ensembl biotypes, assigned by using
Ensembl and manual annotation.
These conserved, clock-regulated ncRNAs covered a diverse set of functional
which were themselves circadian. There was no general phase relationship between
sense and antisense ncRNAs. For example, in the liver, both Galt
(galactose-1-phosphate uridylyltransferase) and an overlapping antisense ncRNA oscillated in phase
with each other (Figure 2.4A-D). We also identified host genes for 39 circadian miRNAs
and four snoRNA host genes: Cbwd1, Snhg7, Snhg11, and Snhg12. As snoRNAs were recently shown to have light-driven oscillations in Drosophila brains(Hughes et al. 2012), these findings provide further evidence of the clock's potential to influence ribosome
biogenesis(Jouffe et al. 2013). We also found 74 conserved lincRNAs with circadian
oscillations, the majority of which were Riken transcripts with no known function. Finally,
we also found 1979 genes with un-annotated antisense transcripts, 187 of which showed
sense and antisense oscillations in the same organ. Of these, 43 antisense transcripts
oscillated at least eight hours out of phase with their sense transcripts. Genes with
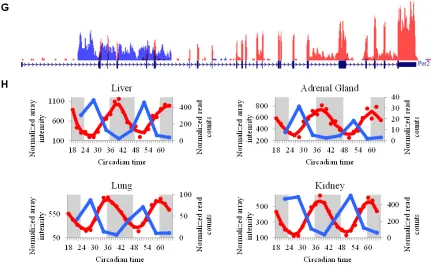
anti-phase, antisense oscillators included Arntl and Per2 (Figure 2.4E-H). A known Per2
antisense transcript (Koike et al. 2012; Vollmers et al. 2012) oscillated in 4 organs, the
most of any antisense transcript, providing further evidence of its functional relevance.
Taken together, our data reflect a vast and diverse set of transcripts regulated by the
Figure 2.4: Representative examples of conserved circadian ncRNAs and anti-sense transcripts.
A) RNA-seq coverage plot for Galt (red) and its antisense transcript (blue). The gene model for
Galt is displayed above the coverage plots. B) Expression profiles for Galt (red; data from
microarrays) and the antisense transcripts (blue; data from RNA-seq). Gray regions indicate
subjective night. C) RNA-seq coverage plot for Snhg12. The gene model is displayed below the
coverage plot. Note the locations of the mature snoRNA sequences located in the introns of
Snhg12. D) RNA-seq expression profiles for Snhg12 in brown adipose and hypothalamus. E)
RNA-seq coverage plot for Arntl (red) and its antisense transcript (blue), from white adipose. The
gene model for Arntl is displayed above the coverage plots. F) Expression profiles for Arntl (red;
data from microarrays) and the antisense transcripts (blue; data from RNA-seq), from white
adipose and liver. G) RNA-seq coverage plot for Per2 (red) and its antisense transcript (blue),
from white adipose. The gene model for Per2 is displayed above the coverage plots. H)
Expression profiles for Per2 (red) and the antisense transcript (blue) from liver, adrenal gland,
Gene parameters
Our data agree with the finding from previous multi-organ studies that the vast
majority of circadian-gene expression is organ-specific (Storch et al. 2002; Panda et al.
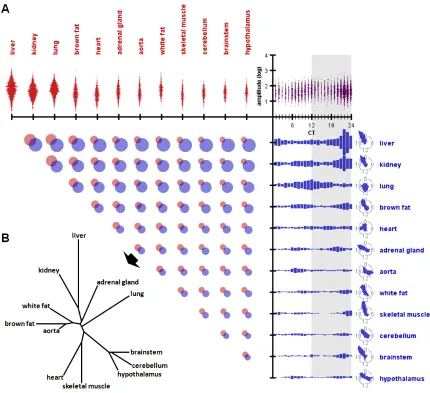
2002), with little overlap of circadian-gene identity between organs (Figure 2.5A). In most
organs, expression of circadian genes peaked in the hours preceding subjective dusk or
dawn, often in a bi-modal fashion. Heart and lung were notable exceptions, with phase
distributions that diverged substantially from other organs. Moreover, those circadian
genes expression peaks clustered around subjective dusk or dawn also tended to have
the highest average oscillation amplitude, compared to genes with expression peaks at
other times of day. Taken together, these data suggest that the body may experience
daily “rush hours” of transcription at these critical times. Using the average phase
difference between any two organs’ shared circadian genes as a distance metric, we
were able to construct an ontogenic tree that recovered recognizable organ lineage
(Figure 2.5B)(Edgar et al. 2013). Thus, developmentally related organs tended to share
Figure 2.5: Parameters of circadian genes across organs.
A) Relationships between organ, oscillation amplitude and oscillation phase of circadian genes.
Upper-left quadrant: histograms of amplitudes within each organ (number of circadian genes
within each amplitude bin is shown on the horizontal axis, grouped by organ). Upper-right
quadrant: histograms of amplitudes within each phase, across all organs. Lower-right quadrant:
histograms of phases within each organ, with summary radial diagrams (number of circadian
genes within each phase bin is shown on the vertical axis, grouped by organ). Larger versions of
these radial diagrams are included in Figure 2.1C for clarity. Lower-left quadrant: Venn diagrams
of the identities of the genes that oscillated within a given pair of organs. B) Ontogenic tree
genes as the distance metric. Shared genes correspond to the overlapping regions from Venn
diagrams in panel A.
Having examined their oscillation patterns, we looked for genomic characteristics
common to rhythmically-expressed genes. Circadian genes clustered physically in the
genome (Figure 2.6A; Supplemental Methods). Their lengths tended to be longer than
non-rhythmic genes (Mann-Whitney U test p≪10-15; Figure 2.6B). This trend was
maintained at the level of 5’UTR, CDS, and 3’UTR (Figure 2.6C-E). These results are in
agreement with previous findings about oscillating liver transcripts(Wu et al. 2012). By
using gapped, junction-spanning reads to discriminate between expressed spliceforms,
we found circadian genes had more spliceforms than non-circadian genes
(Mann-Whitney U test p≪10-15; Figure 2.6F-H). Furthermore, we found that the spliceforms
expressed by circadian genes, including the identity of the dominant spliceform, tended
to differ across organs more than for non-circadian genes. These findings are consistent
with the idea that the circadian genes have more regulatory capacity than non-circadian
Figure 2.6: Genomic characteristics of circadian genes.
A) Genomic clustering of each organ’s oscillatory genes. The test-statistic used was the sum of
the squared number of oscillatory genes within a sliding nine-gene window (intergenic distance
disregarded). Significance values were derived using null distributions determined by randomly
shuffling gene positions 1-million times for each organ-chromosome pair. B) Total length of
circadian vs. non-circadian genes. Length of circadian vs. non-circadian genes across C) 5ʹUTRs,
F) detected spliceforms, G) unique sets of spliceforms expressed across organs, and H) unique,
dominant spliceforms expressed across organs. I) Number of genes having the given maximum
phase difference between any two organs. Vegfa is shown as an example.
Remarkably, 1,400 genes were phase-shifted with respect to themselves by at
least six hours between two organs, with 131 genes completely anti-phased (Figure 2.6I).
For example, at dusk, the transcript levels of Vegfa (vascular endothelial growth factor) peaked in brown fat but reached a nadir in heart. To our knowledge, such drastic
phase-discrepancies of individual genes between organs have not been reported. The
mechanisms for these phenomena are unclear, as the genes did not share any obvious
transcription-factor or miRNA-binding motifs. The core clock genes oscillated
synchronously, with the peak phases of a given gene falling within 3 hours of each other
across all organs (Figure 2.7). Several core clock genes did show 1-2 hour phase
advances and delays in skeletal muscle and cerebellum, respectively, when compared
to other organs. However, these cases were in the minority, and given the limitations in
our ability to precisely resolve small (< 2 hour) phase differences from data with a 2-hour
resolution, their significance remains unclear. This finding indicates that the anti-phased
patterns observed in genes like Vegfa are not due to phase-differences between the core clocks of each organ. Rather, these phenomena are due to additional,
organ-specific levels of timing regulation positioned between the core clock and these output
A) Expression of each gene in all organs superimposed. B) Heatmap representation of
expression from panel A.
Pathways
Given the high temporal and spatial resolution of our study, we were able to
examine ways in which time and space influenced biological pathways. We used the
Reactome(Matthews et al. 2009) database as a basis for our pathway network and
found many pathways enriched for circadian genes both within and across organs
(Figure 2.8).
Figure 2.8: Discovering oscillation influence on pathways.
Nodes represent Reactome pathways, with size corresponding to total number of genes in a
pathway and color corresponding to percent of genes with rhythmic expression at the organism
level. Edges convey pathway hierarchy. Heatmap depicts significance of pathways’ oscillatory
available as a Cytoscape file
(http://itmat.nick.s3.amazonaws.com/BHTC/circadian_oscillations_in_reactome_pathways.cys).
Several genes oscillated synchronously across all organs, like the core clock
genes. For example, Dtx4, a Notch pathway E3 ubiquitin ligase, oscillated in phase with
Arntl in all organs (Figure 2.9A). We also noted that genes with “opposite” functions (e.g., activators vs. repressors) often had opposite phases. For example, members of the
initial vascular endothelial growth factor (VEGF) signaling cascade oscillated in the heart
(Figure 2.9B). These included the primary circulating ligand, Vegfa, and its two principle membrane-bound receptors, Flt1 and Kdr. This cascade regulates angiogenesis, with critical roles in development, cancer and diabetes(Folkman 2007). At dusk, expression
of Vegfa and Kdr in the heart was low, while Flt1 was high. KDR is thought to mediate most of the known cellular responses to VEGF-signaling, while FLT1 is thought to be a
decoy receptor (Zygmunt et al. 2011). Thus, the rhythmic timing of these receptors
appears to reflect function, in that FLT1 (the decoy) is present when KDR is not and vice
Figure 2.9: Exploring pathways across biological space and time.
A) Expression of the deltex gene Dtx4 in all organs superimposed. B) Example of pathway
components’ timing reflecting function: expression profiles from the heart, for Vegfa and its two
Example of systemic pathway orchestration segregating in time and space: expression profile of
Igf1 in the liver, as compared to its downstream target Pik3 in several organs. D) Example of
widespread pathway component synchronization within the same space (organ): expression
profiles from the kidney for multiple signaling receptors that activate the PIK3-AKT-MTOR
pathway.
While members of some systemic pathways, such as the core circadian clock,
were expressed in phase across organs, many were not. For instance, expression of the
insulin-like growth factor Igf1 oscillated in the liver, peaking in the early subjective night (Figure 2.9C). Since the liver produces nearly all of the circulating IGF1(Sjögren et al.
1999), IGF-signaling throughout the entire body is likely under clock influence. IGF1 is
one of the most potent natural activators of the PIK3-AKT-MTOR pathway, which
stimulates growth, inhibits apoptosis, and has a well-known role in cancer(Franke 2008).
However, peak expression of Pik3r1, which encodes the regulatory subunit for PIK3, did not occur at the same time across all organs. Instead, there was a steady progression
throughout the night spanning nearly ten hours, as it peaked first in liver, then heart,
followed by aorta, lung, skeletal muscle, and finally in kidney (Figure 2.9C). Since the
core clocks of these organs were in phase with each other, as mentioned earlier, the
timing differences of Pik3r1 are most likely driven by some unknown, organ-specific mechanism situated between the core clock pathway and Pik3r1.
Some pathways known to function systemically were only rhythmic in a single
organ. For example, IGF1’s principal membrane-bound receptor, IGF1R, is present in
numerous organs. However, Igf1r expression oscillated only in kidney. In addition to
Erbb2, Erbb3, and Erbb4 (tyrosine kinase receptors), Tlr2 (toll-like receptor), Cd19
(antigen receptor), and Il7r (cytokine/interleukin receptor). These receptors were all notably in phase with one another, all having peak expression in the subjective mid-day.
Thus, there is kidney-specific clock regulation of PIK3-AKT-MTOR signaling, that is
distinct from and in addition to the already clock-regulated IGF1 signal coming from the
liver.
Drug targets and disease
Rank Sales Trade
name
Indications Circadian-gene targets Organs in which
targets oscillate 2 $1.46 b Nexium Gastritis, GERD,
Esophagitis Atp4a L
5 $1.28 b Advair
Diskus Asthma, Chronic obstructive pulmonary di... Serpina6, Pgr, Nr3c2, Adrb2, Pla2g4a Lu, H, L, K, S, A
11 $794 m Rituxan Rheumatoid arthritis,
Non-Hodgkin's lymp... Fcgr2b, Ms4a1, Fcgr3 L, K, S 20 $538 m Diovan Hypertension, Heart failure Slc22a6, Agtr1a, Slco1b2,
Car4, Kcnma...
H, AG, L, K, S
27 $431 m Vyvanse Attention deficit
hyperactivity disorder Adra1b L
32 $392 m Tamiflu Influenza Neu2, Neu1, Ces1g,
Slc22a8, Slc15a1, ...
Lu, L, BF, K, C
33 $383 m Ritalin Attention deficit
hyperactivity disorder Slc6a4 AG, K
37 $348 m AndroGel Hypogonadism Slc22a4, Slc22a3, Ar,
Cyp1a1, Cyp2b10...
Lu, H, BS, WF, AG...
38 $346 m Lidoderm Pain Slc22a5, Cyp2b10, Egfr,
Abcb1a Lu, H, AG, BF, L,...
44 $304 m Seroquel
XR Bipolar disorder, Major depressive disor... Htr2c, Htr1b, Htr2a, Chrm2, Drd4, Adr... Lu, H, BS, WF, AG... 45 $289 m Viagra Erectile dysfunction Cyp1a1, Pde6g, Abcc5,
Abcc10, Pde5a, ...
Lu, H, BS, WF, AG...
47 $281 m Niaspan Hyperlipidemia Slco2b1, Slc22a5, Qprt,
Slc16a1
Lu, H, BS, AG, WF...
48 $279 m Humalog Diabetes mellitus T2 Igf1r K
49 $274 m Alimta Mesothelioma, Non-small cell lung cancer
Tyms, Atic, Gart, Slc29a1 Lu, H, BS, BF, L,...
54 $267 m Combivent Asthma, Chronic
obstructive pulmonary di... Slc22a5, Slc22a4, Chrm2, Adrb1, Adrb2 Lu, H, BS, BF, K,... 56 $262 m ProAir HFA Asthma, Chronic
obstructive pulmonary di...
Adrb1, Adrb2 Lu, K, S
Abcb1a, Dpp4
66 $236 m Toprol XL Hypertension, Heart failure Slc22a2, Adrb1, Adrb2,
Abcb1a Lu, H, AG, BF, L,...
71 $220 m Vytorin Hyperlipidemia Hmgcr, Cyp2b10, Soat1,
Abcc2, Anpep, ... Lu, H, BS, AG, BF... 78 $209 m Aciphex Gastritis, GERD,
Esophagitis Cyp1a1, Atp4a, Abcg2 Lu, H, BS, WF, L,...
90 $189 m Lunesta Insomnia Ptgs1, Tspo, Gabra3 Lu, H, AG, K
98 $173 m Prilosec Gastritis, GERD,
Esophagitis Cyp1a1, Atp4a, Abcg2, Cyp1b1, Abcb1a Lu, H, BS, WF, AG... 99 $171 m Focalin XR Attention deficit
hyperactivity disorder
Slc6a4 AG, K
Table 2.1: Drugs of the top-100 best-seller list that target circadian genes and have half-life < 6h.
Rank and sales are based on USA 2013 Q1 data from Drugs.com. Abbreviations: AG (adrenal
gland), A (aorta), BF (brown fat), BS (brainstem), C (cerebellum), H (heart), Hy (hypothalamus), K
(kidney), L (liver), Lu (lung), S (skeletal muscle), WF (white fat).
Timing is an important but under-appreciated factor in drug efficacy. For example,
short half-life statins work best when taken before bedtime, as cholesterol synthesis
peaks when we sleep(Miettinen 1982). To find new opportunities for prospective
chronotherapy, we investigated which of the best-selling and commonly taken drugs
target genes with rhythmic expression (association between circadian genes and drug
targets by Pearson's Chi-square test, p<<10-15; Figure 2.10A). By ‘drug targets’, we are
referring to genes with products directly bound and functionally affected by a given drug.
Notably, 56 of the top 100 best-selling drugs in the United States, including all top 7,
target the product of a circadian gene (Dataset S1). Nearly half of these drugs have
half-lives less than 6 hours (Table 2.1), suggesting the potential impact time-of-administration
could have on their action. Most of these drugs have not been associated with circadian
rhythms and are not dosed with consideration for body time. Furthermore, 119 of the
World Health Organization’s list of essential medicines target a circadian gene, including
many of the most common and well known targets (Dataset S2). For example, Ptgs1
secondary prevention of heart attacks(Antithrombotic Trialists’ Collaboration 2002),
oscillated in the heart, lung, and kidney (Figure 2.10B). Given that aspirin has a short
half-life and that heart attacks have a circadian rhythm(Curtis & Fitzgerald 2006), dosing
aspirin at an optimal time of the day has great potential. Consistent with this observation,
clinical reports have suggested night-time administration of low dose aspirin may be
important for its cardio-protective effects(Hermida et al. 2005). Our data suggest a
mechanism for Ptgs1’s circadian regulation as well. Mir22 is a micro-RNA predicted to target PTGS1, and its host transcript oscillated anti-phase to Ptgs1 in the heart, lung, and kidney. This miRNA may therefore regulate Ptgs1 function. To test this hypothesis, we transfected mir22 mimics into NIH3T3 cells and knocked down endogenous
quantities of PTGS1 protein by ~50% (Figure 2.11). We also observed a slight,
non-significant decrease in Ptgs1 mRNA levels in these same samples. These data suggest that mir22 operates on PTGS1 predominantly at the post-transcriptional level, though it remains possible that Ptgs1 is a transcriptional target of the clock through other
Figure 2.10: Circadian disease genes and drug targets.
A) Overlap between circadian genes, known disease-associated genes, and drug targets.
Sources for disease genes and drug targets are included in the Supplemental Materials. B)
Example of a common drug having an oscillatory gene target: expression profiles for the aspirin
target Ptgs1 from heart, lung and kidney. Traces from these organs for the mir22 host gene,
predicted to target Ptgs1, are also shown. C) Number of PubMed references for circadian vs.
non-circadian genes.
A) Representative Western blot analysis of lysates from NIH3T3 cells transfected with mirNeg,
mir-22-3p, or mir-22-5p. * indicates non-specific bands. B) Densitometric quantification of PTGS1
protein expression from Western blots, normalized to GAPDH protein expression. Values are
mean intensities relative to the mirNeg condition, ± SD. C) Quantification of Ptgs1 mRNA by
qPCR from the same samples assayed in B). Expression values were normalized by Gapdh, and
presented as mean abundance relative to mirNeg condition, ± SD. n = 3 for B) and C). n.s.=not
significant; *=P<0.0001, relative to mirNeg by one-sided, homoscedastic Student’s t-test.
Beyond drug targets, circadian genes were also enriched among
disease-associated genes (Pearson’s Chi-square test, p<<10-15; Figure 2.10A), and were highly
studied in biomedical research. They received significantly more PubMed citations than
non-oscillating genes (Mann-Whitney U test, p<<10-15; Figure 2.10C). Furthermore,
oscillating genes were also associated with nearly every major disease funded by
National Institutes of Health at significantly higher rates than expected by chance (Figure
2.12). Cancer, diabetes mellitus type 2, Alzheimer’s disease, schizophrenia, Down’s
syndrome, obesity, and coronary artery disease were most strongly associated with
circadian genes. For example, many of these oscillating genes are involved in
neurodegeneration, including Fus, Tdp43, alpha synuclein, gamma synuclein, Atxn1,
Atxn2, Atxn3, Atxn7, Atxn10, Psen1, and Psen2. These genes are mutated in frontotemporal dementia, ALS, Parkinson’s disease, spinocerebellar ataxia, and
Alzheimer’s disease. They were predominantly rhythmic outside of the brain in
peripheral organs (Psen2 had nearly four-fold amplitude in liver and peaked at subjective day, when mice are going to sleep). We speculate that promoters for these genes may
have evolved sensitivity to global changes in redox state, which varies between day and
neurodegeneration are two clinical observations: many patients with
neurodegeneration-linked dementia display ‘sundowning’ (behavioral problems in the early evening), and
most patients with neurodegeneration eventually develop circadian sleep
disorders(Hastings & Goedert 2013).
Figure 2.12: Correlation between association significance of diseases with circadian genes and
Discussion
In this study we used RNA sequencing and DNA microarrays to characterize
circadian oscillations in transcript expression across twelve mouse organs. We found
that the RNA abundance of 43% of mouse protein-coding genes cycle in at least one
organ. Based on these results, we project that over half of the mouse protein-coding
genome is rhythmic somewhere in the body. This is similar to the proportion of liver
genes encoding proteins detected by mass spectrometry, that also showed
transcriptional rhythms(Mauvoisin et al. 2014). There is precedence for such large-scale
rhythms in unicellular and plant studies(Liu et al. 1995; Michael & McClung 2003), and
previous work has suggested the same may be true in the mammalian system(Ptitsyn &
Gimble 2011). We found the majority of these transcriptional rhythms are organ-specific.
This characteristic, in addition to our high sampling resolution, explains why we found
more rhythmic genes across twelve organs than previous studies (including those from
our lab) that focused on only a few organs. Furthermore, the organ-specificity of these
transcriptional rhythms indicates that while the molecular clock is active throughout the
body, it regulates biological processes quite differently in each organ. Again, this is in
agreement with existing literature(Panda et al. 2002; Storch et al. 2002).
The major exception to this finding is the set of core clock genes, as these genes
oscillated in phase across all twelve organs (Figure 2.7). This is not to say that external
cues such as restricted feeding or jet-lag cannot phase-shift these peripheral oscillators
with respect to one another(Stokkan et al. 2001; Vosko et al. 2010). Rather, this agrees
with the notion that peripheral clocks are largely synchronized in a healthy organism.
mechanisms for clock-controlled genes and these analyses are the subject of ongoing
work.
Additionally, we found a functionally diverse set of ncRNAs with rhythmic
expression. Those ncRNAs conserved between human and mouse oscillated in the
same proportion as protein-coding genes, suggesting their functional importance. While
some of these rhythmic ncRNAs have recognized functions, like snoRNA and miRNA
host genes, little is known about the majority. The oscillations of these ncRNAs may
prove advantageous for functional studies, e.g. linking a cycling miRNA to its predicted
target genes by comparing their cycles.
Recent studies have found additional layers of complexity in hepatic rhythms by
examining DNA binding patterns of core clock genes, changes in epigenetic marks, as
well as oscillations in the proteome (Koike et al. 2012; Vollmers et al. 2012; Mauvoisin et
al. 2014; Robles et al. 2014). By providing a window into every stage of the
transcriptional/translational oscillations in the liver (open chromatin, transcription factor
binding, transcription, protein accumulation), one could use these complementary
datasets to model how the interplay between DNA, RNA, and protein results in rhythmic
output in liver biology. However, these proteomic and chromatin-immunoprecipitation
assays are still quite challenging to perform, especially for organs with more limited
material than the liver. By applying the model developed in liver to our data, one could
make organism-level predictions about the rhythmic characteristics of epigenetic marks
and proteins.
The field of chronotherapeutics has appreciated the system-level effects of
circadian biology for quite some time. At its core, this field aims to understand how time
2005)), a class of drug that lowers cholesterol by inhibiting HMGCR (HMG-CoA
reductase). HMGCR is the rate-limiting enzyme in cholesterol biosynthesis and its
activity peaks during the night. Statins with short half-lives showed maximal efficacy
when taken in the evening (when their target gene was most active). Longer-acting
statins show no changes in efficacy based on the time of administration. The flexibility
offered by these latter statins may serve to increase patient compliance, and ultimately
improve their health outcomes. This is one example among many, demonstrating the
ability of chronotherapeutic practices to positively impact drug treatment.
Nevertheless, the influence of time-of-administration on the majority of
pharmaceuticals on the market today has not been extensively studied, and circadian
effects are not a routine aspect of drug efficacy and safety trials. Our data indicate that
circadian genes are highly associated with diseases, and many of the most
commonly-used medications in the world target circadian genes. Furthermore, our data indicate: a)
the majority of the top-selling drugs on the market have circadian targets, and b) a
substantial fraction have half-lives less than six hours (Dataset S3). These data allow for
prospective chronotherapeutic studies, as they indicate which drugs are sensitive to
time-of-day administration, and when and where they may do so. This is illustrated by
the example we provide in the results, where we hypothesize that circadian oscillations
in expression of the aspirin target gene, Ptgs1, are responsible for rhythms in aspirin's cardio-protective effects. More broadly, these data will be a great resource for the field,
and we invite the reader to explore this data through our web interface
Methods
Animal preparation and organ collection: Mice were prepared as previously
described(Hughes et al. 2009). Briefly, 6-week old male C57/BL6 mice were acquired
from Jackson Labs, entrained to a 12h:12h light:dark schedule for one week, then
released into constant darkness. Starting at CT18 post-release, three mice were
sacrificed in the darkness every 2h, for 48 hours. Specimens from the following organs
were quickly excised and snap-frozen in liquid nitrogen: aorta, adrenal gland, brainstem,
brown fat (anterior dorsum adipose), cerebellum, heart, hypothalamus, kidney, liver, lung,
skeletal muscle (gastrocnemius) and white fat (epididymal adipose). Food and water
were supplied ad libidum at all stages prior to sacrifice. All procedures were approved by the Institutional Animal Care and Use Committee.
Microarray data: Organ samples were homogenized in Invitrogen Trizol reagent
using a Qiagen Tissuelyser. RNA was extracted using Qiagen RNeasy columns as per
manufacturer’s protocol, then pooled from three mice for each organ and time point. The
reason for pooling was to average out both biological variance between individual
animals and technical variance between individual dissections. RNA abundances were
quantified using Affymetrix MoGene 1.0 ST arrays and normalized using Affymetrix
Expression Console software (RMA). Probesets on the Affymetrix MoGene 1.0 ST array
were cross-referenced to best-matching gene symbols using Ensembl BioMart software,
then filtered for known protein-coding status. The resulting 19,788 genes formed the
protein-coding background set.
RNA-sequencing data: RNA samples from CT22, CT28, CT34, CT40, CT46,
CT52, CT58, and CT64 were pooled for each organ, as described above (96 total pools).