3D-QSAR CoMFA study of some heteroarylpyrroles as possible anticandida agents
5
0
0
Full text
(2) www.ijpsonline.com. In the CoMFA method, introduced by Crammer8,9, a relationship is established between the biological activities of a set of compounds and their steric and electrostatic properties. An advantage of CoMFA is its ability to predict the biological activity of molecules and represent the relationship between steric and electrostatic properties and biological activity in the form of contour maps 10. An ‘active conformation’ of the ligands is generated and superimposed as per the predefined rules. These molecules are then placed in a box of predefined grid size. The steric and electrostatic interaction energy between each structure and a probe atom of deÞned size and charge are calculated at each grid point using the molecular mechanics force Þelds. A multivariate data analysis technique like partial least squares (PLS)11-13 is used to derive a linear equation from the resulting matrices. PLS is used in combination with cross validation to obtain the optimum number of components. This ensures that the QSAR models are selected on their ability to predict the data rather than to Þt the data. The advantages of CoMFA studies are in the ability to predict the target properties of the compounds and to graphically present the QSAR in the form of coefÞcient contour maps14. We present here 3D-QSAR studies using CoMFA method on a series of 3-aryl-4-[α-(1H-imidazol-1-yl) aryl methyl] pyrroles and the contour maps derived reveal the significance of steric and electrostatic fields. The structural variations in the molecular fields at particular regions in the space provide underlying structural requirements and 3D-QSAR models generated give good predictive ability and aid in the design of potent anticandida agents.. MATERIALS AND METHODS Biological activity data: The antifungal activity data against Candida albicans for a series of 3-aryl-4-[α-(1H-imidazol-1-yl) aryl methyl] pyrroles containing 40 compounds as anticandida agents was used in this analysis. General structure of the compounds is shown in (fig. 1). Training set was formed by selecting 33 compounds from the original series. Test set compounds were no. 11, 12, 33, 34, 35, 37 and 42 (total 7 compounds), selected randomly. These compounds were not included in the analysis to generate the CoMFA model. The robustness and predictive ability of models were evaluated by selecting biological activity with chemical March - April 2008. N R1. N. R2 R6 R5. R4 N H. R3. Fig. 1: Heteroaryl pyrroles used for CoMFA study. General structure of compounds used for CoMFA study. Rotatable bonds selected for conformational analysis are shown in bold face.. class similar to training set. CoMFA techniques were used to derive 3D-QSAR models for 3-aryl-4-[α-(1Himidazol-1-yl)aryl methyl)pyrroles. The MIC data were used for the QSAR analysis as a dependent parameter, after converting to the reciprocal of the logarithm of MIC (pMIC) expressed in µM/ml (Table 1). Molecular modeling: A database of 33 compounds forming the training set was generated by molecular modeling. All molecular modeling and 3D-QSAR studies were performed using SYBYL 6.7 15 with TRIPOS Force Field 16 on a Silicon Graphics O 2 workstation with IRIX operating system. The crystallographic data for these ligand complexes was not available hence all the molecules were constructed using a grid having a spacing of 1.54 A 0 between grid points. This is the default spacing, which represents sp 3 carboncarbon bond length. The molecules were cleaned up and quick minimized after sketching. Because no experimental data on the biologically relevant conformations of the selected compounds were available (for example, atomic coordinates derived from X-ray crystallographic studies of their complexes with the putative receptor), we resorted to a general molecular mechanics approach (AM1) to build the conformational models to be used for generation of CoMFA models. A chirality check was performed to identify chiral atoms, after adding hydrogens, it was important to consider all possible enantiomers as the activity was reported for racemic mixtures. Then the molecules were subjected for energy minimization (geometry optimization) at a gradient of 1.0 kcal/mol with delta energy change of 0.001 kcal/mol with the TRIPOS standard force Þeld. Structures were drawn by using default setting of SYBYL. After conformational analysis (CA) by adopting AM1 Hamiltonian approach, the least energy conformation was selected, saved, and used for the. Indian Journal of Pharmaceutical Sciences. 155.
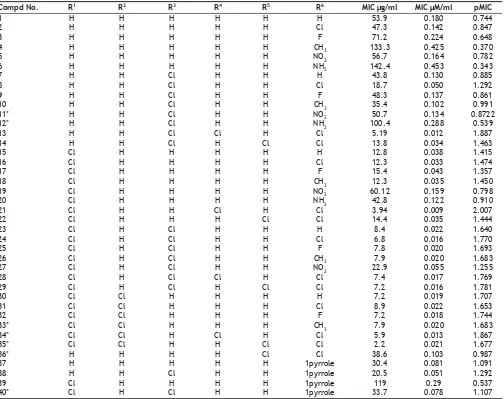
(3) www.ijpsonline.com. TABLE 1: EXPERIMENTAL ACTIVITIES OF MOLECULES USED IN TRAINING SET AND TEST SET Compd No. 1 2 3 4 5 6 7 8 9 10 11* 12* 13 14 15 16 17 18 19 20 21 22 23 24 25 26 27 28 29 30 31 32 33* 34* 35* 36* 37 38 39 40*. R1 H H H H H H H H H H H H H H Cl Cl Cl Cl Cl Cl Cl Cl Cl Cl Cl Cl Cl Cl Cl Cl Cl Cl Cl Cl Cl H H H Cl Cl. R2 H H H H H H H H H H H H H H H H H H H H H H H H H H H H H Cl Cl Cl Cl Cl Cl H H H H H. R3 H H H H H H Cl Cl Cl Cl Cl Cl Cl Cl H H H H H H H H Cl Cl Cl Cl Cl Cl Cl H H H H H H H H Cl H Cl. R4 H H H H H H H H H H H H Cl H H H H H H H Cl H H H H H H Cl H H H H H Cl H H H H H H. R5 H H H H H H H H H H H H H Cl H H H H H H H Cl H H H H H H Cl H H H H H Cl Cl H H H H. R6 H Cl F CH3 NO2 NH2 H Cl F CH3 NO2 NH2 Cl Cl H Cl F CH3 NO2 NH2 Cl Cl H Cl F CH3 NO2 Cl Cl H Cl F CH3 Cl Cl Cl 1pyrrole 1pyrrole 1pyrrole 1pyrrole. MIC µg/ml 53.9 47.3 71.2 133.3 56.7 142.4 43.8 18.7 48.3 35.4 50.7 100.4 5.19 13.8 12.8 12.3 15.4 12.3 60.12 42.8 3.94 14.4 8.4 6.8 7.8 7.9 22.9 7.4 7.2 7.2 8.9 7.2 7.9 5.9 2.2 38.6 30.4 20.5 119 33.7. MIC µM/ml 0.180 0.142 0.224 0.425 0.164 0.453 0.130 0.050 0.137 0.102 0.134 0.288 0.012 0.034 0.038 0.033 0.043 0.035 0.159 0.122 0.009 0.035 0.022 0.016 0.020 0.020 0.055 0.017 0.016 0.019 0.022 0.018 0.020 0.013 0.021 0.103 0.081 0.051 0.29 0.078. pMIC 0.744 0.847 0.648 0.370 0.782 0.343 0.885 1.292 0.861 0.991 0.8722 0.539 1.887 1.463 1.415 1.474 1.357 1.450 0.798 0.910 2.007 1.444 1.640 1.770 1.693 1.683 1.255 1.769 1.781 1.707 1.653 1.744 1.683 1.867 1.677 0.987 1.091 1.292 0.537 1.107. *Compounds used in test set. charge calculation, assuming that it was the active one. We have used two different types of charges, calculated using the Gasteiger-Marsili method and the semi-empirical MOPAC method17. Partial Least Squares analysis (PLS): The PLS analyses were done by following standard protocols 18. In order to speed up the analysis and reduce the amount of noise, column Þlter was used by excluding the columns with a variance smaller than 2.0. Equal weights for the steric and electrostatic descriptors were assigned using the CoMFA scaling option. CoMFA Results: Two CoMFA models were generated by using different types of partial atomic charges, results of which are shown in Table 2. Model A was derived using charges calculated according to Gasteiger-Marsili method, 156. while Model B was obtained using MOPAC charges. From the results it can be observed that both the models are significant in term of their statistical acceptance, however model B was considered to be better due to higher correlation coefficient and Fischer’s statistical value. Prediction of Activity: The 3-D QSAR analysis obtained as Model B was used for predicting the activity of the 33 compounds in the training set. The results are shown in Table 3. From the table, it can be seen that the predicted activities are very close to the experimental activities with minimum residual activity. CoMFA contour maps: The QSAR produced by CoMFA were represented as a 3-D coefficient contour map. To visualize. Indian Journal of Pharmaceutical Sciences. March - April 2008.
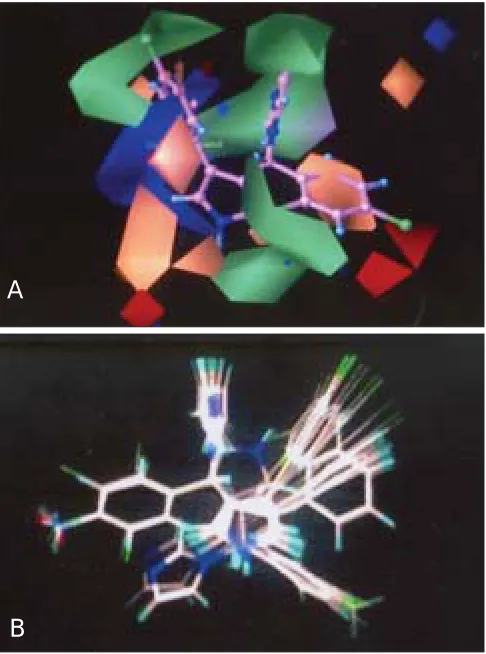
(4) www.ijpsonline.com. TABLE 2: SUMMARY OF COMFA RESULTS R2cv SEP r2 conventional S.E. Nopt F value P value Steric contribution Electrostatic contribution r2BS SDBS. Model A 0.561 0.381 0.886 0.194 4 58.344 0.000 0.418 0.582 0.925±0.019 0.051±0.017. Model B 0.598 0.377 0.964 0.112 6 126.195 0.000 0.428 0.572 0.986±0.005 0.046±0.007. Where r2CV is cross-validated r2, Nopt is optimum number of components, SEP is standard error of prediction,R2 convention is noncross-validated r2, SE is standard error of estimate, r2BS is from 100 bootstrapping runs, F Value is Fischer static value, P Value is probability of r2=0 and SDBS is standard deviation bootstrapping. A. the CoMFA steric and electrostatic fields from PLS analysis, contour maps of the product of the standard deviation associated with CoMFA column and coefficient (SD Coeff) at each lattice point were generated. The contour maps were plotted as percentage contribution to the QSAR equation and were associated with difference in biological activity. TABLE 3: PREDICTED AND EXPERIMENTAL ACTIVITIES OF TRAINING SET Compd. No. 1 2 3 4 5 6 7 8 9 10 13 14 15 16 17 18 19 20 21 22 23 24 25 26 27 28 29 30 31 32 37 38 39. pMIC experimental. pMIC predicted. 0.74 0.84 0.64 0.37 0.78 0.34 0.88 1.29 0.86 0.99 1.88 1.46 1.41 1.47 1.35 1.45 0.79 0.91 2.00 1.44 1.64 1.77 1.69 1.68 1.25 1.76 1.78 1.70 1.65 1.74 1.09 1.29 0.53. 0.72 0.77 0.65 0.38 0.81 0.32 1.03 1.22 0.90 0.82 1.87 1.59 1.55 1.38 1.32 1.25 0.87 1.07 1.97 1.37 1.70 1.69 1.67 1.78 1.28 1.77 1.77 1.68 1.69 1.72 1.13 1.19 0.64. Residual activity* 0.02 0.07 0.07 -0.01 -0.03 0.02 0.15 0.06 -0.04 0.16 -0.01 -0.13 -0.13 0.08 0.03 0.19 -0.07 -0.16 0.03 0.07 -0.06 0.09 0.01 -0.10 -0.03 -0.01 0.01 0.02 -0.04 0.02 -0.04 0.01 -0.11. *Residual activity is the difference in predicted activity and experimental activity. March - April 2008. B Fig. 2: CoMFA steric and electrostatic contours Þeld plot. Green contours in mesh view indicate regions where bulky groups increase activity, whereas yellow contours indicate regions where bulky groups decrease activity. Blue contours indicate where positive electrostatic groups increase activity, whereas red contours indicate where negative electrostatic groups increase activity. Compound 1 from training set is shown in Þg. 2A and database alignment of 33 molecules of training set is shown in Þg. 2B.. The CoMFA contour maps generated for model B were used to explain the structure activity relationship of antifungal drugs. In CoMFA contour maps, the regions of high and low steric tolerance are shown in green and yellow polyhedra, respectively. CoMFA electrostatic field are shown as blue and red polyhedra in Þg. 2. A low electron density within the inhibitors near blue and red polyhedra, respectively increase or decrease the activity.. RESULTS AND DISCUSSION The validity of Model B was further enhanced by bootstrapping process. Bootstrapping of 10 runs gave r2 of 0.986±0.005 with a very low standard error of 0.046±0.007 which added to the high conÞdence limit to this analysis. It can be seen that, both steric and. Indian Journal of Pharmaceutical Sciences. 157.
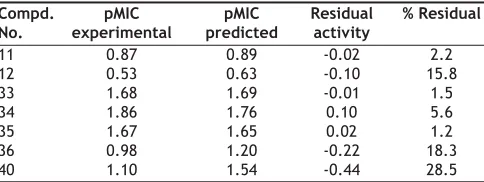
(5) www.ijpsonline.com. Technical Education (AICTE), New Delhi for Þnancial support through MODROBS scheme.. TABLE 4: COMPARATIVE VARIATION IN THE EXPERIMENTAL AND PREDICTED ANTICANDIDA ACTIVITY OF COMPOUNDS IN TEST SET Compd. No. 11 12 33 34 35 36 40. pMIC experimental 0.87 0.53 1.68 1.86 1.67 0.98 1.10. pMIC predicted 0.89 0.63 1.69 1.76 1.65 1.20 1.54. Residual activity -0.02 -0.10 -0.01 0.10 0.02 -0.22 -0.44. % Residual 2.2 15.8 1.5 5.6 1.2 18.3 28.5. The data indicates the difference in predicted and experimental activities of compounds used in test set along with percentage residual activities. Predicted activities were obtained by using Model B. electrostatic Þelds contributed to the QSAR equation by 42.8 and 57.2%, respectively. This suggested that variation in the antifungal activity is predominantly determined by electrostatic properties. Thus the results suggested that there is a good internal consistency in the data set generated in model B. Model B performed exceptionally well in predicting the activity of most compound used in the test set. However, it must be emphasized that molecular alignment and conformations used in this study were selected in the absence of X-ray crystallographic coordinates of these molecules; still, the CoMFA model generated in the study showed very good prediction capability. From the Table 4, it can be observed that the predictions made using CoMFA model were satisfactory in most cases. In general, the percentage difference in the predicted activity of the synthesized compound ranges from 1.2 to 28.5%. The relative difference in the prediction is not unexpected and is within the acceptable limits. From these results, it is inferred that the 3-D QSAR model generated in this study has a potential to predict the activity of diverse compounds belonging to similar structural class. The investigations concerning the design of new chemical entities based on the proposed CoMFA models, predicting their antifungal activity prior to the synthesis would be part of our forthcoming communication.. ACKNOWLEDGEMENTS. REFERENCES 1. 2. 3. 4. 5. 6. 7.. 8. 9. 10. 11. 12. 13.. 14. 15. 16. 17. 18.. Diamond RD. The growing problem of mycoses in patients infected with the human immunodeficiency virus. Rev Infect Dis 1991;3:480-6. Georgopapadakou NH, Walsh TJ. Human mycoses: Drugs and targets for emerging pathogens. Science 1994;15:371-3. Beck-Sague CM, Jarvis WR. Secular trends in the epidemiology of nosocomial fungal infections in the United States, 1980-1990. J Inf Dis 1993;167:1247-51. Koltin Y. Targets for antifungal drug discovery. Annu Rep Med Chem 1990;25:141-8. Gokhale VM, Kulkarni VM. Understanding the Antifungal Activity of Terbinafine Analogues Using Quantitative Structure-Activity Relationship (QSAR) Models. Bioorg Med Chem 2000;8:2487-99. Karki RG, Kulkarni VM. Three-dimensional Quantitative StructureActivity Relationship (3D-QSAR) of 3-Aryloxazolidin-2-one Antibacterials. Bioorg Med Chem 2001;9:3153-60. Artico M, Santo RD, Costi R, Massa S, Retico A, Artico M, et al. Antifungal Agents. 3-Aryl-4-[a-1(H -imidazol-l-yl)arylmethyl]pyrroles:A New Class of Potent Anticandida Agents. J Med Chem 1995;38:422333. Cramer RD, Patterson DE, Bunce JD. Comparative molecular field analysis (CoMFA): Effect of shape on binding of steroids to carrier proteins. J Am Chem Soc 1988;110:5959-67. Clark M, Cramer RD 3rd, Jones DM, Patterson DE, Simeroth PE. Comparative molecular Þeld analysis (CoMFA) Toward its use with 3D structural databases. Tetrahedron Comput Met 1990;3:47-59. Bhongade BA, Gadad AK. 3D-QSAR CoMFA/CoMSIA studies on Urokinase plasminogen activator (uPA) inhibitors: A strategic design in novel anticancer agents. Bioorg Med Chem 2004;12:2797-805. Wold S, Ruhe A, Wold H, Dunn III. The collinearity problem in linear regression: The partial least square approach to generalized inverse. J Sci Stat Comput 1984;5:735-43. Cramer RD, Bunce JD, Patterson DE, Crossvalidation, Bootstrapping, and Partial Least Squares Compared with Multiple Regression in Conventional QSAR Studies. Quant Str Act Relat 1988;7:18-25. Wold S, Albano C, Dunn WJ, Edlund U, Esbensen K, Geladi P, et al. Multivariate data analysis in chemistry. In: Kowalski BR, editor. Chemometrics - Mathematics and Statistics in Chemistry, Reidel, Dordrecht; 1984. p. 17-95. Puntambekar D, Giridhar R, Yadav MR. 3D-QSAR studies of farnesyltransferase inhibitors: A comparative molecular Þeld analysis approach. Bioorg Med Chem Lett 2006;16:1821-7. Sybyl 6.7, Tripos Associates, 1699 South Hanley Road, St. Louis, USA, MO 63144. Matthew C, Cramer RD, Opdenbosch NV. Validation of the general purpose tripos 5.2 force Þeld. J Comput Chem 1989;10:982-1012. Gasteiger J, Marsili M. Iterative partial equalization of orbital electronegativity-a rapid access to atomic charges. Tetrahedron 1980;36:3219-28. Geladi P, Notes on the history and nature of partial least squares (PLS) modeling. J Chemom 1988;2:231-46.. The authors wish to thank His Holiness Jagadguru Sri Sri Shivarathri Deshikendra Mahaswamigalavaru of Suttur Mutt, Mysore, for providing the facilities to carry out the research work and All India Council of. 158. Indian Journal of Pharmaceutical Sciences. Accepted 1 March 2008 Revised 14 January 2008 Received 11 December 2006 Indian J. Pharm. Sci., 2008, 70 (2): 154-158. March - April 2008.
(6)
Figure

Related documents
APACHE: Acute physiology and chronic health evaluation; ARDS: Acute respiratory distress syndrome; BMI: Body mass index; CI: confidence interval; CRP: C-reactive protein;
Samples of SELEX buffer plus 10% serum were spiked with three azole-class drugs: posaconazole (POS), itraconazole (ITRA), and isavuconazole (ISV).. The assay showed higher
are recycled concrete aggregates, Reclaimed asphalt pavement, mine wastes, scrap tires, plastic wastes, foundry sand, recycled crushed glass, coal combustion product
But the question is what is the influence of performing optical filtering in the single mode fibers?The answer to this question is that use of optical filtering
radioactive particle tracking facility to study solids motion in fluidized beds.
Descriptive statistics method was used to determine the prospective teachers’ views of their in-class behaviours fostering their creativity and to determine their perceptions of
trempage des fruits dans une solution contenant l’hydroxyde, l’oxyde ou le silicate de calcium après la récolte. Selmaoui (1999) a signalé que ces produits ont pu
Ifwe assume that infants with symmetric disease would have had the same out- come in both eyes without treatment, the prelim- mary cryotherapy data indicate that half of the
