Routing Problem In Transportation Of Milk In A
Diary-A Case Study
Sreelekshmi R, Sathidevi.C, Ushakumari P V
Abstract: In this study our attempt is to optimize transportation route for a public sector milk dairy in Kerala. Our aim is to find the minimized route of transportation of milk from the main depot to various delivery locations, minimized transportation charges. The maximized annual profit of the diary is also calculated. The data collection was done in milma milk dairy situated in Punnapra, Alappuzha district, Kerala. We collected the data regarding distance, cost and the time taken by the vehicles to each delivery stations from the depot. The optimization of routes was done using different algorithms such as traveling salesman algorithm, branch and bound technique etc. After comparing the current route and optimized route we made the new optimized route structure. Through this study we found that, if the firm follows the new optimized route, the cost of transportation can be minimized.
Index Terms: Transportation problem, Travelling Salesman problem, Branch and Bound method, Optimized route, Spanning Tree, Hungarian Principle, Delivery locations.
—————————— ——————————
1
INTRODUCTION
Transportation problem is a special type of linear programing problem which deals with the minimization of cost of transportation of any product from a number of origins to a number of destinations. The study was completed in a milma dairy situated in Alappuzha district in Kerala state. The central product dairy is the main dairy under the immediate control of Kerala Co-operative Milk Marketing Federation (K.C.M.M.F) [1] limited. The present capacity of milk in the dairy is 1, 00,000 liters/day. This firm creates wide variety of items such as curd, ghee, flavored milk, mango refresh in tetra pack etc. The major mode of transportation of milk is by road. The dairy comprises of many delivery locations in order to distribute their products in the best quality in any remote corner of the district. In the initial step of the work, we collected the details of the existing route tracked by the depot, the cost of transportation and the time taken to reach each delivery locations. Then depending on this data, matrix showing the distances, route diagrams and the present cost of transportation is calculated. We consider the case of transportation of milk from a diary in Kerala situate at Alappuzha district and the minimum distance, minimum cost of transportation of milk to different destinations are calculated. To find the optimized route of transportation, we use the tools such as travelling salesman algorithm, and the technique of branch and bound. We have done a comparative study on the existing route and the new optimized route. The annual profit earned by the depot is also calculated.
2
SCOPE
OF
THE
STUDY
1. To optimize the route of transportation of milk from the main depot to different delivery locations. 2. To find the optimized cost of transportation and
compare with the present cost.
3. To find minimum time required to reach each delivery location based on the optimized route and to check whether milk can be delivered without damage.
3 DATA COLLECTION
Data collection is the systematic way of gathering information about a particular area of interest from different sources. A person can collect the required information by different tools like field visit, questionnaire preparation etc. We collected the data from the milk diary by field visit. We have visited the milma diary at Alappuzha to collect the details of transportation of milk from the depot to various delivery locations. To get the information expected to shape the course structure, the data collection was separated into various sections. In the first stage, details of various circulation areas of milk are collected. This segment looked to give data about various courses on the present transportation configuration, to assemble all data about the number of vehicles utilized in each route and their most extreme conveying capacity. The second segment manages to make a course format of all the transportation routes. This segment was in charge of deciding roads, routes and the various areas of the present plan on the geographic guide and furthermore to discover the separations between the appropriate areas secured by every vehicle with in a course and to outline the transportation network. The third stage manages social event insights concerning transportation. In this part, information‘s including diverse delivery locations, different courses of delivery, distance travelled and number of vehicles used for transportations is collected. Expenses of transportation includes the vehicle rent, renting methods, and normal costs on each course. After the collection of major data with respect to the parameters obtained about each route, it was then represented in a tabular form to get the comparison of each route easily. The conclusion comprises of optimized cost, time, distance and the annual profit achieved by the firm. The GPS system is also used to get the route followed by the firm and to measure the distance between each node. ___________________________________
• Sreelekshmi R is currently pursuing masters degree program in Mathematics in Amrita Vishwa Vidyapeetham, Amritapuri Campus, Kollam, Kerala, India PH-04762801280. E-mail: [email protected]
• Sathidevi.C, Department of Mathematics, Amrita Vishwa Vidyapeetham, Amritapuri Campus, Kollam, Kerala, India, PH-04762801504. E-mail: [email protected]
• Ushakumari P V Department of Mathematics, Amrita Vishwa Vidyapeetham, Amritapuri Campus, Kollam, Kerala, India, PH-04762801504. E-mail: [email protected]
An outline of cost of transportation of milk from the origin to different destinations followed by the firm is calculated.
4
WORKING
PROCEDURE
In this section distance matrices were prepared by using the collected data, and the current route has been optimized by different methods.
4.1 DISTANCE Matrix
It is important to find the shortest distance connecting the depot and all the delivery locations in order to minimize the path from every single location. The distance matrix was prepared by using the data given by the depot and GPS system is used also to find the shortest possible routes from the depot to different delivery locations. The distance matrix is shown in Table 4.1, 4.2 and 4.3.
4.2 Optimized Route
Route optimization is done using different techniques such as branch and bound and traveling salesman method. The optimized route is shown in Table 4.5
4.3 Comparing the Designs
After finding each optimized route by both the techniques, a comparative study on the current route and optimized route is made from each origin to its delivery locations.
4.4 Methodology Adopted
4.4.1 Branch and Bound Technique
A branch and bound algorithm consists of a systematic enumeration of candidate solutions by means of state space and the set of candidate solutions is thought of as forming a rooted tree with the full set as the root. In this algorithm we find the bounds for the cost function and the solution set is expressed as branches of trees. Before enumerating the candidate solutions of a branch, the branch is checked against upper and lower estimated bounds on the optimal solution, and is discarded if it cannot produce a better solution than the best one found so far by the algorithm. The branch and bound algorithm works on the bounding principle of optimization. In this method, the search procedure depicts a tree structure and the solutions obtained after each step is represented in the form of branches of tree. We need to find the solution or root which minimizes the distance from the starting node to the last destination.
4.4.2 Traveling Salesman Problem
The traveling salesman problem (TSP) is an algorithmic approach for finding the shortest route between a set of points and locations that must be visited by a person. In the problem statement, the points or nodes are the cities that a salesperson might visit exactly once and come back to the starting node. The salesman‗s goal is to keep both the travel costs and the distance travelled as minimum as possible. The Hungarian principle is used to find the optimized route followed by the salesperson, to minimize the distance travelled by him.
TABLE 4.6
COMPARISON OF DISTANCE USING TRAVELING SALESMAN AND BRANCH AND BOUND METHOD
As per the comparison between the two methods, we found that the travelling salesman method is more efficient in finding the minimum distance for every delivery locations. Therefore we have chosen the distance obtained by TSP and expenses are calculated using this distance. . The total distance covered by the milk carrier for each route is calculated and a comparison of the distance between current route and the optimized route is shown in Table 4.7
TABLE 4.7
COMPARISON OF DISTANCE BETWEEN CURRENT ROUTE AND OPTIMIZED ROUTE
The table showing the optimized distances and expenses are prepared and is tabulated The transportation expenses from depot to each route is calculated and the comparison of the current expenses and the optimized expense is displayed in Table 4.8
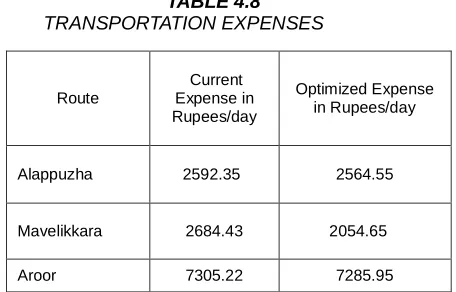
TABLE 4.8
TRANSPORTATION EXPENSES
As explained in 4.1 the details of the data collected from the depot to each delivery locations are displayed in the following tables.
. Route
Traveling salesman method (Distance in
Km)
Branch and bound (Distance in Km)
Alappuzha 36.9 37.6
Mavelikkara 51.2 58.3
Aroor 113.4 114.4
Route Current route Optimized route
Alappuzha 37.3 36.9
Mavelikkara 64.9 51.2
Aroor 113.7 113.4
Route Current Expense in Rupees/day Optimized Expense in Rupees/day
Alappuzha 2592.35 2564.55
Mavelikkara 2684.43 2054.65
TABLE 4.1
DISTANCE MATRIX OF ALAPPUZHA TOWN
TABLE 4.2
DISTANCE MATRIX OF MAVELIKKARA
TABLE 4.3
DISTANCE MATRIX OF AROOR
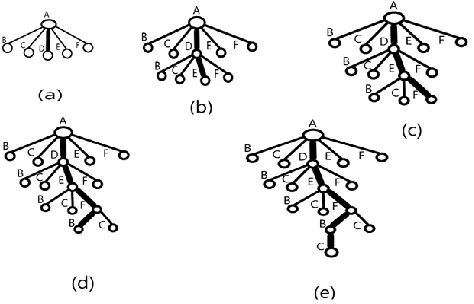
We have applied both travelling salesman and branch and bound techniques for all the routes of transportation and a comparison is done on both the techniques. The steps involved in branch and bound algorithm for the transportation of milk from Alappuzha route is displayed below as spanning trees. In this paper we are showing
transportation route from the depot Punnapra to distinct delivery locations as node. Node A denotes Punnapra depot and the destinations like Ambalapuzha, Purakkad, Paravur, Kaithavana, and Boatjetty are represented as nodes B, C, D, E and F respectively. Locating the starting node, the distance to other nodes are compared and the node
Location Depot Ambalapuzha Purakkad Paravur Kaithavana Boat jetty
Depot 0 7.2 10 2.8 5.5 7.3
Ambalapuzha 7.2 0 2.8 10 13 15
Purakkad 10 2.8 0 13 15 18
Paravur 2.8 10 13 0 15 18
Kaithavana 5.7 13 16 3.3 0 2.8
Boat jetty 7.3 15 17 4.9 2.5 0
Location Depot Vandanam Purakkad Karuvatta Thottapally Danapady Manarasala
Depot 0 2.7 10 21 15 24 24
Vandanam 2.8 0 7.7 18 12 22 22
Purakkad 10 8 0 11 4.8 14 14
Karuvatta 21 19 11 0 6.5 4 4
Thottapally 15 13 4.8 6.5 0 9.7 9.9
Danapady 24 22 14 4 9.8 0 1.1
Manarasala 23 21.8 14 4 9.7 1.1 0
Location Depot Chudukad Collectorate Pathirapally Kalavur SL puram Cherthala Kandamangalam
Depot 0 4.2 6.6 12 16 23 30 36
Chudukad 4.2 0 2.4 7.8 11.8 18.8 25.8 31.8
Collectorate 6.6 2.4 0 5.4 9.4 16.4 23.8 29.8
Pathirapally 12 7.8 5.4 0 4 11 18 24
Kalavur 16 11.8 9.4 4 0 7 14 20
SL puram 23 18.8 16.4 11 7 0 7 13
Cherthala 30 25.8 23.4 18 14 7 0 6
corresponding to the minimum distance from the starting node is calculated. This node becomes the key node to search for the other mum routes and comparing the distances, the next node with minimum distance is found out. A spanning tree corresponding to each step is drawn. This process is repeated till we get the minimum distance from the starting node to the end node so that the vehicle goes to each locations once. The minimum spanning tree showing the complete algorithm of one delivery route is displayed in Fig.1. The bold line in each picture represents the nodes connecting minimum distance from the depot to the next destinations.
Fig.1(a) shows the route from Punnapra depot to Paravur, Fig.1(b) shows the route from Punnapra depot to Paravur and then Paravur to Kaithavana, Fig.1(c) shows the route from Punnapra depot to Paravur Paravur to Kaithavana and then to Boatjetty, Fig.1(d) shows the route from Punnapra depot to Paravur , Paravur to Kaithavana , Kaithavana to Boat jetty, and then Boatjetty to Ambalappuzha Fig.1(e) shows the route from Punnapra depot to Paravur , Paravur to Kaithavana, Kaithavana to Boat jetty, Boat jetty to Ambalappuzha and then Ambalappuzha to Purakkadu. Hence the bold line in Fig (e) shows the optimized route from Punnapra depot to Purakkadu. Hence the bold line in Fig (e) shows the optimized route from Punnapra depot to Purakkadu, by delivering milk to each locations with an optimized distance of 36.9km. In a similar way the spanning trees of other routes are also drawn. The optimized route from each origin to different destinations is determined by comparing the distance obtained by both the algorithm.
TABLE 4.4
SUMMARY OF CURRENT ROUTE
route Node to note
Distance from node to node
Total distance
Time to delivery in min
Cost per km Total cost per day
Alappuzha town Depot- Ambalapuzha 7.8km
37.3km 12
69.5
2592.35
Ambalapuzha-Purakkad 3.4km 5
Purakkad-Paravur 13km 17
Paravur-Kaithavana 2.9km 7
kaithavana-boat jetty 3km 10
boat jetty-depot 7.3km 12
Mavelikara Depot-Vandanam 2.7
64.9km
10
40.13 2684.43
Vandanam-Purakkad 7.7 25
Purakkad-Karuvatta 10km 30
Karuvatta-Thottapally 6.5km 18
Thottapally-Danapady 10km 31
Danapady-Manarasala 3km 14
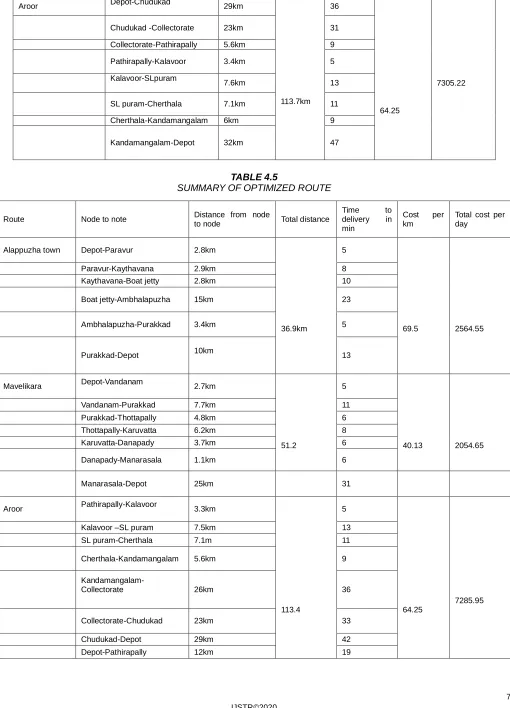
TABLE 4.5
SUMMARY OF OPTIMIZED ROUTE
Aroor Depot-Chudukad 29km
113.7km 36
64.25
7305.22
Chudukad -Collectorate 23km 31
Collectorate-Pathirapally 5.6km 9
Pathirapally-Kalavoor 3.4km 5
Kalavoor-SLpuram
7.6km 13
SL puram-Cherthala 7.1km 11
Cherthala-Kandamangalam 6km 9
Kandamangalam-Depot 32km 47
Route Node to note Distance from node
to node Total distance
Time to delivery in min
Cost per km
Total cost per day
Alappuzha town Depot-Paravur 2.8km
36.9km
5
69.5 2564.55
Paravur-Kaythavana 2.9km 8
Kaythavana-Boat jetty 2.8km 10
Boat jetty-Ambhalapuzha 15km 23
Ambhalapuzha-Purakkad 3.4km 5
Purakkad-Depot 10km 13
Mavelikara Depot-Vandanam 2.7km
51.2
5
40.13 2054.65
Vandanam-Purakkad 7.7km 11
Purakkad-Thottapally 4.8km 6
Thottapally-Karuvatta 6.2km 8
Karuvatta-Danapady 3.7km 6
Danapady-Manarasala 1.1km 6
Manarasala-Depot 25km 31
Aroor Pathirapally-Kalavoor 3.3km
113.4
5
64.25
7285.95
Kalavoor –SL puram 7.5km 13
SL puram-Cherthala 7.1m 11
Cherthala-Kandamangalam 5.6km 9
Kandamangalam-Collectorate 26km 36
Collectorate-Chudukad 23km 33
Chudukad-Depot 29km 42
5
RESULT
AND
DISCUSSION
The different path of milk distribution used by the dairy has been optimized to a minimum distance using techniques like traveling salesman problem and branch and bound algorithm. The Comparison between current route and optimized route is shown in table 4.9.
TABLE 4.9
DISTANCE COVERED IN CURRENT ROUTE AND OPTIMIZED ROUTE
Route Current route Optimized route
Alappuzha 37.3 36.9
Aroor 113.7 113.4
Mavelikkara 64.9 51.2
As the distance decreases the transportation cost also decreases
There is a slight variation in the distance covered in the current route and the optimized route. The graph depicting the comparison of the distance covered in the current route and the optimized route is shown in Fig.2
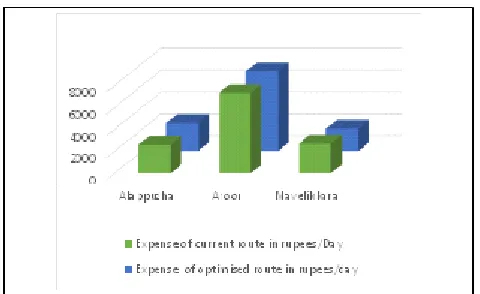
The comparison of cost of transportation for each route is given below:
TABLE 4.10
EXPENSES OF CURRENT ROUTE AND OPTIMIZED ROUTE
The graph showing the comparison of the expense of transportation of milk in the current route and the optimized route is shown in Fig.3
In this paper by considering three major delivery locations, the cost of transportation of the current route and the optimized route per annum is calculated. Also the profit earned per annum by the diary was considered. The total annual expense of the diary according to their present route is Rs. 12,582/- and the total annual expense according to the optimized route is Rs.11905/-. The firm receives a profit of Rs.677/- per day. The annual profit earned by the firm is calculated and have seen that, if the firm follows the optimized route, they will get an annual profit of Rs. 2,47,105/-. As the paper gave concentration on the minimization of the transportation cost on each route and the minimization of the distance it gave less focus on the time of delivery so that the time of delivery has affected a little bit on some of the nodes. The pasteurized milk can be kept undamaged in the room temperature up to four hours if unopened, we could ascertain that by following the optimized route, the milk can be supplied undamaged.
6
CONCLUSION
The paper was successfully completed by designing an optimized route for the milma dairy in Alappuzha. Following the optimization algorithms, we could find that by optimizing the route, the transportation cost could be minimized. Since the route structure is modified, there has been a slight increase in the time of delivery but we can easily manage the time difference by starting little earlier than before. As the pasteurized milk will not be decayed up to 4 hours under normal room temperature, the increase in time will not affect the quality of the milk. As none of the depot have the time of delivery of milk greater than 4hours, we can strongly suggest that if they follow the optimized route, milk can be supplied undamaged in all delivery locations.
REFERENCES
[1]. Clement Tom Scaria and Jenson Joseph E. ―Optimization of transportation route for a milk dairy‖, International Journal of Engineering Research & Technology, vol. 3, issue 11, pp. 854-859, 2014.
[2]. Shivashanker Singh Patel, Rajeev Pandey and Harekrishna Misra. ―An optimization model for a dairy co-operative for promoting sustainable operations for milk collection‖, pp. 1-15, 2019. Route
Expense of current
route in
rupees/Day
Expense of optimized route in rupees/day
Alappuzha 2592.35 2564.55
Aroor 7305.22 7285.95
[3]. Purushottam Govardhan Bung and Shashidhar Gurushantanapa Chiniwar. ―A study of competitive marketing environment of milk and milk products in Belgaum city‖, vol.2, issue 04, pp. 179-183, 2016. [4]. G Srinivasan. ―Operations Research Principle and
Applications‖, Prentice Hall of India Pvt.Ltd, 2007. [5]. Kanthi Swarup, P.K Gupta and Man Mohan.
―Operations Research‖, Sultan Chand & Sons, 2012.
[6]. Vishnu Manoj, Sarika S G, Raji P and Lincy Thomson ―An analysis of dropout students in education system of Kerala‖, International conference on Physics and Photonics Processes in Nano Sciences, vol. 1362, pp., 2019.
[7]. Sathidevi. C, ―The Reasons for dropouts of sdult learners from adult education centres in Kerala – A case study‖, International Journal of Advance Research in Science and Engineering, vol. 07, issue 03, pp. 791-802,2018.