Jets and Vector Bosons in Heavy Ion Collisions
Begoña de la Cruz on behalf of CMS Collaboration1,a
1CIEMAT, Madrid
Abstract. This paper reviews experimental results on jets and electroweak boson (photon, W and Z) production
in heavy-ion collisions, from the CMS and ATLAS detectors, using data collected during 2011 PbPb run and pp data collected at an equivalent energy. By comparing the two collision systems, the energy loss of the partons propagating through the medium produced in PbPb collisions can be studied. Its characterization is done using dijet events and isolated photon-jet pairs. Since the electroweak gauge bosons do not participate in the strong interaction, and are thus unmodified by the nuclear medium, they serve as clean probes of the initial state in the collision.
1 Introduction
In heavy nuclei collisions at very high energies, quarks and gluons, which are confined into colourless hadrons, become free, having the capability to form a high den-sity colour deconfined state of strongly interacting mat-ter, called Quark-Gluon Plasma (QGP). Lattice QCD cal-culations predict the existance of a phase transition for reaching the QGP, given the high temperatures and en-ergy densities reached in the heavy ion collisions. The high-momentum partons formed in the early stages of the collisions, traverse the hot medium, losing energy as they interact with other constituents via radiative or collisional processes. These energetic partons give rise to final parti-cles which are sensitive to the electroweak interaction, like W, Z and photons, or to the strong force, like quarks and gluons which reach the detectors as jets of particles, after hadronization. Both kind of probes, jets and bosons, pro-vide very valuable information on the energy loss mech-anism and the partonic medium characteristics and struc-ture.
One of the experimental programs addressing nowa-days heavy ion collisions takes place at the LHC (Large Hadron Collider) at CERN (Geneva) and during the three years of high-performant operation of this accelerator, sev-eral samples of PbPb, pPb and pp collision data have been gathered by ATLAS, ALICE and CMS experiments1.
In the following, results obtained by CMS and ATLAS on the subject of jets and vector boson production in heavy ion collisions are presented. For that purpose, two sets of PbPb data at √s = 2.76 TeV per interacting nucleon pair have been analysed, one comprising an integrated lu-minosity of around 7µb−1(2010 PbPb Run) and another one with 150µb−1 (2011 PbPb Run). For reference pur-poses, two sets of pp data at the same centre-of-mass
en-ae-mail: [email protected]
1LHCb experiment has also collected pp and pPb data samples.
ergy (L = 230 nb−1 andL = 5 pb−1, collected in 2011
and 2013 respectively) were also studied. Finally, prelim-inary results on a new set of data with pPb collisions at
√
sNN =5 TeV corresponding to an integrated luminosity
of 31 nb−1, recorded at the beginning of 2013, were pre-sented.
2 Jet production
Given the high center-of-mass energies achieved in heavy ion collisions at the LHC, jets of high pTare produced at
higher rates than in prior experiments and thus are useful probes to test properties of the partonic medium created.
A very important characteristic of jet production was established already at RHIC (Relativistic Heavy Ion Col-lider), namely the jet-quenching, the suppression of high-pTparticles. This effect has been confirmed to be present
in PbPb collisions at the LHC, and has been studied in the dijet event production, quantifying it by means of the jet
asymmetry, AJ=
pJ1
T−pJ2T
pJ1
T+pJ2T
, where J1 and J2 refer to the
lead-ing and next-to-leadlead-ing pT jets in each event. Jets are
re-constructed using an anti-kTalgorithm, with radius R=
0.3-0.4, and samples of events containing a jet of pT > 100
GeV/c(ATLAS[1]) and pT > 120 GeV/c(CMS[2]) are
considered. A value of AJ ∼ 0 implies a balanced dijet
configuration, while AJ >> 0 indicates a suppression of
the pTof the second jet relative to the first one. This
quan-tity is studied for different collision centralities (reflecting the geometrical overlap of the colliding nuclei) observing a clear shift of the mean value of the distribution to higher values of AJfor very central PbPb collisions (large
over-lap of the incident nuclei and thus great number of par-ticipating nucleons), compared to the same distribution in pp data at the same centre-of-mass energy and to predic-tions from dijet production by PYTHIA embedded in PbPb events simulated with HIJING (ATLAS) and experimental minimum bias PbPb data (CMS).
© Owned by the authors, published by EDP Sciences, 2013
Despite the large asymmetries, the distribution of the difference of the jets azimuthal angles is highly peaked to-wards a back-to-back configuration, almost independently of the centrality of the nuclear collision and in good agree-ment with the corresponding distribution from pp data and from simulation expectations.
The momentum lost by the subleading jet is transferred to the medium. The momentum balance in the event is restored when all charged particles with momenta as low as 0.5 GeV/care considered. Their spatial distribution is such, that high pT particles are closer to the leading jet
axis in the transverse plane, while the low pT particles
which compensate and balance the event are produced at much bigger angles relative to the jet axis, as measured by CMS[2]. This results in wider jets in central PbPb collisions, compared to pp interactions, as there is an en-hancement in the contribution of soft pT (pT ≤ 4 GeV/c)
particles to the emerging jet, at large angles respect to its axis. Quantitatively, fragmentation functions describing the hadronization of quarks and gluons in jets, have been measured by both experiments[3][4], using the variable z = ptr
||/p
jet which relates the momentum component of
charged tracks within a jet cone to its momentum axis, pjet.
Figure 1 shows the distribution ofξ = ln(1/z) measured by CMS for different ranges of the collision centrality, re-ferred to the same quantity computed in pp interactions at the same centre-of-mass energy. The ratio is compatible with unity for peripheral collisions (left pannel), while it significantly deviates from one at low values of Z (large angles relative to the jet axis) for central collisions. AT-LAS performs the measurement in terms of the ratio of central to peripheral collisions, reaching similar conclu-sions.
Figure 1. Ratio of fragmentation functions in PbPb collisions,
obtained by CMS, for jets with pT >100 GeV/cand tracks with
pT >1 GeV/c, for four regions in centrality, relative to their pp
reference.
Besides the reduction of transverse momenta of jets in relativistic heavy ion collisions, the inclusive yield of these high-pTjets is also affected. This is quantified through the
nuclear modification factor, RAA, defined as the ratio of the
inclusive jet yield in PbPb and in pp collisions, normalised by the number of binary nucleon-nucleon collisions.
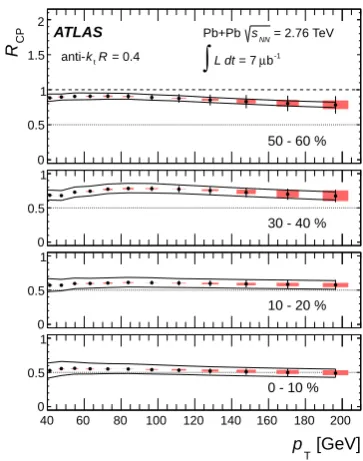
Figure 2 presents this quantity as a function of the number of participants, as measured by CMS[5], showing a factor of two suppression in high-pTjet yields in central
PbPb collisions, relative to those measured in pp interac-tions. This suppression is almost independent of the jet pTand cone radius, as the ATLAS[6] results on Figure 3
shows, in the ratio of yields in central and peripheral col-lisions.
part N
0 100 200 300 400
AA
Jet R
0 0.2 0.4 0.6 0.8 1 1.2 1.4 1.6 1.8
Particle Flow Jets R = 0.3 T
Anti-k
Bayesian = 2.76 TeV
NN
s PbPb
| < 2 η |
-1
b µ L dt = 129
∫
CMS Preliminary
Uncorr statistical
Total systematics (GeV/c) < 110
jet T
100 < p
(GeV/c) < 300
jet
T
100 < p
Figure 2. Jet RAAas a function of Npartfor 100<jet pT <110
GeV/c (closed circles) and 100< jet pT < 300 GeV/c(open
boxes) from CMS.
[GeV]
T p
40 60 80 100 120 140 160 180 200
0 0.5 1
0 - 10 %
0 0.5 1
10 - 20 %
0 0.5 1
30 - 40 %
CP
R
0 0.5 1 1.5 2
50 - 60 %
= 2.76 TeV
NN s
Pb+Pb
-1
b
µ
= 7
L dt
∫
ATLAS= 0.4
R
t
k
anti-Figure 3. Jet RCP (relative yield in central to peripheral
colli-sions) as a function of jet pT.
CMS and ATLAS have also performed a first measure-ment of the fraction of the inclusive jet yields coming from b-quarks in PbPb data. ATLAS[7] exploits for that purpose the pTspectrum of single muons coming in jets, measured
in various subdetectors, within the transverse momentum range 4<pT<14 GeV/c.
relative to the total inclusive one is extracted, for jets with pT >100 GeV/c. Within uncertainties, and related to the
fraction measured in pp collisions, the PbPb data favours a scenario where b-jets suffer energy losses similar to those in the inclusive jet sample.
Finally, only a few months ago, pPb collisions data were collected, at a centre-of-mass energy of 5 TeV. First studies of dijet events by CMS[9] indicate that there is no evident pT imbalance in jets in pPb collisions, consistent
with results from the pp reference sample and with pPb HIJING simulations.
3 Vector Boson production
3.1 Isolated photons
Photons coming directly from the hard scattering of inci-dent nucleons are usually highly energetic and produced isolated from other particles. This is not the case for pho-tons from decays of neutral mesons produced inside a jet and those from parton fragmentation, and thus, surrounded by significant hadronic activity from other parton frag-ments. Isolation provides a good handle to suppress the fragmentation photon component in the data sample, while removing a very small contribution of direct photons. Still, the hard scattering is superimposed on top of other multi-ple parton-parton scatterings (underlying event) occurring simultaneously and which must be subtracted, prior to ap-plying the isolation criteria during the event selection.
Despite the challenge in disentagling both photon con-tributions, CMS[10] and ATLAS[11] have succeeded in selecting a sample of isolated photons, dominated by pho-tons originating from quark-gluon Compton scattering, with only a small portion of photons from decays and frag-mentation processes, which fulfill the isolation criteria.
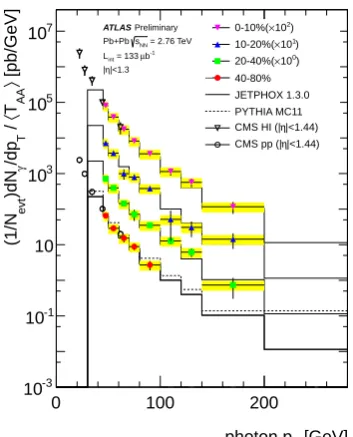
Figure 4 shows the isolated photon transverse momen-tum distribution measured by ATLAS in PbPb data for four different regions in centrality ( [0–10%], [10–20%], [20– 40%] and [40–80%]) and evaluated in the central region in photon pseudorapidity|ηγ| ≤ 1.4. The corresponding cross section obtained in pp data, at the same centre-of-mass energy, measured by CMS, is also included. The photon pT distributions from PbPb data, scaled by2 TAA,
agree quite well with those from pp collisions and with NLO JETPHOX calculations.
From this comparison, nuclear modification factors RAA are derived. This is done for different centrality
re-gions, as a function of photon pT. Figure 5 shows the
RAAdependence with the number of participants, for
dif-ferent ranges of photon ET, as measured by CMS. The
error bars account for the statistical uncertainty and the coloured-filled rectangles for the systematic ones, which come mainly from the background template modelling and the photon energy scale, both in the PbPb and in the pp data. The RAAvalues are compatible with unity and, thus,
confirm the scaling of the isolated photon production with Ncoll, establishing the isolated photon sample as a baseline
for further analyses, as will be shown later.
2T
AAis the number of elementary binary nucleon-nucleon (NN) col-lisions, Ncoll, divided by the elementary NN cross section.
[GeV]
T
photon p
0 100 200
[pb/GeV]
〉
AA
T
〈
/
T
/dp γ
)dN
evt
(1/N
-3
10
-1
10 10
3
10
5
10
7
10 0-10%(×102)
)
1
10 × 10-20%(
)
0
10 × 20-40%( 40-80% JETPHOX 1.3.0 PYTHIA MC11
|<1.44) η CMS HI (|
|<1.44) η CMS pp (|
)
2
10 × 0-10%(
)
1
10 × 10-20%(
)
0
10 × 20-40%( 40-80% JETPHOX 1.3.0 PYTHIA MC11
|<1.44) η CMS HI (|
|<1.44) η CMS pp (| Preliminary
ATLAS
= 2.76 TeV
NN
s Pb+Pb
-1
b
µ
= 133
int
L |<1.3
η
|
Figure 4.Isolated photon spectra as a function of the photon pT
for several centrality regions in PbPb collisions (scaled by TAA)
and pp collisions, scaled by arbitrary factors (for better visualiza-tion). The results are compared to NLO JETPHOX calculations.
part
N
0 100 200 300 400
AA
R
0 0.5 1 1.5 2 2.5
: 20 - 25 GeV
T
E =2.76TeV
NN
s CMS
30 - 100%
0 - 100%
10 - 30% 0 - 10%
part
N
0 100 200 300 400
AA
R
0 0.5 1 1.5 2 2.5
: 30 - 40 GeV
T
E
part
N
0 100 200 300 400
AA
R
0 0.5 1 1.5 2 2.5
: 25 - 30 GeV
T
E
part
N
0 100 200 300 400
AA
R
0 0.5 1 1.5 2 2.5
: 40 - 50 GeV
T
E
-1
b
µ
L dt = 6.8
∫
PbPb
-1
L dt = 231 nb
∫
pp
AA R
Centrality bins
0 - 100%
Systematic uncertainty
PbPb (MB trig) and
pp (lumi) uncertainty
part
N
0 100 200 300 400
AA
R
0 0.5 1 1.5 2 2.5
: 50 - 80 GeV
T
E
Figure 5. Nuclear modification factors, RAA, as a function of
PbPb centrality (given by the number of participant nucleons, Npart) for five different photon ETintervals.
3.2 Z bosons
The Z and W bosons have been detected and measured at the LHC for the first time in heavy ion collisions, despite their very low production cross section.
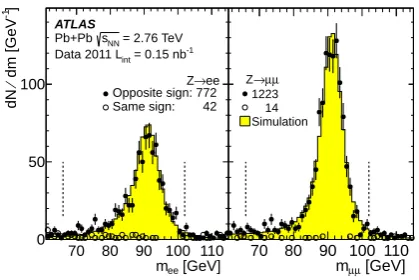
an almost negligible background. Figure 6 presents the dimuon (left) and dielectron (right) invariant mass distri-butions, based on an integrated luminosityL=0.15 nb−1 of PbPb collisions data, measured by ATLAS.
[GeV] ee m 70 80 90 100 110
]
-1
dm [GeV
⁄
dN
0 50
100 Z→ee
Opposite sign: 772 Same sign: 42
ATLAS
= 2.76 TeV
NN
s Pb+Pb
-1
= 0.15 nb
int
Data 2011 L
[GeV] µ µ m 70 80 90 100 110
counts
0 50 100 Z→µµ
1223 14 Simulation
Figure 6. Dilepton invariant mass spectra in PbPb collisions:
dielectrons (left plot), dimuons (right plot). Full circles are opposite-sign dileptons, while empty circles show same-sign dilepton candidates. The solid histogram shows the expectations from the simulated events (pp→Z→l+l−
) embedded in PbPb HIJING events. Vertical lines correspond to statistical uncertain-ties.
〉
part N
〈
0 100 200 300 400
events
N
|y|<2.5
ll
→
Z
N 〉
coll
N
〈
9
10
2 4 6
ATLAS
= 2.76 TeV NN
s Pb+Pb
-1 = 0.15 nb int
Data 2011 L
ee
→
Z ll
→
Z
µ µ →
Z
Z T All p
<10GeV Z T p
<30GeV Z T 10<p
>30GeV Z T p
Figure 7. Centrality dependence (as a function of Npart) of Z
boson yields normalised to Ncoll in PbPb collisions, measured
by ATLAS, for ee (upward pointing triangles) andµµ
(down-ward pointing triangles) channels, and their weighted average (diamonds). Vertical lines (bands) correspond to statistical (sys-tematic) uncertainties. The dashed lines show the result of the fit to a constant value.
Several kinematic distributions have been studied with the samples of Z candidates, like the Z rapidity and pT,
and have been compared to Powheg (CMS) and PYTHIA normalised to NNLO cross section (ATLAS) predictions for pp → Z → l+l−, scaled with the number of binary collisions. The experimental distributions are consistent with both theoretical predictions.
Examining PbPb collisions of different centrality, no dependence of the production of Z bosons on the number of participants is observed (see Figure 7), shown inclu-sively for the dimuon and dielectron channels, and also in three different pT(Z) ranges. The same behaviour is
ob-served relative to the boson rapidity. These results validate the Z bosons as a reference particle unaffected by final-state interactions in the strongly interacting dense system produced in Pb-Pb collisions at the LHC.
3.3 W bosons
The production of W bosons in PbPb collisions has been measured at the LHC in their W± → µ±νdecay channel. Their distinctive experimental feature is the presence of a single high-pTmuon recoiling in the transverse plane to a
significant imbalance in the total momentum of the event, which accounts for the undetected neutrino.
Figure 8 (left) shows the muon transverse mo-mentum distribution (black solid circles), measured by ATLAS[14], for events selected online with a low (2-3 GeV/c) muon pµT threshold and fulfilling some quality cuts. An enhancement of events is observed in the region pµT >25 GeV/c, where the contribution from muons from W (and Z) decays is expected. A fit (black solid line) to the data is performed, taking into account two contribu-tions, one for the W→ µνsignal (modelled with a Pythia pp → W → µν simulation, the normalization left as a free parameter in the fit) (green-hatched histogram) and another for the background (blue-dashed line). The fit de-scribes the data quite well.
CMS[15] has additionally computed the imbalance in the transverse momentum in the event, (p/T), as the opposite
sign of the vectorial sum of all charged particle transverse momenta in the event, with pT > 3 GeV/c. Events are
required to havepµT >25 GeV/candp/T>20 GeV/c.
The transverse mass distribution, given by mT =
q
2pµTp/T(1−cosφ), being φ the difference in azimuthal
angle between the muon and p/T vectors, for the selected
events is presented in Figure 8 (right) for PbPb (red dots). The data sample of pp collisions collected at the same centre-of-mass energy is analyzed in a similar way, and their mT distribution is also shown in the figure
(blue-open squares). They both represent compatible W sig-nals, with little background, as they are in good agree-ment with a W PYTHIA signal simulation, embedded in PbPb events generated with HYDJET (green-hatched his-togram). Residual contamination from other electroweak processes (Z→ µ+µ−and W±→ τ±ν) (2%) is subtracted, and the QCD background is estimated to be≈1% and in-cluded as a systematic uncertainty.
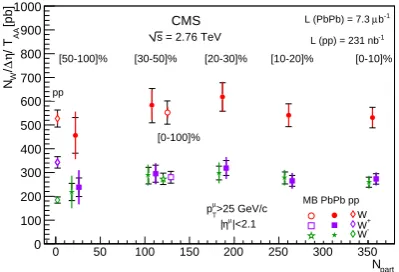
From the sample of W candidates selected in PbPb and in pp data, normalised with the nuclear factor TAA, CMS
computes the W production cross section in PbPb colli-sions per unit of W rapidity and it is shown in Figure 9 as a function of the number of participants in the colli-sion, Npart. Two main effects are observed: one, the W
]
2
[GeV/c
T
m
0 50 100 150 200 250
2
Number of Events/ 8 GeV/c
0 20 40 60 80 100 120 140 160 CMS -1 b µ (PbPb) = 7.3
int
L
-1
(pp) = 231 nb
int
L > 25 GeV/c
µ T
p | < 2.1
µ
η
|
(c)
> 20 GeV/c
T
p
= 2.76 TeV ) s pp data (
= 2.76 TeV )
NN
s PbPb data ( PYTHIA + HYDJET
Figure 8. Left: Single-muon transverse-momentum spectrum
for |ηµ| < 2.7 in PbPb data (black points) measured by
AT-LAS. W± → µ±ν
signal (green-hatched histogram) and back-ground (blue-dashed histogram) contributions are fitted (black-solid line) to the data. Right: CMS Transverse mass distribu-tion for selected events in PbPb (red-filled circles) and pp (blue
open squares) data, compared to PYTHIA+HYDJET
simula-tion (hatched histogram). The error bars represent statistical un-certainties.
the collision and the other, the comparison of the individ-ual W+and W− production in PbPb and pp data, reflect the different u and d quark content in the Pb nuclei and in the proton. The RAA factors obtained are: RAA(W+)=
0.82±0.07±0.09 and RAA(W−) = 1.46±0.14±0.16.
Nevertheless, the total W (W+ plus W−) production is consistent, at leading order (LO), with Ncoll scaling, as
RAA(W)=1.04±0.07±0.12
part
N
0 50 100 150 200 250 300 350
[pb] AA / T η ∆ / W N 0 100 200 300 400 500 600 700 800 900 1000
[50-100]% [30-50]% [20-30]% [10-20]% [0-10]%
[0-100]%
CMS
= 2.76 TeV s
-1
b µ L (PbPb) = 7.3
-1
L (pp) = 231 nb
pp >25 GeV/c µ T p |<2.1 µ η
| WW+
-W MB PbPb pp
Figure 9. Left: Centrality dependence of normalised W→µν
cross sections in PbPb collisions, measured by CMS, for all W candidates (red filled points) and separated by charge, W+ (violet-filled squares) and W−
(green-filled stars). The open sym-bols at Npart = 120 represent the minimum bias events. At
Npart=2, the corresponding cross sections are displayed for pp
collisions for the same √s. The cross sections are given for the phase space regionpµT>25 GeV/cand|ηµ|<2.1.
This measurement allows to establish the W boson as a reference particle, unaffected by the hot and dense medium created in PbPb collisions.
Whenever the uncertainties (both statistical and sys-tematic) will allow it, the analysis of these bosons will be very useful to constrain predicted nuclear effects (shadow-ing, energy loss) and give access to quark/antiquark/gluon
parton distribution functions (PDF) in the proton and neu-tron.
4 Vector Boson plus Jets production
As seen, data indicate the existance of an energy loss mechanism affecting coloured particles (in the form of jets) while the neutral coloured ones (photons, W and Z) are unaffected by the partonic/hadronic medium. Events where both kind of particles are produced (bosons+jets) in the same hard interaction are thus very important to characterise the energy loss mechanism, tagging on the clean bosons and studying the jets distributions.
This has been possible with the data collected during the 2011 PbPb run, usingγ/Z+jets selected samples.
T γ /p T Jet = p γ J x
0.5 1 1.5
γ
J
dx
γ
J
dN γJ
N 1 0 0.5 1 1.5 2 2.5 pp Data
50% - 100%
(a) T γ /p T Jet = p γ J x
0.5 1 1.5
γ
J
dx
γ
J
dN γJ
N 1 0 0.5 1 1.5 2 2.5 PbPb Data PYTHIA + HYDJET
30% - 50%
(b) T γ /p T Jet = p γ J x
0.5 1 1.5
γ
J
dx
γ
J
dN γJ
N 1 0 0.5 1 1.5 2 2.5
| < 1.44
γ
η > 60 GeV/c |
T γ
p
| < 1.6
Jet
η > 30 GeV/c |
T Jet p π 8 7 > γ J φ ∆
10% - 30%
(c) T γ /p T Jet = p γ J x
0.5 1 1.5
γ
J
dx
γ
J
dN γJ
N 1 0 0.5 1 1.5 2 2.5 =2.76 TeV NN s -1 b µ L dt = 150
∫
CMS
0% - 10%
(d) Z T /p jet T p
0.5 1 1.5 2 2.5 3
) Z T /p jet T d(p Z+jet dN × Z N 1 0 1 2 3 ATLAS Preliminary -1 =0.15 nb int =2.76 TeV,L NN s Pb+Pb >25/60 Z T /p jet T >60 GeV, p Z T >25, p jet T Jet R=0.4, p T Anti-k 0.01 ± PYTHIA: Mean=0.84 0.08 ± 0.07 ± Pb+Pb: Mean=0.82 20-80% Centrality
φ ∆
2 2.5 3
Arbitrary Units 0 0.2 0.4 0.6 Z T /p jet T p
0.5 1 1.5 2 2.5 3
) Z T /p jet T d(p Z+jet dN × Z N 1 0 1 2 3 ATLAS Preliminary -1 =0.15 nb int =2.76 TeV,L NN s Pb+Pb >25/60 Z T /p jet T >60 GeV, p Z T >25, p jet T Jet R=0.3, p T Anti-k 0.01 ± PYTHIA: Mean=0.82 0.04 ± 0.04 ± Pb+Pb: Mean=0.62 0-20% Centrality
φ ∆
2 2.5 3
Arbitrary Units
0 0.2 0.4 0.6
Figure 10. Top: Ratio pJ
T/p
γ
T after background subtraction, by
CMS. PbPb data (filled circles) are compared to pp collisions
at √s = 2.76 TeV (filled squares) and to PYHTHIA+
HYD-JET simulation of the signal (shaded histogram). Four regions in centrality are considered. Bottom: Ratio pJ
T/p Z
T, by ATLAS.
PbPb data (filled circles) are compared to signal simulation from PYTHIA. The inset plots show the difference in azimuthal angles between jet and boson.
From the sample of isolated photons and of Z boson candidates extracted in collision data, and explained in previous sections, those with pT(γ/Z) > 60 GeV/cand
accompanied by a jet with pT(jet)>25−30 GeV at an
az-imuthal angular separation of the boson sufficient to ensure the jet recoils to it, are selected. The transverse momen-tum balance between boson and jet is studied by means of the ratio pJ
T/p boson
T , which is shown in Figure 10 for the
photon+jet sample (as measured by CMS[16]) in the top row of plots and for the Z-boson +jet set (as measured by ATLAS[17]), in the lower plots, for two categories of data according to centrality: peripheral interactions (left) and central collisions (right). Data points from PbPb col-lisions are presented, together with the signal simulation from PYTHIA, embedded in PbPb Hydjet events and ad-ditionally with results from pp collisions, in the case of
γ+jets sample.
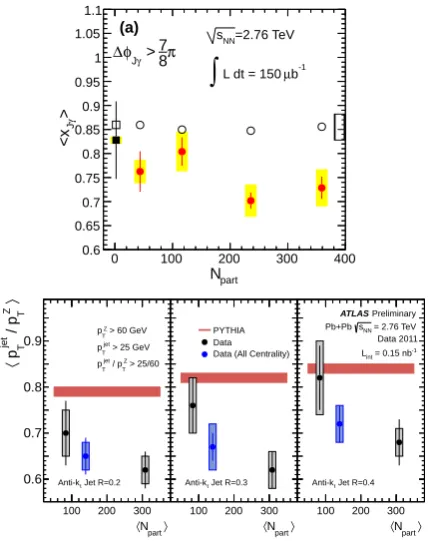
There is reasonable agreement among all distributions in the case of peripheral collisions, but a clear pT
part N
0 100 200 300 400
>γ
J
<x
0.6 0.65 0.7 0.75 0.8 0.85 0.9 0.95 1 1.05 1.1
=2.76 TeV
NN
s
-1
b
µ
L dt = 150
∫
(a)
π
8 7 > γ J
φ ∆
〉
Z T
/ p
jet T
p
〈
0.6 0.7 0.8 0.9
〉 part N
〈
100 200 300
0.6 0.65 0.7 0.75 0.8 0.85 0.9 0.95
Jet R=0.2
t
Anti-k
> 60 GeV
Z T
p > 25 GeV
jet T
p > 25/60
Z T
/ p
jet T
p
〉 part N
〈
100 200 300
0.6 0.65 0.7 0.75 0.8 0.85 0.9 0.95
Jet R=0.3
t
Anti-k PYTHIA Data Data (All Centrality)
〉 part N
〈
100 200 300
0.6 0.65 0.7 0.75 0.8 0.85 0.9 0.95
Jet R=0.4
t
Anti-k
Preliminary
ATLAS
= 2.76 TeV
NN
s Pb+Pb
Data 2011
-1
= 0.15 nb
int
L
Figure 11. Top: Average ratio of pJ
T/p
γ
T as a function of Npart,
by CMS. The same legend from those in Figure 10 top row of plots apply here, being the empty circles the PYTHIA+HYDJET simulation. Bottom: Average ratio pJ
T/p Z
Tmeasured by ATLAS in
PbPb collisions as a function of Npart. The width of the PYTHIA
band represents its uncertainty.
the mean value of the previous distributions are shown as a function of the number of participants, Npart.
Similarly, the yield of events with a high-pTboson (Z/γ
with pT >60 GeV/c) and an associated jet (pJT >25−30
GeV/c) relative to all events with a high-pTboson, is
quan-tified by means of Nboson+jet/Nboson, and studied as a
func-tion of the collision centrality. A suppression in the
pro-duction of boson plus jets events is observed, which quan-titatively is in agreement with the nuclear modification factor measured for the inclusive jet yields.
In the future, with statistically more significant PbPb and pp data samples, at the same centre of mass energies, these studies will allow a more precise insight into the en-ergy loss mechanism, although already today the conjuga-tion of both probes, jets and bosons, in the same event, has rendered important conclusions.
References
[1] G. Aadet al.ATLAS Collaboration, Phys. Rev. Lett.
105252303 (2010).
[2] S. Chatrchyanet al.CMS Collaboration, Phys. Rev. C
84024906 (2011).
[3] S. Chatrchyan et al. CMS Collaboration, CMS PAS HIN-12-013 and JHEP10087 (2012).
[4] ATLAS Collaboration, ATLAS CONF-2012-115. [5] CMS Collaboration, CMS PAS HIN-12-004.
[6] G. Aadet al.ATLAS Collaboration, Phys. Lett. B719
220 (2013)
[7] ATLAS Collaboration, ATLAS CONF-2012-050. [8] CMS Collaboration, CMS PAS HIN-12-003. [9] CMS Collaboration, CMS PAS HIN-13-001.
[10] S. Chatrchyanet al.CMS Collaboration, Phys. Lett. B710256 (2012).
[11] ATLAS Collaboration, ATLAS CONF-2012-051. [12] G. Aadet al.ATLAS Collaboration, Phys. Rev. Lett.
110022301 (2013).
[13] CMS Collaboration, CMS PAS HIN-12-008. [14] ATLAS Collaboration, ATLAS CONF-2011-078. [15] S. Chatrchyanet al.CMS Collaboration, Phys. Lett.
B71566 (2012).
[16] S. Chatrchyanet al.CMS Collaboration, Phys. Lett. B718773 (2013).