THE INVESTIGATION OF DENSITY CURRENTS AND RATE OF OUTFLOW
FROM A SEPTIC TANK
Maciej Pawlak1, Mariusz Skiba1, Marcin Spychała1, Jakub Nieć1
1 Department of Hydraulic and Sanitary Engineering, Poznan University of Life Sciences, Wojska Polskiego 28, 60-637 Poznań, Poland, e-mail: [email protected]; [email protected]; [email protected]
INTRODUCTION
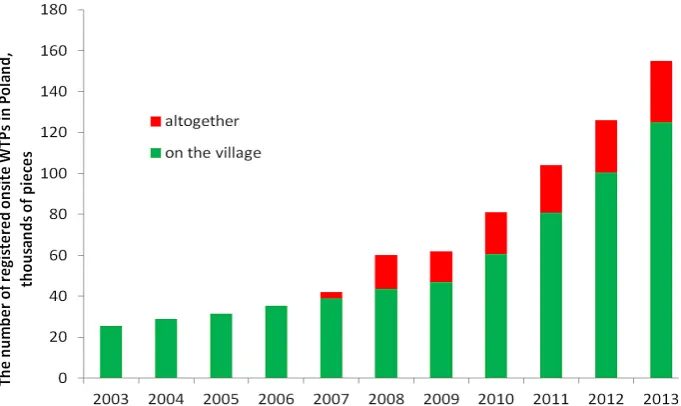
In recent years in Poland the dynamic growth of declarations by local government concerning onsite wastewater treatment plants (WTPs) can be observed. These systems are popular in rural areas, where the building of sewerage systems is not rec-ommended for economic and technical reasons. At the end of 2013 the declared onsite WTPs number was approximately 155 thousand [Environmental
protection, Central Office of Statistics (GUS), Po -land, 2005–2014], and about 125 thousand of these were installed in rural areas [Municipal
infrastruc-ture GUS, 2003–2013] (Figure 1). In recent years
the annual growth of declared onsite WTPs can be seen in the range of 20–30 thousand.
The septic tank (ST) is usually the first part of the onsite WTP. The purification of wastewa
-ter in a ST occurs during the slow flow of waste -water through the tank, mainly thanks to three
Volume 16, Issue 4, Oct. 2015, pages 103–110
DOI: 10.12911/22998993/59356 Research Article
ABSTRACT
The aim of the study was to verify the possibility of the existence of preferential flow
paths in a septic tank and the effect of using various types of inlet and outlet in this
context. Two of the most unfavourable variants of privileged flow paths for different types of inlet and outlet were analysed. The first variant was related to the occurrence of the privileged flow path below the water surface level directly to the outlet and the
second variant – to the so-called boiling phenomenon in a septic tank. During the study,
the intensity of outflow from the septic tank was measured. The time between succes -sive doses also was measured. These studies were carried out using several inlet and outlet structures combinations. It was observed that by introducing a suitable outlet it is
possible to limit and in the case of the particular type of filtering basket – to eliminate the unwanted phenomenon of preferential flow paths after hot water introduction. The
phenomenon of boiling in the septic tank may occur due to the introduction of wastewa-ter of higher density containing a higher concentration of the suspension. The effect of cooler water introduction on this phenomenon was not observed. The limitation of the
maximum intensity of outflow from the septic tank can be achieved by filtering basket using at the outlet, which increases the flow resistance thanks to the low porosity.
Keywords: density current, septic tank, wastewater, rate of outflow.
Received: 2015.06.22 Accepted: 2015.08.31 Published: 2015.10.01
processes: sedimentation, flotation and fermen -tation of sludge accumulated at the bottom, and
scum floating at a liquid surface.
The temperature in a ST significantly affects the flow velocity and the efficiency of related processes and hence the quality of out-flowing,
pre-treated wastewater. In the study described by
Łomotowski and Szpindor [1999], the temperature in the ST ranged from 6 °C to 14 °C. Heidrich and Stańko [2007] reported that in local wastewater
treatment devices, such as onsite WTPs,
wastewa-ter temperature does not fall below 10 °C, and the
air temperature has little effect on the temperature of wastewater in these devices. At air temperatures
below 3 °C the temperature of the wastewater in a device ranges from 10 °C to 12 °C and at air more than 3–6 °C, the temperature of the wastewater ranges between 12.1 °C and 16 °C, while above the air temperature of 6 °C – wastewater tempera
Figure 1. Quantity: the number of reported onsite WTPs by 2013[GUS 2005–2014]
In contrast, the Matuszewski [2009] study showed a more significant relationship between the temperature of wastewater in the ST at its outflow and air temperature. Figure 2 shows the related temperature dependence in a ST of air temperature (coefficient R2 of linear
determina-tion of this dependence is 0.76) for a seven-day
retention time (comparable to the real wastewater retention time, this ratio was highest and amount-ed to R2 = 0.82). During the study a minimum
temperature of 2.6 °C and maximum 19.1 °C was recorded. The temperature of wastewater in a ST below 5 °C in 2008 was observed 18 times and between 5 °C and 10 °C – 158 times, 10–15 °C – 83 times, and between 15 °C and 19.1 °C – 107
times. The percentages of occurring temperature
ranges are shown in Figure 3.
Research conducted by Matuszewski [2009],
as well as data provided by Chmielowski et al.
[2009] showed a wider range of temperatures
Figure 2. Air temperature and sewage temperature in a ST relation [Matuszeski 2009]
found in a ST and a higher effect of air tempera -ture on the wastewater tempera-ture than the data
presented by Łomotowski and Szpindor [1999], and Heidrich and Stańko [2007].
A study carried out in North America by Gra -ham showed differentiated wastewater
tempera-tures – from 7 °C to 22 °C in the first chamber of the ST and from 2 °C to 14 °C in the second chamber at an air temperature between –20 °C and 6 °C [Viraraghavan, 1977], confirming the re
-sults of Matuszewski [2009] and Chmielewski et al. [2009]. On the other hand, Bounds [1997] re
-ported that the temperature of wastewater flowing out of ST ranges from 10 °C to 23 °C. Leverenz
et al. [2010] presented the monthly average
tem-perature in a ST in San Francisco (USA), which ranged from about 17 °C in the period from Feb
-ruary to May to 22° C in September, while in Quebec City (Canada) – from 9 °C in January to 22 °C in July and Kansas (USA) – from 6.5 °C in April to 18 °C in August.
In this context, Patterson [2003] studied the
temperature of wastewater inside a ST located in
Australia, using a 15 minute interval recorder.
In his opinion, temperature fluctuations in a ST
should be small and short-lasting because of a relatively small volume of hot and cold waste-water in comparison to the volume of the tank.
He drew the conclusion that changes in tempera -ture, caused by warm wastewater, e.g.
originat-ing from household showeroriginat-ing (38 °C) or dish
-washers (60 °C) during winter can be substantial and in other seasons – small. He also believes
that cold water changes the temperature during the summer, giving the example of a temperature
decrease of 1.5 °C during the period when a large quantity of cold water could be observed, while flushing lavatories and hand washing. During
the 14-day period of the four septic temperature
study the temperature fluctuations are shown to be in the range of 20–31 °C.
The concentration of the slurry and the
tem-perature have an effect on the density of inflow -ing wastewater, which, with a high content of suspended solids, behaves as if it had a higher
density than the wastewater contained in the ST
and indeed had settled on the bottom. As a result, the velocity of the stream is much higher than in
theory and the clarifier subsequently has a poorer efficiency. Two possible cases may be related to the influence of the temperature on the density
differences. Introducing wastewater into the sump cooler, rather than within it gives rise to a stream
bed, which picks up sediments accumulated at the bottom, which occurs especially in summer when
cold water is consumed (e.g. flushing of toilets).
This relates to the phenomenon known as spring turnover or boil in the septic tank, which may
cause deterioration in the quality of wastewater from septic tank effluent. The case where waste -water is warmer (e.g. originating from a bath) causes the creation of a surface stream, especially visible in winter. In this situation, poorly treated
wastewater finds a shorter route to the outlet of
the septic tank [D’Amato et al., 2008].
Privileged flow path is a problem that occurs
in the case of a badly designed settler, incorrect inlet and outlet construction or density currents. Appropriate design can prevent unfavourable density current distribution related to solution in-lets and outin-lets and the geometry of the settlers.
Inlets should ensure the equitable distribution of wastewater pathways, the formation of equal liquid streams and the reduction of sludge drift velocity, and that of kinetic energy [Cywiński et al., 1983].
The aim of the study was to verify the theory
of the existence of preferential flow paths and the
effect of using various types of inlet and outlet in this context.
METHODOLOGY
Two of the most unfavourable variants of
priv-ileged (with using hot and cold water) flow paths
for different types of inlet and outlet from the
sep-tic tank (option from I to VI) were examined. The first variant (hot water) was related to the occurrence of the privileged flow path below the
water surface level directly to the outlet from the
septic tank. The fluid in the septic tank has a tem
-perature of about 2 °C to about 19 °C and at 4°
C, the water has the highest density of 1.0 g/cm3.
The incoming water, having a temperature of 38
°C (hot domestic sewage), has a density equal to 0.992993 g/cm3. Because the water in the septic
tank during the experiment was 19 °C (0.998430
g/cm3), water of 44 °C (0.990658 g/cm3) was
sup-plied into the septic tank so as to maintain the same difference in density. The volume of water was about 60 dm3, the dosing time 3 minutes. The
inflow rate into the septic tank was 0.3 dm3/s.
the same conditions, but the supplied water was about 14 ºC. Research was carried out once a day to prevent the conditions in the septic tank from
destabilization.
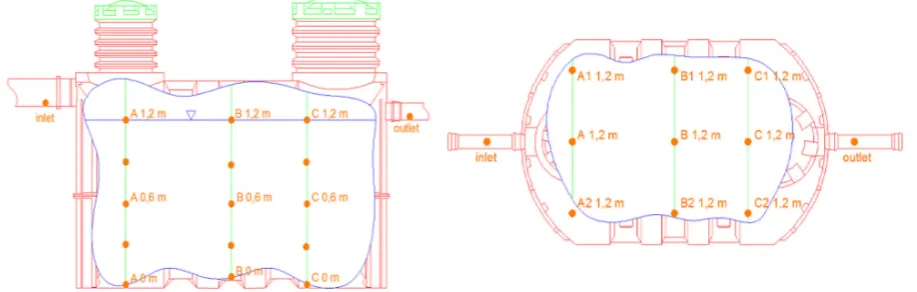
In the study a septic tank with a total volume of 2.3 m3 and active volume of 2.0 m3 was used.
During research 45 sensors were installed
in-side the ST and additional 2 sensors were putted
around the inlet and other 3 were placed near the
outflow from ST. Distribution of sensors is pre
-sented in figure 4.The temperature recording took
place every 2 sec. The tests were performed in three replications. Table 1 shows the test applica-tion opapplica-tions for the inlet and the outlet.
Table 1. The experiment options for the inlet and the outlet
Option Inlet Outlet
I A C
II B C
III A D
IV B D
V A E
VI B E
During the study also the intensity of outflow from the ST was measured, using a substituted ves -sel and the time between successive doses (water with a volume of 10 dm3) was measured.
These studies were carried out according to the
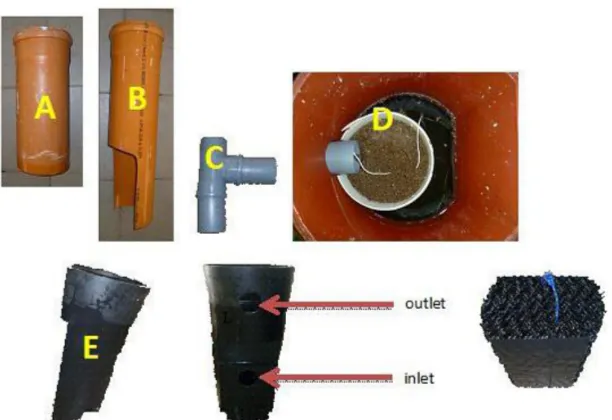
following inlet and outlet structures (Figure 5):
A) a classic inlet – a knee of 160 mm diameter
and 90º angle, with a decompression orifice
and extended by a tube of 40 cm length
B) an inlet with a baffle plate – a knee of 160 mm diameter and 90º angle, with a decompression orifice and extended by a tube of 60 cm length with the notch equal to a half of the circuit
C) outlet – a tee of 110 mm diameter extended by a pipe of 40 cm length
D) outlet – a filter basket filled with expanded
clay aggregates with a height of 32 cm and a diameter of 31 cm
E) outlet – a filtering basket (delivered by HABA RL company, filled with plastic carriers) with a height of 108 cm (long side) and 96 cm (short side). The inlet is located at a height of 27 cm
from the bottom (shorter side), while the outlet
is positioned at a height of 73 cm from the bot -tom (shorter side).
RESULTS AND DISCUSSION
Investigation of flow path of water warmer than the water in the septic tank
The mean temperature change of the liquid at the time of the outlet of the ST for the six options are shown in Figure 7 (calculated on the basis of
3 repetitions).
• Option I. The sensors just below the water
surface showed a significant rise in tempera
-ture of about 2.5 °C. The tempera-ture change in time at the outlet of the ST is shown in Figure 6.
• Option II. The warmer water, despite its
intro-duction into the deeper zone, was observed to flow up near the surface. The sensors located
at the bottom did not register a change in tem-perature. A similar situation occurred in the case of sensors installed at half of the height
(0.6 m) of the tank in planes B and C in the mid-length of the ST (B) and at the outlet (C).
This was related to the fact that hot water,
de-spite its introduction into the deep zone of the tank, flowed to the surface because of its lower
density and turned to the outlet. Sensors lo -cated just under the water surface registered
considerable changes in temperature of 2 °C,
and water temperature in the outlet increased
by about 1 °C.
• Option III. Sharp fluctuations in temperature
did not appear at the outlet and the temperature trend was growing. The water in the tank is
uniformly mixed and the slow outflow thanks to the carriers in the filtering basket resulted
in a lack of disturbance at the surface of the water. Practically all the sensors in a close dis-tance to the water surface level showed little change in temperature and the sensor located in the last level (C 1.2 m), just below the wa-ter surface, showed variations in temperature
within 1 °C. The temperature at the bottom
and half of the tank height were not subjected to change.
• Option IV. The outlet temperature rose more than 1 °C. The sensors located at the bottom
and in the middle of the tank did not register changes in temperature during the entire test.
Sensors located just under the water surface registered slight fluctuations in temperature – about 0.3 °C.
• Option V and VI. The temperature of the
wa-ter in the outlet from the ST increased in all six replicates of two tested options by 0.1°C.
The temperature in the other measurement
points showed no major fluctuations. At the Figure 5. Types of inlet and outlet: A – 160 mm extension of the tube 40 cm;
B – an extension of an 160 mm baffled pipe; C – a tee f110 mm inlet pipe extended by 40 cm; D – a filter basket filled with expanded clay agregates; E – Haba's filter basket
bottom the temperature was constant (about
20 °C), while in the mid-height of the tank – the temperature increased by 1 °C. The
av-erage temperature of the liquid outflow from the ST for 6 options is shown in Figure 6.
Patterson [2003] stated that the volume of
wa-ter in the ST is so large that the real inflow of hot
water is not expected to cause significant tempera -ture changes. The experiment has shown that this
theory needs verification. Despite the large volume of water in the tank after the hot water inflow the
temperature varied transiently in the vicinity of the
water surface. Hot water after departure from the inlet headed toward the top and flowed near the
water surface in the direction of the outlet.
This is due to the fact that hot water rises to the surface due to its lower density. At the bottom of the tank and half of the tank depth, temperature changes were not observed or were negligible. The temperature values being compared and are shown in Table 2. The aver-age temperature difference between initial and
maximum was more than 1 °C. In the case of a conventional filter basket mounted at the outlet of the ST, an average difference of 0.3 °C was
observed in the case of a straight (option III)
in-let and an average difference of about 1 °C – in the case of the inlet equipped with the deflector (option IV). This difference wass related to the
difference in water application level.
Practically negligible temperature differences
were observed in the case of the filtering basket produced by Haba RL filled with a plastic pack
-age. This difference was about 0.1 °C in the case
of application of both options of the inlet (A and
B). Such a small temperature difference was re -lated to the fact that the inlet to the basket was
located very low. Water flowed into the basket at
a low level and hot water of lower density accu-mulated at the water surface, pushing the water of lower temperature into the outlet.
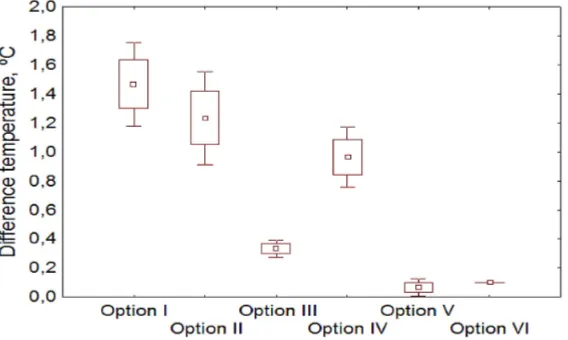
Figure 7 presents average values of tempera
-ture differences at the outlet with basic statistical metrics (standard deviation and standard error)
for the tested options. Based on statistical analy
-sis it can be assumed that the highest
tempera-ture fluctuations occurred in option I and option II. The inlet solution does not have a significant
effect on the temperature difference between the
liquid before and during the test at the outlet,
however the depth (level) of the introduction of hot water has some importance. More important than the depth of the introduction of water itself is the nature of the outlet solution.
Test of preferential flow path of liquid colder than the temperature of ST liquid
In the case of the application of cold water, the relevant temperature usually does not reach
lower than 10–15 °C and in the ST a maximum of about 20 °C is observed [Matuszewski 2009, Chmielewski et al. 2009]. In this case, the temper
-ature difference is about 5–10 °C and in the case of warm water, about 20°C. During studies using
cold water the water inside the tank did not show temperature changes in all options. Only in the in-terior of the inlet and close to the inlet area was
a temperature difference of 1 °C observed, which
encompassed little space and lasted for a short pe-riod (fast return to the initial temperature value).
At a temperature difference of several Celsius degrees and a small volume of cold water in com-parison to the volume of the tank, the phenomenon
of in the ST does not occur due to the temperature
difference, however, it can be related to the den-sity difference caused mainly by the amount of suspension and additionally, can be supported by the temperature difference.
Patterson [2003] confirmed this thesis, in
-dicating the small volume of introduced liquid (compared to the liquid in the tank) and a small,
short-term temperature change caused by the
in-troduction of liquid at various temperatures. Pat
-terson’s [2003] studies do not confirm the thesis
proposed by D’Amato et al. [2008] suggesting the
possibility of in a ST under Polish atmospheric
conditions.
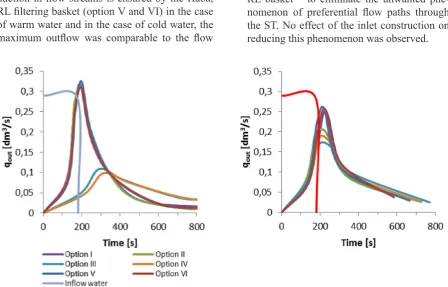
The outflow rate from ST
The flow rate into the tank was always the
same and it was about 0.3 dm3/s. Comparing the
average flow rates of particular options (Figure 8)
we can see the relationship between the types of
outlet and the outflow rate, where it was clear that
the pairs of curves overlap for each type of outlet prevention system.
The highest flow unitization was provided by a filtering basket filled with expanded clay ag
-gregates (option III and IV) for experiments with cold and warm water. Filling the basket with ex -panded clay aggregates caused the highest
resis-tance to the out-flowing water. The smallest re
-duction in flow streams is ensured by the Haba, RL filtering basket (option V and VI) in the case
of warm water and in the case of cold water, the
maximum outflow was comparable to the flow
rate of the inflowing liquid. The filling media of the HABA RL basket filter is made of plastic with large pores that do not cause significant resistance to liquid flow.
Thanks to the large height of the filtering bas -ket and an inlet located at the bottom, the water
level appeared to rise, causing an increase in flow
velocity through the basket. Where there was a
tee at the outlet of the ST (option I and II) for the outflow of cold water, the flow was comparable to the option of the HABA RL basket at cold water flow. However, in the case of the hot water the tee-shape outlet (option I and II) reduced the flow
rate to the value of 0.20 dm3/s. This value is very
close to the value obtained in experiments with a
filtering basket filled with expanded clay aggre -gates for hot water.
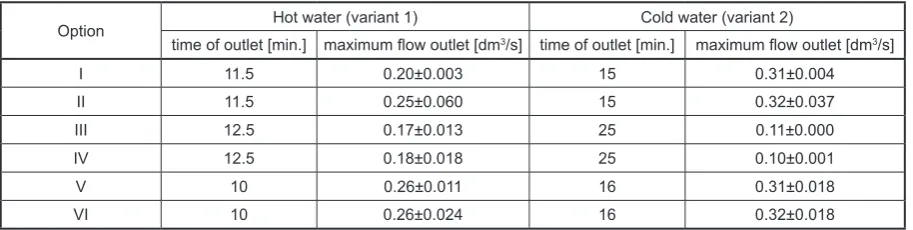
Table 2 represents the maximum outflow from ST recorded during the test and the time for
the outlet solution options.
CONCLUSIONS
Laboratory tests allowed to draw the follow -ing conclusions:
1. It was observed that by introduction a suitable
outlet, it is possible to limit outflow hot water outflow from ST. In the case of using the Haba RL basket – to eliminate the unwanted phe
-nomenon of preferential flow paths through the ST. No effect of the inlet construction on
reducing this phenomenon was observed.
K., Rock Ch. A., Sherman K. 2008. Factors af-fecting the performance of primary treatment in decentralized wastewater systems. Raport WERF 04-DEC-7. Wyd. IWA Pub.
5. GUS. Ochrona środowiska 2005, 2006, 2007, 2008, 2009, 2010, 2011, 2012, 2013, 2014; Warszawa. 6. GUS. Infrastruktura komunalna 2003, 2004, 2005,
2006, 2007, 2008, 2009, 2010, 2011, 2012, 2013; Warszawa.
7. Heidrich Z., Stańko G. 2007. Leksykon przydo-mowych oczyszczalni ścieków. Wyd. Seidel-Przy-wecki, Warszawa.
8. Leverenz H.L., Tchobanoglous G., Darby J.L. 2010. Evaluation of greenhouse gas emissions from septic systems. Raport WERF DEC1R09. Wyd. IWA Pub.
9. Łomotowski J., Szpindor A. 1999. Nowoczesne systemy oczyszczania ścieków. Wyd. Arkady, Warszawa.
10. Matuszewski G. 2009. Zależność pomiędzy temperaturą powietrza a temperaturą ścieków w me-chaniczno-biologicznych przydomowych oczysz-czalniach stosowanych w indywidualnych gospo-darstwach rolnych. Maszynopis pracy magisterskiej Uniwersytet Przyrodniczy w Poznaniu KIWiS. 11. Patterson R.A. 2003. Temporal variability of
sep-tic tank effluent. In: Patterson R.A. and Jones M.J. (Eds.) Future directions for on-site systems: Best management practice. University of New Eng-land, Armidale, Published by Lanfax Laboratories Armidale.
12. Viraraghavan T. 1977. Influence of temperature on the performance of septic tank systems. Water, Air and Soil Pollution, 7, 103–110.
2. The cause of the boiling phenomenon in the ST
may be the introduction of wastewater of high-er density containing a highhigh-er concentration of the suspension. The effect of cooler water introduction (due to the small differences and
fast equalization of temperatures) on the so-
called boiling phenomenon was not observed. 3. The limitation of the maximum intensity of
outflow from the ST can be achieved by fill -ing the outlet (e.g. in the form of a basket) with a material of low porosity, which increases the
flow resistance and causes a rise in water sur
-face level in the tank. Otherwise, the outflow rate will be comparable to the inflow rate.
REFERENCES
1. Bounds T.R. 1997. Design and performance of sep-tic tanks. Site Characterization and Design of On-site Septic Systems ASTM STP 901. M.S. Beding-er, A.I. Johnson, and J.S. Fleming, Eds., American Society for Testing Materials. Philadelphia. 2. Chmielowski K., Wałęga A., Miernik W. 2009.
Wpływ temperatury powietrza na temperaturę ścieków w przydomowej oczyszczalni z filtrem piaskowym o przepływie pionowym. Infrastruk-tura i Ekologia Terenów Wiejskich, 6, 57–65. 3. Cywiński B., Gdula S., Kempa E., Kurbiel J.,
Płoszański H. 1983. Oczyszczanie ścieków. Oczysz-czanie mechaniczne i chemiczne, Arkady, Warszawa. 4. D’Amato V.A., Bahe A., Bounds T., Comstock B.,
Konsler T., Liehr S K.., Long S. K., Ratanaphruks
Table 2. The characteristic values of outflow at different options and two variants
Option Hot water (variant 1) Cold water (variant 2)
time of outlet [min.] maximum flow outlet [dm3/s] time of outlet [min.] maximum flow outlet [dm3/s]
I 11.5 0.20±0.003 15 0.31±0.004
II 11.5 0.25±0.060 15 0.32±0.037
III 12.5 0.17±0.013 25 0.11±0.000
IV 12.5 0.18±0.018 25 0.10±0.001
V 10 0.26±0.011 16 0.31±0.018