Shaikh MohamadSajjad M. 1, Prajapati Pratik S. 2, Tadha Kaushik U. 3, Tarsariya Hardik K.4
1,2,3,4
UG Student, Mechanical Department, MGITER, Navsari
Abstract - System dynamic (SD) provides a useful interpretation of business contexts, analyzing how policies and decisions affect the structure of companies and the dynamics of the available resources. For this reason, it has successfully applied to many problems related to industrial management and operation research. Due to its ability to model and simulate the complex system for understanding the system behavior over time horizon, it can be applied to Kanban production system to meet the customer demand in right quantity and time. The project work would be based on creating SD model of Kanban production system using ALCARE ENGINEERING using FLANGE manufacturing data. Production data from particular industry and this simulate it over different time horizon to study system behavior and result would be discussion. For project work, we are using SD Software (STELLA 9.0.1) and create the SD Model.
Keywords – system dynamic, Kanban, JIT, Stella software, Kanban production system
I. INTRODUCTION
System dynamic modeling is use to different variable create SD model of given system to understand the structure and behavior. SD model is representing the system structure. the use of computer software in simulation of system behavior and numerical calculation of system dynamics.
System dynamic are used to understand the structure and behavior of system at different time span. It applies on industrial problems like inventory management, supply chain management, production planning and control, demand, capacity and human resource management to solve this problem using Kanban production system. It also mange proper time utilization and increase the productivity and profit.
JUST IN TIME is the manufacturing philosophy that produced and delivers the exactly required items, in the exactly required quantities and at the exactly required time. This is the simplest statement of the JIT approach to manufacturing.
Kanban is the inventory replenishment system. A Kanban technique is use to efficient operational mechanism. Kanban system was first developed by Toyota and also Just in Time (JIT) production philosophy. The Toyota Group organization four prominent gentlemen are credited with developing the system, Sakichi in 1902, Kiichiro Toyota, son of Sakichi Toyota, who headed the automobile manufacturing operations between 1936 and 1950, Eiji Toyoda and Taiichiohno, the father of the KANBAN system.
1.1 USE OF KANBAN SYSTEM
KANBAN System mostly use in management site to manage the plant inventory and other cost. KANBAN Production system is mostly used to planning and scheduling and the controlling the
inventory cost and production costs in industry.
Provides production information and prevents over the production. Inventory reduction to reduced waste and makes the system more sensitive.
KANBAN System creates pulls, provides pick up or transportation information.
KANBAN System is in apply in industry and reduced the transportation and planning time. KANBAN System to used in industry to reduced finish goods time and good service provides to
KANBAN System reducing the replenishment time or reducing the pickup volume by the customer this is usually achieved by increasing the pickup frequency.
KANBAN reducing the variation in the customer demands, which allows buffers stock reductions.
The planning system deal with that the programmer believed should be happening we can say with certainty that when it comes to triggering production with the minimum lead planning time , no planning system can come close to Kanban.
II. BACKGROUND OF THE INVENTION
System dynamic (SD) first developed in 1950 by Jay W. Forrester at Massachusetts institute of technology (MIT). System dynamic is use to existence of complex system, changes of system behavior from time to time. It is closed loop feedback system. This feedback is new information of the system condition for the next decision.
During in 1950 to 1960 in which system dynamics moved from the hand simulation to computer modeling. In 1958 system dynamics modeling languages are developed. This language as simulation of industrial management problems with help of different equation (SIMPLE). It was developed by Richard Bennett. In 1959 in dynamic models (DYNAMO) language developed by Phyllis Fox and Alexander Pugh.
III. OBJECTIVES
- To understand system dynamic methodology and KANBAN production system. - To make system dynamic model of simple KANBAN production.
- To understand behavior of system over time to identify for decision making process.
IV. WORKING METHODOLOGY
STELLA Software is used for System Dynamics. Systems Dynamics are usually very complex having many components is involved in this relationship. In this software will be use an achieve the fates answer and results of the production and other site. in this Stella software in which the different component like stock, flow, converter and connector.
4.1 SD MODELLING AND SIMULATION
System dynamic modeling is feedback processes in which the though constant iteration and iterative cycle. In large cycle for learning and action constantly take place in organization. There are different System Dynamics modeling and simulation software like STELLA, POWERSIM, VENSIM, DYNAMO and ITHINK etc. are available. In these the studies of system modeling generates and simulate the behavior of complex system at difference time.
4.2 STEPS FOR GENRATE SD MODEL
Step 1: - Problem Articulation:
We need to find the real problem, identify, and the key variables and concepts. It is use to understand and designing and solves it.
Step 2: - Dynamic Hypothesis:
In this the causal loop diagram and explain causal links among variables and convert the causal loop diagram into flow diagram.
Step 3: - Formulation:
After above step we convert the causal loop diagram into flow diagram. also, the system description into level, rate and auxiliary equations to define the system dynamic model. We need to estimate some parameters, behaviour relations and initial conditions.
Step 4: - Testing:
Step 5: - Policy Formulation and Evaluation:
In which we can utilize design and evaluation policies for improvement. The interactions of different policies must be also considering because of the real system are highly nonlinear, the impact of combination policies is usually not sum of their impacts alone.
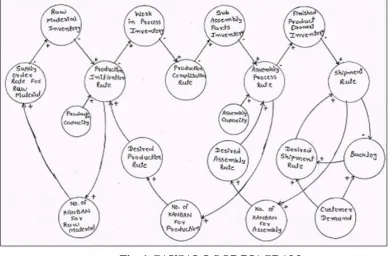
4.3 BASE MODEL (CAUSAL LOOP DIAGRAM) DEVELOPMENT: -
System dynamics in three key roles in which the model is developed. The initial one most significant is the system formation. In this characterizes of system performance. The next is the nature of the arrangement. In this the mind model are used in the system dynamic performance. The third is the important change. It can be used to alter the arrangement. This arrangement is to represent by response loops. in below figure represent the causal loop drawing for single stage
single product Kanban system. It is generating a link connecting structure and decision and also produce organization performance. In this fig.1 causal loop drawing for single step single manufactured goods Kanban structure. It is formed by between different stock, flow and parameter which have an effect on the organization construction and performance by arrows denote the causal influence and linked among variables. this causal loop drawing show cause and result relationships between all the variable. All arrows signify a cause and make connection connecting two or extra variables.
Fig. 1CAUSAL LOOP DIAGRAM
4.4 DESCRIPTION AND RELESTIONSHIP OF VARIABLES
Backlog = Customer demand – Shipment
Desired shipment rate = Customer demand + Backlog
Shipment Rate = Finished product(Goods) / Desired shipment rate. In which minimum is considered.
Number of KANBAN for assembly =Shipment rate of product.
Assembly process rate = Sub assembly parts / Desired assembly rate. In this minimum is considered.
Production initiation rate = Raw material inventory / Production capacity / Desired production rate. In which is minimum is to be considered.
4.5 STELLA MODEL
We are draw or create the STELLA model for our project. In which have use causal loop diagram and its relationship between the different variables. We create the simple system dynamic model on causal loop diagram. this model of system dynamic for single stage single product Kanban system. This model is also called as stock and flow diagram (SFD).In this model backlog, shipment rate, assemble process rate, production initiation rate etc. and also affect the various inventory level, desired supply rate, desired production rate.
TABLE: 1: KANBAN COLLECTION
TABLE: 2: PRODUCTION CAPACITY
V. RESULT AND DISCUSSION
The simulation for single stage single product using STELLA 9.0.1. This software very help full to understand the system behavior over different time horizon. In this simulation production capacity, Kanban, finished good, inventory, backlog, shipment are parameters use and control the production system. We can change the value of different parameter and simulate over different time horizon. Which effect on production system its discuss. The simulation with STELLA 9.0.1 and run SD model the result in graphical form and tabular form at different time.
5.1 RESULT 1:
Fig.3: RESULT 1
NO. OF KANBAN KANBAN FORM
KANBAN_1 DESIRED SHIPMENT RATE
KANBAN_2 PACKING_INI_RATE
KANBAN_3 QUALITY_TESTING_&_REJECTION_INI_RATE
KANBAN_4 BUFFING_&_POLISHING_INI_RATE
KANBAN_5 DRILLING__PROCESS_INI_RATE
KANBAN_6 MACHINING_PROCESS_INI_RATE
KANBAN_7 HEAT_TREATMENT_PROCESS_INI_RATE
KANBAN_8 FORGING_&_STAMPING_INI_RATE
KANBAN_9 HEATING_PROCESS__INITATION_RATE
KANBAN 10 MARKING_PROCESS_INISTION_RATE
KANBAN 11 PURCHASE_ORDER_FOR_RM
PRODUCTION CAPACITY UNIT/DAY
PROD CAPACITY FOR HEATING 22
PROD CAPACITY FOR HEAT TEATMENT 18
PROD CAPACITY FOR PACKING 18
PROD CAPACITY FOR BUFFING &POLISHING 30
PROD CAPACITY FOR CUTTING 30
PROD CAPACITY FOR DRILLING 30
PROD CAPACITY FOR FORGING &STANDING 30
PROD CAPACITY FOR_MACHINING 15
PROD CAPACITY FOR MARKING 30
Now first of all we select the all the inventory at zero level initially. The result on graph in fig.3 all the inventory is zero. When the backlog parameter is initially zero and after half time it will increase, and move to at upward direction. The customer’s demand is 20 shown in graph. The shipment of finished goods as same at costumer’s demand so, this graph is same one constant line. At a time, feedback loop as a Kanban are not working so backlog activity are increase.
5.2 RESULT 2:
Fig.4 :RESULT 2
After first simulation, we are select the capacity and parameter value 15 are enters. We take customer demand’s is 22. After enter this value SD model run and result on shown in fig.4. customer demands are constant at time horizon. Backlog vale initially take 3. After simulation backlog are increase with time. The initial vale of shipment is 0. After simulation graph of shipment rate constantly increase with time and parallel to the backlog graph.
5.3 RESULT 3:
Fig.5 :RESULT 3
customer’s demand of 15 unite per day to finished good. The production is achieved and controlled through Kanban system.
VI. CONSLUSION
After completion of this project work we can conclude that the system dynamic modelling and analysis of Kanban system simulated and production system viewed or information of production line. This simulation helps which parameter is affected to production line. Affected parameter are modified and controlled which fulfil the customers demand through production line. The inventory control at optimum level. Kanban are used to control the production as per customer demand. This Kanban work as a feedback with sent signal to the production line. This work is help full in decision making process and industrial management problems.
REFERENCES
[1] Kaushal K. Patel and S.J Thanki , System Dynamic Modelling And Analysis Of A Single Product Kanban Production System, International Journal Of Innovative Research in June 2013, ISSN : 2319 -8753
[2] Palet K.K, Thanki S.J, SystemDynamics:A Modellingand Simulation Tool for Decision - Making In Industrial Management Problems, International Conference on Innovation in Automation and Mechatronics Engineering 2013 (ICIAME 2013), 21-23 February 2013
[3] G.G Sastry, Dr. M. Saxena, Dr. Nitin Upadhya , A Review On Pull Control System In Manufacturing , International Journal of Emerging trends in Engineering and Development. Issue 2, Vol. 7 (November 2012), ISSN 2249-6149
[4] C.L. Lai, W.B. Lee, W.H. Ip, A Study Of System Dynamics In Just - In -Time Logistics , Journal of Materials processing technology 138 (2003) 265-269
[5] Jens Ehm and Michael Freitag,the Benefit of Integrating Production and Transport Scheduling, 48th CIRP Conference on MANUFACTURING SYSTEMS- CIRP CMS 2015, Procedia CIRP 41 (2016) 585-590
[6] Yunmdei Fang and JuntaoFei, Optimal Design of flexible Kanban System for A Multi –Stage Manufacturing Line , Informational Journal of Innovative Computing , Information and Control Volume 10, Numer 5, October 2014, ICIC International @ 2014 ISSN 1349-4198, pp. 1885-1896
[7] Kenichi Nakashima, SurendraM. Gupta, A Study On The Risk Management Of Multi Kanban System In A Closed Loop Supply Chain, INT. J. Production Economics 139 (2012) 65-68