High-Order Finite Difference Modeling and Simulation
Analysis of Microstrip Patch Antenna
Gurinder Singh
Dept. of Electronics and Communication, NIT Mizoram, Aizawl, Mizoram, India
Abstract
In this paper, higher order finite difference scheme namely FDTD (2,4) scheme has been used for analysis of Microstrip Patch Antenna. The Uniaxial Perfectly Matched Layer (UPML) has been used as an absorbing boundary condition to terminate the computational domain. To justify higher order computational efficiency achieved by this method, the results have been compared with the conventional FDTD (2,2) method.
Keywords
FDTD (2,2), FDTD(2,4), UPML.
I. FDTD(2,4) scheme
The FDTD (2,4) scheme uses central finite differences which is fourth-order-accurate in space and second-order-accurate in time [2]. Using taylor series expansion, we have
using above equations, the first derivative of F(x, y, z) wth respect to x can be found as:
More accuracy in approximation to derivatives are given by higher-order finite-difference schemes. The derivation of Courant stability criterion for the FDTD (2,4) scheme was given by Fang [3] as
2 2 2 1 1
1 1 7 6 z y x c t ∆ + ∆ + ∆ ≤
∆ (7)
This gives limit on maximum time step size that can be used for simulation. Numerical experiments shows that higher order FDTD suffers comparatively less numerical dispersion as compared to standard FDTD (2,2) method. In next section, broadband analysis of microstrip patch antenna is carried out using 3D FDTD(2,4)-UPML method and results have been compared with conventional FDTD and expected theoretical result.
II. 3D-FDTD UPML Formulation
The Uniaxial Perfectly Matched Layer (UPML) is artificial anisotropic absorbing material that is theoretically designed to allow no reflections regardless of the frequency, any polarization and angle of incidence of any plane wave upon it’s interface. Thus, it is type of Absorbing Boundary Condition (ABC) that is used to terminate the computational domain. The maxwell’s equation in an anisotropic medium can be expressed as follows:
(8)
(9)
Here, E and H are the electric and magnetic field intensity vectors
repectively with components in phasor form and s is diagonal
tensor given as
s
=
z y x y z x x z ys
s
s
s
s
s
s
s
s
0
0
0
0
0
0
Here,
s
x,s
y ands
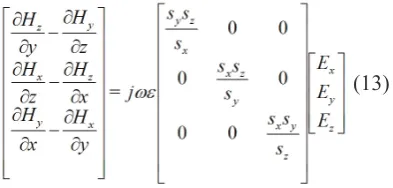
z represents relative complex permittivitiesThe equation (8) and (9) can be given in three scalar PDEs as
(13)
The relation between electric flux density and electric field intensity components are given as:
Substituting (14), (15) and (16) into (13) results in
The above mentioned frequency domain PDEs can be converted
into time domain PDEs using transformation .
+ ∂ ∂ ∂ ∂ − ∂ ∂ ∂ ∂ − ∂ ∂ ∂ ∂ − ∂ ∂ z y x x z y x y z x y z D D D k k k t y H x H x H z H z H y H 0 0 0 0 0 0 =
Using same analogy, equation (9) can be reformulated as
The time domain PDEs for relating electric field intensity and electric flux density can be rearranged and calculated as
Similarly, the time domain PDEs for relating magnetic field intensity and magnetic flux density can be rearranged and calculated as
Thus, there are are 12 update equations i.e for Dx, Dy, Dz, Ex,
y
E , Ez, Bx, By, Bz, Hx, Hy and Hz. All the update equations
were carefully derived and are given in appendix for reference.
A. Computational Space Parameters
In FDTD, different materials can be modelled by varying values of x
k , ky, kz, and . Isotropic material can be modelled
by using
k
x=k
y=k
z=1, = = = , where is theconductivity of the material.
For corner UPML region, a combination of two or more are used.
For corners shown in fig. 1, varies.
The parameter and are graded geometrically along the normal
axis of UPML region in order to obtain gradual attenuation of any incident wave on the UPML. The geometric grading equations are given as
(26)
(27)
Here, u is the normal distance between the point where the parameter is calculated and UPML computational space boundary.
∆ is the spatial discretization interval, i.e ∆=max(∆x, ∆y, ∆z) and g, are constant.
III. Broadband Analysis Using FDTD (2,4) Scheme
Three dimensional FDTD with UPML was implemented in MATLAB version 15b. The main objective was to simulate the rectangular patch antenna shown in Fig. 2. The length and width of the antenna are L=16.2mm W=12.45mm respectively. The height of the substrate and substrate dielectric constant are h = 0.795mm and 2.2 respectively [3]. The simulation results can be used to obtain S11 (dB) vs. frequency of this antenna.
Fig. 2: Microstrip Line Fed Rectangular Patch Antenna (not to Actual Scale). Here, TP and SP Represents Terminal and Source Plane Respectively [5].
A. FDTD Simulation Details
× ×
B. Simulation Result
The response of the microstrip line fed patch antenna after 5488 steps of iterations has been shown in Fig. 3. It can be seen that there is significantly less distortion after the trailing edge of the Gaussian pulse, which in turn yield better accurate result. It can be noticed that once pulse has passed through the terminal plane, the fields are nearly zero. This is due to UPML, which will absorb the pulse. This shows the effectiveness of the UPML. Further, it is depicted from figure that the reflected wave can be obtained by simply subtracting the incident wave from total wave [4].
Fig. 3: Response of the Microstrip Line Fed Patch Antenna after 5488 steps of iterations [subtracting input Ez data upto 500 steps from the total Ez gives reflected wave]
C. Microstrip Antenna Resonant Frequency
Cavity model of microstrip patch antennas can be used to obtain approximated resonant frequencies values. The operating frequency of the antenna is obtained from the higher mode. The
higher mode after the dominant mode is TM020. The corresponding
resonant frequency for this mode is given as
(28)
where,
v
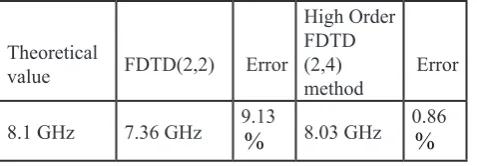
0 is the velocity of light in free space. This value is calculated as (fr)020=8.1GHz. It can be seen from the Fig. 4 thatTable 1: Comparison of operating frequency of cavity using conventional FDTD, Higher Order FDTD (2,4) method and theoretical calculation.
Theoretical
value FDTD(2,2) Error
High Order FDTD (2,4)
method Error
8.1 GHz 7.36 GHz 9.13
%
8.03 GHz 0.86%
IV. Conclusion
In this paper, a comparitive study has been made between FDTD(2,2) and FDTD(2,4) method. It has been found that the higher order FDTD (2,4) method yields more accurate result as compared to conventional FDTD (2,2) method. However, the simulation time required for FDTD (2,4) method is slightly more than FDTD (2,2). It is expected that there can be significant reduction in simulation if any unconditionally stable implicit FDTD method is used for the same analysis.
Appendix
[3D FDTD(2,4)-UPML update equation]
x
D
update equationy
D
update equationz
D
update equationx
E
update equationy
E
update equationz
E update equation
Bx update equation
Bz update equation
Hx update equation
Hy update equation
Hz update equation
References
[1] A. Taflove, S. C. Hagness,"Computational Electrodynamics: The Finite-Difference Time- Domain Method", Norwood, MA, Artech House, 2005.
[2] Georgakopoulos, Stavros V., et al.,“Higher-order finite-difference schemes for electro- magnetic radiation, scattering, and penetration. 2. applications”, Antennas and Propagation
[5] C. A. Balanis,"Antenna Theory: Analysis and Design", 3rd Edition, John Wiley Sons 2005.
[6] D. M. Sheen, S. M. Ali, M. D. Abouzahra, J. A.Kong, "Application of the Three Dimensional Finite Difference Time-Domain Method to the Analysis of Planar Microstrip Circuits, IEEE Transactions on Microwave Theory and Techniques, Vol. 38, No. 7, July 1990.
[7] M. Zweki, R. A. Abd,“Alhameed, M. A. Mangoud, P. S. Excell, J. A. Vaul,“Broadband Analysis of Finite Microstrip Patch Antenna Structure using FDTD, 11th International Conference on Antennas and Propagation, UMIST, Manchester, UK, April 2001.
[8] C. Wu, K. Wu, Z. Bi, J. Litva,"Accurate Characterization of Planar Printed Antennas using Finite Difference Time Domain method", IEEE Transactions on Antennas and Propagation, Vol. 40, May 1992.
![Fig. 2: Microstrip Line Fed Rectangular Patch Antenna (not to Actual Scale). Here, TP and SP Represents Terminal and Source Plane Respectively [5].](https://thumb-us.123doks.com/thumbv2/123dok_us/1337168.1642274/3.595.38.292.367.635/microstrip-rectangular-antenna-actual-represents-terminal-source-respectively.webp)