Design and Implementation Wind Turbine Power
Control System Base Particle Swam Optimization
at Low Rate Wind Farm
Ali Musyafa*, Imam Abadi, Ronny Dwi Noriyati, M. Faiz Afif and M.Khamim Asy’ari
Abstract—The main issue that must be considered in finding new renewable energy sources is the availability of unlimited energy sources. One of the energy sources in question is wind energy. By designing and developing a wind power system, especially the electronic system, the system is able to produce optimum electrical energy. The voltage that comes out of the generator is then inputted to the buck-boost converter device which produces an output voltage whose value is higher or lower than the generator output voltage. The electrical voltage of the generator product is controlled through a microcontroller in the form of arduino uno with the PID-PSO method to get the voltage according to the design. By adjusting the voltage, the voltage is expected to be 13V, from the wind power plant being developed. From the Buck-boost converter control system simulation, the best control parameters are obtained; Kp = 7.60, Ki = 0.66, and Kd = 0.56. The buck-boost converter controls voltage. System performance is obtained by the value of Rise Time (Tr) = 0.37 seconds, settling time (Ts) = 0.39 seconds, delay time (Td) = 0.20 seconds, and Peak time (Tp) = 0.39 seconds.
Index Term— Converter, Control, Generator, PSO, Turbine.
I. INTRODUCTION
Isue Currently the most flexible main energy source is to convert primary energy into electrical energy, which is dominated by fossil energy sources where currently available reserves are increasingly depleting and increasingly limited. Therefore, it is necessary to find alternative energy sources produced through natural processes so that they will not run out quickly or recover quickly if managed properly. This alternative energy source must be a new renewable energy. Some energy sources that are currently being developed are sources of wind energy, solar energy, geothermal energy, and others. Among the new renewable energy sources in Indonesia, wind energy is an energy source that still has a small utilization rate, which is 3.07 MW or about 0.03% of the available potential [1].
This work was supported in part by Institute for Research and Community Service (LPPM ITS), Institut Teknologi Sepuluh Nopember, Surabaya. with
supporting financing the research. Also, the authors would like to thank the anonymous referees for their comments on the eelier version of this work.
Ali Musyafa: Department of Engineering Physics, Faculty of Industrial Technology, Institut Teknologi Sepuluh Nopember Surabaya, 60111, Indonesia, (corresponding author to provide phone:+62087851240830; fax:
+62-031-5923625; e-mail: [email protected] ).Ronny Dwi Noriyati and
Imam Abadi Lecterer, M. Faiz Afif and M.K. Asy’ari. He is now Student with the Department of Enginering Physics, Faculty of Industrial Technology, Institut Teknologi Sepuluh Nopember Surabaya ; e-mail:[email protected]; [email protected];[email protected];;
Indonesia's geographical position as a tropical country
located around the equator causes wind characteristics in Indonesia to be very different from wind characteristics in subtropics countries that have used wind power as a supplier of electrical energy. Some wind characteristics in Indonesia include relatively low wind speeds (3-6 m / s) and tend to fluctuate. The difference in the characteristics of the wind causes the electrical energy produced by wind turbines in the Wind Energy Conversion System (SKEA) in the tropics, especially in Indonesia is not optimal and is active. Some of the parameters that are the source of the ineffectiveness of electrical energy produced by wind turbines are electricity production with output voltages that tend to be small and variable following the pattern of wind speed variations which are then converted in wind turbines into electricity [1].
DC-DC switching type power converters, also known as DC Chopper, are used primarily for providing DC output voltages whose levels vary according to load demand. The input power of the DC-DC process comes from a DC power source and has a fixed input voltage. Basically the desired DC output voltage can be achieved by adjusting the length of the connecting time between the output side and the input side of the same circuit. The components used to run the connecting function are switches (solid state electronic switches) such as the Thruster, MOSFET, IGBT, and GTO [2].
Buck-boost converter is one type of DC chopper that has a function to stabilize voltage by raising and lowering the voltage [3]. In this study, the wind turbine system sought mathematical models first. The process of optimization of the output power of the wind turbine system is carried out by applying the particle swarm optimization (PSO) method in varying wind speed variations.
II. MATERIAL AND METHOD
2.1. The Procedure of Research
In this sub-chapter, explained all the research procedures that will be done so that the objectives of this research can be achieved. The procedure is described through a flowchart shown in Figure 3.1. The following is a description of several stages in the design and development of wind turbines and the PID-PSO controller in the buck boost converter.
which is then assembled and tested as a whole. Then monitor the performance of the wind turbine. Designing a Buck-Boost Converter; tested and monitored in real time, system modeling is then tested, whether modeling can represent the actual factory. Furthermore, the PID control system is designed in the wind turbine.
Determining the parameters of the PID controller using PSO; The search phase of the PID control parameter is passed using the PSO method. In the optimization process, several PSO optimization parameters are needed such as determining the number of individuals in a population, determining the position value, speed, determining the number of iterations and determining the inertial weight value. The search results of the PID parameter value are then applied to the real plant wind turbine system.
PID-PSO control system design; The PID-PSO control system is done by finding the PID parameters (Kp, Ki, Kd) using the PSO algorithm in simulation through MATLAB. The process of tuning the PID parameter using the PSO algorithm for the plant is shown in Figure 1. Control Systems for Buck-Boost Converter for Wind Turbines; In system testing, is a tracking set point test for the wind turbine pitch angle control system in a real plant. Set point and given a variation with the maximum rpm limit that can be achieved by the wind turbine.
The stages of designing the PID control system are as follows: Plant modeling or system to be controlled. In this study the plant modeled in the form of a transfer function that has been discussed in the previous sub-chapter. Determine the fitness function or destination function. The objective function of the PID controller design method selected in this study uses integral performance criteria of time-weighted absolute error
(ITAE), ITAE =0∫∞ tet dt (1)
Determine the optimization limit function; The boundary function is the minimum criteria that must be achieved by the desired PSO algorithm. The limit function criteria in this study is the time to complete the system performance from the Ziegler Nichols controller. Compile the PSO-PID algorithm, specify the PSO parameters; Tuning, reasoning is done by providing input steps in the system as shown in Figure 2. The dotted line shows the tuning process. After getting the PID parameter value, the dashed line has been used again.
Fig. 1. Diagram Block of PID-PSO Controller
Determination of the value of Gbest; Alternately each particle initializes with all three values entered as PID controller, produces control system performance values. The particle that produces the smallest ITAE value is the current Gbest and becomes a reference for the movement of other particle positions in the next iteration. Processing and analysis of data; All test data and wind turbine specification data are then processed and analyzed for each performance. Data processing results are then analyzed which are related to their advantages and disadvantages.
2.2. Design of Wind Turbine
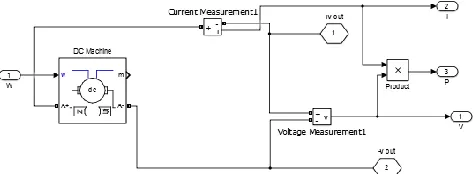
Design simulation using Matlab. Simulation using software aims to compare the performance of the system to the design results. There are three stages of simulation with Matlab software, namely generator simulation, buck-boost converter simulation, and PID control simulation. The block diagram in each Matlab simulink is shown in Figure 2. Generator which is a DC generator. This is seen to produce DC Output voltage. The input from the generator is the angular velocity that has been equipped with the turbine angina rotor. The output variable of the generator is current and voltage..
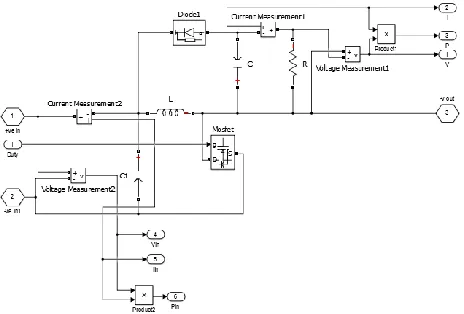
Fig. 3. Block Diagram of Buck-boost Converter
The block diagram buck boss converter shown in Figure 4. The buck boost converter circuit in this study aims to stabilize the generator current and voltage.
Fig. 4. Block Diagram of PID Control
The PID control block diagram is shown in Figure 5. This PID control is used to control the PWM on the Mosfet buck boost converter. The input from PID is an error, which is obtained from the output voltage minus the set point. The overall design and development of angina turbine is shown in Figure 6. The design in question includes the speed of the rotor angle of the blade, DC generator, buck boost converter, PID control, and optimization using PSO.
Fig. 6. Block Diagram of Design Wind Turbine
The constituent components used in the manufacture of wind turbines include blades, generators, blade supports, support poles, rotary encoder, voltage sensors, LCD, main plate, and Arduino Uno modules. The following is an explanation of the specifications of the components of the wind turbine.
The first component is a wind turbine blade. The wind turbine blade design used uses the NREL S835 standard type, at the bottom, type S833 in the middle and type S834 at the end of the blade. The length of the turbine blade built has a dimension of 1.1 m. The physical cross section of the wind turbine blade is shown in Figure 7. The constituent material used is glass fiber material which is then coated with paint so that the material is relatively light. Blades are used by 3 wind turbines. all three blades are conditioned with the same weight = 990 grams. At the bottom of the blade is connected to the bearing to smooth the movement of the blade when it is driven by a servo motor and at the end is connected to the gear.
Support is made of acrylic material with dimensions = 28 cm and thickness = 1.5 cm. In the turbine support in the center part is combined with iron which is used as a shaft for wind turbine rotation. All components attached to PVC support will rotate as long as the wind turbine moves. As long as the turbine shaft moves, the sensor for reading the rotation speed of the wind turbine is also needed. In this design, the rotary encoder sensor is used to determine the rpm (Rotation Per Minute) of the wind turbine rotation. The rpm value is analogous to the amount of power output from the wind turbine when given wind power. The greater the rpm of the turbine shaft, the wind turbine power output is also large.
Adriano Uno is a microcontroller board based on ATmega328. The Adriano Uno has 14 digital input / output pins (6 of which can be used as PWM outputs), 6 analog inputs, a 16 MHz crystal oscillator, a USB connection, a power jack, an ICSP header, and a reset button. Adriano Uno contains everything needed to support the microcontroller, easily connecting it to a computer with a USB cable or providing it with an AC adapter to DC or using a battery to start it.
The rotary encoder used has 16 holes. When the wind turbine rotates, the disc is rotated and reads the rotation with the interrupt mechanism. With this mechanism, large rpm (Rotation Per Minute) measurements from wind turbines are carried out. To determine the rotary encoder performance, the rotary encoder was tested using an electric motor with variations in input voltage and the rpm value of the rotary encoder was tested by measuring using a Tachometer. The processor used in this design is the Adriano Uno processor. The pin used includes the Vic pin, Gnd, pin 2 as the interrupt pin for the rotary encoder sensor.
numbers, letters or symbols better and with low current consumption. LCD (Liquid Cristal Display) dot M1632 matrix is an LCD module made by Hitachi. LCD (Liquid Cristal Display) module M1632 dot matrix consists of a character viewer (LCD) that serves to display the character and system part of the LCD processor in the form of a module with a microcontroller placed on the back of the LCD which functions to adjust the LCD display and manage communication between the LCD and microcontroller that uses the LCD module.
Buck boost converter is a module that is used to increase and decrease the regulated voltage using the PWM duty cycle value at the mosfet. The input voltage that is set is the output of the dc generator in the wind turbine. Main plate (Center plate) is used to support turbine blade shafts, power circuits, optocouplers and Arduino. The material used is iron with a diameter of 40 cm and 0.2 cm. The entire component of the wind turbine is then supported by a support pole. The overall shape of the wind turbine protype is shown in Figure 7.
Fig. 7. Prototype of Wind Turbine
Sensor Calibration; Calibration of the voltage sensor aims to determine the value of the uncertainty of the measurement results. The voltage sensor calibration is carried out by the following procedure: measurement and recording with a voltage sensor and millimeters against the power supply voltage five times at a value of 12 Volts, then measuring and recording with a voltage sensor and millimeters to the power supply output Voltage ten times with a range of 1 Volt starting from 11 Volts to 20 Volts, calculation of UA1, UA2, UB1 and Uexp values
Search for PID Controller Parameters using the PSO method; The PSO algorithm is built using the Matlab application in the form of m files integrated with simulink from the wind turbine pitch control system. The objective function in this problem is the minimum value of IAE (Integral Absolute Error) which is the error area value
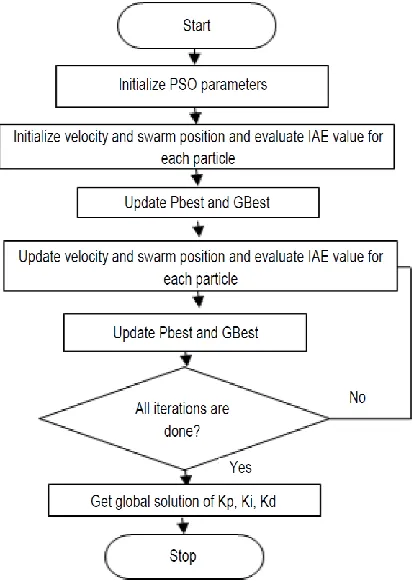
between the set point and the system response. While the optimized variable is the PID control parameter value, that is the gain value of Kp, Ti and Td. The PID-PSO tuning flow chart is shown in Figure 8.
Fig. 8. Flow Chart of optimization Using PSO
The first step that must be done in tuning PID control parameters is by determining the number of individuals in one population, determining the position and speed values, determining the number of iterations and determining the inertial weight value. After that, an evaluation of the fitness value for each initial particle value is obtained. Evaluating the fitness value in this case is the search for the error area value between the set points with the signal formed, so the evaluation of the fitness value is done using simulations on Simulink. This is the point of integration between the PSO algorithm file and simulink simulation of the closed loop system created.
control parameters using the PSO algorithm. Thus, this value will be used as a PID control parameter value.
2.3. Realization Control of Voltage Generator
At this stage, integration between hardware and software is carried out. Hardware in this case consists of a wind turbine plant, with an optocoupler voltage output for reading rpm values, an arduino module, and a personal computer as a monitoring medium. The program implemented on the Arduino module is a rpm value reading program, a PID control program and a program to display the rpm value and the time it takes.
The tuning results of PID control parameters using PSO are then implemented into the Arduino Uno processor. The implementation uses a programming language that can be translated by the processor, the C Setpoint programming language at this stage is included in the amount of voltage value that is desired to be maintained by the wind turbine system. Then compared with the voltage that is being generated which is then searched for the difference value, or in this case called the error value. The error value is then entered into the PID Control to change the signal to the input value for the buck-boost converter.
In this stage, the PID controller logic is first converted into C language. Therefore, the PID controller in the discrete time domain is needed first. Here are the similarities (Sunarto, 2011):
U(k) = Kp e(k) + Ki Tc [e(0) +... + e(k-1) + e(k)] +
Kd [e(k) – e(k-1)] / Tc
(2)
Where,
U(k): Discrete signal
Kp: Gain proportional control Ki: Integral control gain Kd: Gain derivative control e (k): current iteration error e (k-1): previous iteration error
The equation is then converted into C programming language and then used as the actuator input in this case is the buck-boost converter position value. The following is done by testing the voltage converter control system in hardware and software. Testing is done by providing a target value or set point in the Arduino program, then monitoring the rpm value of the system every second. The results of monitoring the rpm value are then described in the form of a diagram. The test results are analyzed for performance criteria such as time settling, maximum overshoot, and the rise time value. then compared with the results of the test before being given control on the simulation and real plant.
2.4. Tuning of Kp, Ki. Kd Using PSO Algorithm
In this section, the process of tuning the PID parameters with the PSO algorithm and the DC motor response with the
PSO-PID controller is generated. The following is a description and explanation of the process of tuning the PID parameters with the PSO algorithm. Initialization All swarm particles are initialized, where each particle has 3 values (Kp, Ti, and Td) and that is the starting position. The initial position is Pbest for each particle until the next iteration.
Determination of the value of Gbest; Alternately each particle initializes with all three values that are entered as a PID controller, resulting in a control system performance value. The particle that produces the smallest ITAE value is the current Gbest and becomes a reference for the movement of the position of other particles in the next iteration.
Iteration and position updates; By knowing the Pbest value for each particle and the Gbest value as a reference for movement, in the next iteration each particle changes position (Kp, Ti,Td). This position is used to find the minimum ITAE value. So on until reaching the criteria. The PSO parameters used are :
Dimensions: 3 (representing Kp, Ki, Kd) Maximum iteration: 5
The upper limit of Kp, Ki, Kd: 8, 0.7, 0.6 Lower limit Kp, Ki, Kd: 0,0,0
III. CONTROL SYSTEM
3.1. Simulation Using Matlab Programe
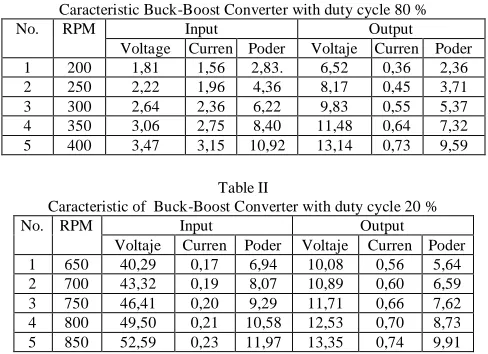
Buck-Boost converter characteristic test is carried out with a buck-boost converter circuit simulation with Matlab software aimed to determine the effect of the parameters or electric circuit of the buck-boost converter on the response generated. The parameters that affect the response of the buck-boost converter circuit are the input voltage (Vin) and the duty cycle value. This simulation is carried out in an open loop with input voltage variations. From the modeling results obtained parameter values in the buck-boost converter with a switching frequency of 28,000, resistor 18 Ω, and inductor 470 µh.
Table I
Caracteristic Buck-Boost Converter with duty cycle 80 %
No. RPM Input Output
Voltage Curren Poder Voltaje Curren Poder
1 200 1,81 1,56 2,83. 6,52 0,36 2,36
2 250 2,22 1,96 4,36 8,17 0,45 3,71
3 300 2,64 2,36 6,22 9,83 0,55 5,37
4 350 3,06 2,75 8,40 11,48 0,64 7,32
5 400 3,47 3,15 10,92 13,14 0,73 9,59
Table II
Caracteristic of Buck-Boost Converter with duty cycle 20 %
No. RPM Input Output
Voltaje Curren Poder Voltaje Curren Poder
1 650 40,29 0,17 6,94 10,08 0,56 5,64
2 700 43,32 0,19 8,07 10,89 0,60 6,59
3 750 46,41 0,20 9,29 11,71 0,66 7,62
4 800 49,50 0,21 10,58 12,53 0,70 8,73
Table I-II, show the results of buck-boost converter characteristics with 80% and 20% duty cycles. The purpose of this test is to determine the rpm limit with a duty cycle of 20% to 80%. The Rpm that can be received by this system to reach the 13v set point is at a minimum value of 400 rpm and a maximum of 850 rpm.
3.2.Response of Open Loop Buck-boost Converter
From the same simulation done with a 50% duty cycle, an open loop buck-boost converter response is shown in the following figure 9:
Fig. 9. Response of open Loop System with variation RPM.
3.3.Calculation Gain PID Control
Table III Gain of Controller PID
No Kp Ti Td Ki Kd
1 P 6,60 ∞ 0,00 0,00 0,00
2 PI 5,94 8,30 0,00 0.72 0,00
3 PID 8,00 13,30 0,08 0,70 0,60
Table III shows the results of the calculation of the PID control gain value obtained by matlab simulation obtained values of Kp = 8.00, Ki = 0.70, and Kd = 0.60.
3.4.Response of Cosed Loop Buck-Boost Converter
Figure 10. shows the open loop response with the rpm variation of the generator via matlab simulation.
Fig. 10. Response of PID Control System
Table IV
Performance of PID Control with Vout rate=13 volt
No. R
P M
Delay time
(s) Rise time (s)
Peak time (s)
Max. overshoo
t (%)
Set. time (s)
E S S
1 400 0,25 0,34 0,38 0,00 0,38 0,00
2 500 0,24 0,34 0,38 0,00 0,38 0,00
3 600 0,24 0,35 0,39 0,00 0,39 0,00
4 700 0,25 0,36 0,39 0,00 0,39 0,00
5 800 0,24 0,37 0,40 0,00 0,40 0,01
Fig. 11. Response of PID-PSO Control System
Figure 10-11. shows the response of PID and PID-PSO control systems. Both responses with the same rpm variation but produce different output voltages. From the results of the two responses, it was analyzed that the PID-PSO response was closer to the set point.
Table V
Performance of PID-PSO Control with Vout=13 V
No. RPM Delay
time (s)
Rise time (s)
Peak time (s)
Max. overshoot
(%)
Settling time (s)
ESS
1 400 0,19 0,33 0,37 0,00 0,37 0,00
2 500 0,19 0,35 0,38 0,00 0,38 0,00
3 600 0,20 0,36 0,38 0,00 0,38 0,00
4 700 0,20 0,37 0,38 0,00 0,38 0,00
5 800 0,20 0,37 0,39 0,00 0,39 0,00
IV. ANALYSIS AND DISCUSSION
Performance Testing of Wind Turbine Generator; Testing is done by connecting the generator to the motor. Motor speed is set using a dimmer. At each given motor speed produces angular velocity variations of the wind turbine generator.
4.1. Testing of System Without Load and Using Load
Table VI
Performance Testing of Generador With out Rload
No. RPM Voltage Output
1 77 4,17
2 134 7,88
3 187 10,85
4 212 12,26
5 256 14,64
6 311 18,32
7 355 20,65
8 396 24,89
9 450 27,72
10 498 30,87
The purpose of testing this generator without load is to find out the characteristics of the generator. The higher the rpm, the greater the output voltage of the generator.
Table VII
Performance Test of Generador with R= 10 Ω
No. RPM Current Voltage Power
1 52 0,26 2,40 0,62
2 101 0,26 2,60 0,67
3 104 0,27 2,90 0,78
4 109 0,28 3,30 0,92
5 133 0,37 3,80 1,40
6 135 0,39 4,00 1,56
7 138 0,41 4,10 1,68
8 140 0,45 4,40 1,98
Table VIII
Performance Test of Generador with R= 27 Ω
No. RPM Current Voltage Power
1 70 0,17 4,50 0,77
2 133 0,17 4,70 0,80
3 135 0,17 4,90 0,83
4 143 0,17 5,00 0,85
5 161 0,29 7,70 2,23
6 164 0,32 8,50 2,72
7 172 0,34 8,80 2,99
8 177 0,35 9,10 3,19
Table VII-VIII shows that when there is an increase in rpm in the generator, the current and voltage increase. Comparison of current and voltage when given a load of 10 Ω and 27 Ω shows that the current when given a load of 10 big is greater than the load of 27 Ω, but the voltage is smaller.
3.5.Testing of Buck-Boost Converter
This test is carried out by 2 data retrieval comparisons. Efficiency of buck-boost converter with constant torque generator. First the data collection with the same resistor and inductor is different, the second with the same inductor and the resistor \ is different. Retrieval of data with a switching frequency of 28000 and Resistors = 47 Ω with variations in duty on the real plant is shown in table 4.6-7.
Table IX
Buck boost converter with inductor 470 µh
No RPM Duty Vin Iin Pin Vout Iout Pout Eff.
1 151.00 20 % 9,10 0,01 0,09 2,43 0,02 0,05 53 %
2 149.00 25 % 8,70 0,02 0,17 2,50 0,03 0,08 43 %
3 149.00 30 % 8,60 0,02 0,17 2,88 0,05 0,14 84 %
4 147.00 35 % 8,40 0,04 0,34 3,35 0,05 0,17 50 %
5 140.00 40 % 7,93 0,06 0,48 4,40 0,07 0,31 65 %
6 136.00 45 % 7,30 0,08 0,58 4,44 0,07 0,31 53 %
7 126.00 50 % 6,55 0,11 0,72 5,10 0,09 0,46 64 %
8 126.00 55 % 6,10 0,14 0,85 5,33 0,10 0,53 62 %
9 125.00 60 % 5,30 0,19 1,01 5,62 0,10 0,56 56 %
10 115.00 65 % 4,60 0,22 1,01 5,72 0,10 0,57 57 %
11 103.00 70 % 3,76 0,26 0,98 5,84 0,09 0,53 54 %
Table X
Buck boost converter with inductor 150 µh
No. RPM Duty Vin Iin Pin Vout Iout Pout Eff.
1 136.00 20 % 7,52 0,03 0,23 3,05 0,06 0,18 81 %
2 135.00 25 % 7,36 0,04 0,29 3,49 0,07 0,24 83 %
3 134.00 30 % 7,19 0,06 0,43 3,90 0,08 0,31 72 %
4 133.00 35 % 6,51 0,08 0,52 4,13 0,09 0,37 71 %
5 127.00 40 % 6,12 0,10 0,61 4,92 0,10 0,49 80 %
6 125.00 45 % 5,97 0,12 0,72 5,07 0,10 0,51 71 %
7 123.00 50 % 5,71 0,14 0,80 5,40 0,11 0,59 74 %
8 115.00 55 % 5,20 0,16 0,83 5,57 0,11 0,61 74 %
9 109.00 60 % 4,78 0,18 0,86 5,44 0,11 0,60 70 %
10 103.00 65 % 3,98 0,22 0,88 5,68 0,12 0,68 78 %
11 90.00 70 % 3,03 0,27 0,82 5,70 0,11 0,63 77 %
Comparison of the power efficiency of Table 9 and Table 10 shows the greatest power efficiency of a 150 µh inductor, with a large output voltage but a small output current. Retrieval of data with a switching frequency of 28000 and a 150 µh inductor with variations of duty on the real plant are shown in Table XI-XII .
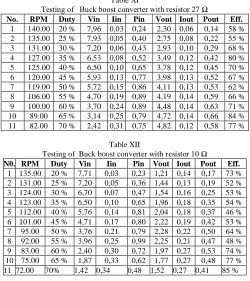
Table XI
Testing of Buck boost converter with resistor 27 Ω
No. RPM Duty Vin Iin Pin Vout Iout Pout Eff.
1 140.00 20 % 7,96 0,03 0,24 2,30 0,06 0,14 58 %
2 135.00 25 % 7,93 0,05 0,40 2,75 0,08 0,22 55 %
3 131.00 30 % 7,20 0,06 0,43 2,93 0,10 0,29 68 %
4 127.00 35 % 6,53 0,08 0,52 3,49 0,12 0,42 80 %
5 125.00 40 % 6,50 0,10 0,65 3,78 0,12 0,45 70 %
6 120.00 45 % 5,93 0,13 0,77 3,98 0,13 0,52 67 %
7 119.00 50 % 5,72 0,15 0,86 4,11 0,13 0,53 62 %
8 106.00 55 % 4,70 0,19 0,89 4,19 0,14 0,59 66 %
9 100.00 60 % 3,70 0,24 0,89 4,48 0,14 0,63 71 %
10 89.00 65 % 3,14 0,25 0,79 4,72 0,14 0,66 84 %
11 82.00 70 % 2,42 0,31 0,75 4,82 0,12 0,58 77 %
Table XII
Testing of Buck boost converter with resistor 10 Ω
N0. RPM Duty Vin Iin Pin Vout Iout Pout Eff.
1 135.00 20 % 7,71 0,03 0,23 1,21 0,14 0,17 73 %
2 131.00 25 % 7,20 0,05 0,36 1,44 0,13 0,19 52 %
3 124.00 30 % 6,70 0,07 0,47 1,54 0,16 0,25 53 %
4 123.00 35 % 6,50 0,10 0,65 1,96 0,18 0,35 54 %
5 112.00 40 % 5,76 0,14 0,81 2,04 0,18 0,37 46 %
6 101.00 45 % 4,71 0,17 0,80 2,22 0,19 0,42 53 %
7 95.00 50 % 3,76 0,21 0,79 2,28 0,22 0,50 64 %
8 92.00 55 % 3,96 0,25 0,99 2,25 0,21 0,47 48 %
9 83.00 60 % 2,40 0,30 0,72 1,97 0,27 0,53 74 %
10 75.00 65 % 1,87 0,33 0,62 1,77 0,27 0,48 77 %
Comparison of the efficiency of Table XI and Table XII shows the greatest power efficiency on a 10 resistor, with a large output current but a small output voltage.
3.6.Testing PID-PSO Control in Buck-Boost Converter
Testing is done by controlling buck boost converter using PID-PSO control with constraints Kp min = 0, Ki min = 0, Kd min = 0, and Kp max = 8, Ki max = 0.7, and Kd max = 0.6.
Table XIII
Testing PID-PSO control on Buck Boost Converter
RPM Duty cycle Input Output Error
Voltage Current Power Voltage Current Power
30 73 0,78 0,07 0,05 0,86 0,03 0,03 12,14
44 72 1,13 0,14 0,16 1,50 0,02 0,03 11,50
46 71 1,38 0,19 0,26 1,87 0,02 0,04 11,13
68 68 2,38 0,07 0,17 3,58 0,03 0,11 9,42
76 65 3,55 0,08 0,28 4,70 0,06 0,28 8,30
99 67 3,68 0,12 0,44 4,09 0,09 0,37 8,91
110 64 3,89 0,14 0,54 5,19 0,08 0,42 7,81
115 63 4,04 0,13 0,53 5,64 0,08 0,45 7,36
126 61 5,21 0,18 0,94 6,82 0,11 0,75 6,18
129 61 5,72 0,21 1,20 6,83 0,11 0,75 6,17
154 61 6,42 0,21 1,35 7,12 0,09 0,64 5,88
162 60 6,68 0,21 1,40 7,58 0,10 0,76 5,42
163 58 6,74 0,22 1,48 8,35 0,09 0,75 4,65
173 56 8,25 0,23 1,90 9,35 0,15 1,40 3,65
185 55 9,87 0,22 2,17 10,22 0,14 1,43 2,78
206 52 11,16 0,24 2,68 11,46 0,16 1,83 1,54
235 53 10,74 0,24 2,58 11,25 0,17 1,91 1,75
275 48 14,78 0,26 3,84 13,51 0,22 2,97 -0,51
326 49 15,76 0,25 3,94 13,24 0,18 2,38 -0,24
360 48 19,93 0,26 5,18 13,81 0,18 2,49 -0,81
435 45 25,64 0,24 6,15 14,61 0,13 1,90 -1,61
Figure 12 shows that if the error is negative (-) then the duty cycle drops so the output voltage drops, and if the error is positive (+) then the duty cycle rises so the output voltage rises. So this is in accordance with the buck boost converter principle.
Fig. 12. Duty Cycle vs. error on Buck Boost Converter
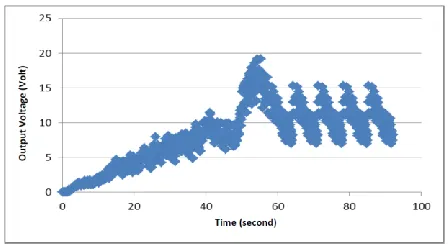
The response of the PID-PSO control system is shown in figure 13. When the geothermal rpm is low, the duty cycle will increase. Increasing the duty cycle increases the output voltage
Fig. 13. Respos of PID-PSO Control
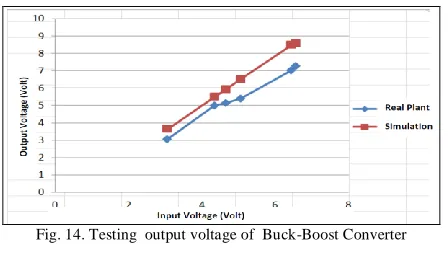
3.7.Real Plan Test Versus Simulasi
The results of the Buck-Boost Converter test with simulation data and real plant that have been obtained, can be analyzed by comparing the results of plant output voltage and Vin simulation and the same duty cycle that can be seen in table XIV.
Fig. 14. Input vs Output Power Buck- Boost Converter
Table XIV
Testing Plant vs Simulation Buck-Boost Converter
RPM Duty cycle Vin Vout plant Vout simulasi
133 55 6,55 7,27 8,58
129 55 6,43 7,02 8,48
109 55 5,05 5,39 6,50
105 55 4,65 5,14 5,93
85 55 4,34 4,99 5,48
68 55 3,05 3,05 3,64
Fig. 14.Testing output voltage of Buck-Boost Converter
V. CONCLUSION
Based on the analysis, it can be concluded that; Positive resistor value on the output voltage and current buck-boost converter, insert using resistor 27 Output The output voltage is higher than the 10 ohm, but the output current is lower. The influence of the inductor on the buck boost converter circuit can be indicated that the output voltage and efficiency of the inductor is 150µh higher than the 470 µh inductor. The value of the duty cycle affects the output voltage value of the buck-boost converter circuit. When the 400 rpm is given a duty cycle of 20% the output voltage is 5.98 volts, when the duty cycle is 70% the output voltage is 18.09 volts. With the PID parameter tuned by the PSO algorithm is Kp = 7.60, Ki = 0.66, Kd = 0.55.
ACKNOWLEDGMENT
The authors would like to thank the Institute for Research and Community Service (LPPM ITS), Institut Teknologi Sepuluh Nopember, Surabaya. with supporting financing the research. Also, the authors would like to thank the anonymous referees for their comments on the eelier version of this work.
REFERENCES
[1] Bianchi, F. D., et al. Wind Turbine Control System. Germany: Springer
Science + Business Media springer.com. , (2007). [1] Ding, B., Luo, X., Wei, S., “A survey on stability research of discrete time Takagi-Sugeno fuzzy control systems,” 8th IEEE International Conference on Control and Automation, 2010.
[2] Ejury, J., “Buck Converter Design”, Infineon Technologies North America, 2013.
[3] El Beid, S. Doubabi, S., “Self-scheduled fuzzy control of PWM DC-DC converters,” in Proc. IEEE 18th Mediterranean Conf Control Auto, 2010.
[4] El Beid, S. Doubabi, S., “DSP-Based Implementation Of Fuzzy Output Tracking Kontrol For A Boost Converter,” IEEE Transactions On Industrial Electronics, VOL. 61, NO. 1, 2014. [5] Guo, L. Hung, J. Y. and Nelms, R. M., “Evaluation of DSP-based PID
and Based fuzzy controllers for DC-DC converters,” IEEE Trans. Ind. Electron., vol. 56, no. 6, pp. 22370–2248, 2009.
[6] Gowda, M., “Modelling of Buck DC-DC Converter Using Simulink,” International Journal of Innovative Research in Science, Mandya, Karnataka, India, 2014.
[7] Gunterus, F., “Pengenalan Metode Ziegler-Nichols pada Perancangan Controller pada PID,” Jakarta : PT. Elex Media Komputindo, 1994.
[8] Jha, A. K., Fernandes, B.G., Kishore, A., “A Single Phase Single Stage AC / DC Converter with High Input Power Factor and Tight
Output Voltage Regulation,” Progress in Electromagnetics Research Symposium Cambridge – USA, 2006.
[9] Kusumadewi, S. Purnomo, H., “Aplikasi Logika Fuzzy untuk pendukung keputusan,” Jakarta: Graha Ilmu, 2004.
[10] Kurniawan, Deva R. 2009. “Rancang Bangun DC to AC Pada Daya Tersimpan Dalam Sebuah Aki Menggunakan Sistem Dual Flip-flop”. [11] Marcelo, D. P. Nascimento, C. B. Angelo, M. T. Mauricio,
S.,“Performance comparison between nonlinear and linear controllers with weighted adaptive kontrol applied to a Buck converter using poles placement design. Industrial Electronics (ISIE),” IEEE International Symposium. Pages: 1 - 6, DOI: 10.1109/ISIE, 2013.
[12] Monhaziz, Hade L. 2009. ”Rancang Bangun Buck Converter Pada
Turbin Angin Berbasis Mikrokontroler AVR ATMega8535
http://dx.doi.org/10.1007/978-1-84996-353-4
[13] A.Musyafa’, A.Harika, I.M.Y.Negara, Imam Robndi,2010, ”Pitch Angle Control of Variable Low Rated Speed Wind Turbine Using
Fuzzy Logic Control” International Journal Of Engineering &
Technology IJET-IJENS Vol:10 No:05, pp.21-24.
[14] A.Musyafa’, I.M.Y.Negara, Imam Robndi,2010, ”A wind Turbine for
low rated wind speed region in East Java” (IJAR, Azerbaijan),
September 2011, pp. 353-358.
[15] Musyafa, A. T. Design Optimal in Pitch-Controlled Variable-Speed under rated wind speed WECS using Fuzzy Logic Control. Canadian Journal on Electrical and Electronics Engineering, CJEEE, 2(6), (ISSN: 1923-0540) June (2011). 202-208.
[16] Musyafa, A., et al. Design Control System of Pitch Angle Wind Turbine Horizontal Axis Based Imperialist Competitive Algorithm
(ICA). International Journal of Scientific Research
(IJSR),(2014).ISSN: 2277-8179.
[17] Musyafa, A. S. A. Pratama, Ronny D. NuriyatTuning of Proportional Derivative Control ParametersBase Particle Swarm Optimization for Automatic Brake System on Small Scale Wind Turbine Prototype, Modern Applied Science; Vol. 9, No. 2; (2015). ISSN 1913-1844 E-ISSN 1913-1852 , Published by Canadian Centerof Science and Education..
[18] Musyafa, A. , D.P.Pratama, and M.K. Asy’ari , “Design and Implemented Pitch Angle Wind Turbine Control System Base Neuro Fuzzy At East Java-Indonesia, IJMME-Ijens, Vo. 18 N0.4 Tahun 2018,
[19] Rasyid, M., “Power Electronic 3rd edition,” Oxford: Elsevier Inc, 2011.
[20] Sutrisna, Fendi. ”Sekilas Mengenai DC-DC converter”. 2 September 2011. https://indone5ia.wordpress.com/2011/09/02/sekilas-mengenai- konverter-dc-dc.