Abstract— One of the main challenges faced in poultry farming is to ensure appropriate levels of comfort and thus maximize the productivity of the birds. Climate control systems are employed in order to minimize the variability of the thermal environment inside the houses. These systems depend on the collection of environmental data for the proper functioning of their control mechanisms. As the sensor has the main role on the data acquisition, we intend to present a Zibee multi-sensor node for application in poultry houses in this article. The main objective of this article is the application in climate control systems. The multi-sensor node was built with the purpose of sensing air temperature (T), relative humidity (RH) and air velocity (AV), but without losing flexibility. In order to facilitate integration with other systems and understanding of the data transmitted, we introduced a type of subpackage in the development of the node software. Tests were conducted to verify the functionality of the sensor node, which performed correctly.
Index Term— Zigbee, wireless sensor network, IEEE 802.15.4,
climate control
I. INTRODUCTION
The main problems found in poultry farming are related to the maintenance of the thermal environment stability, according to the levels of comfort appropriate to each breed. Under appropriate environmental conditions, thermoneutral zone, the birds are able to constantly maintain their temperature, approximately, with minimal effort of the thermoregulatory mechanism, cultivating the productive and reproductive processes [1-4].
Most poultry houses have some type of climate control system in order to minimize the thermal environment variability, which the birds are subject to, making the environment appropriate for productivity and preventing disasters related to extreme temperatures. The efficiency of these systems depends on the control mechanism adopted, which can be classified as manual or automatic. The automatic control stands out for its quick response to variations in the thermal environment, saving time and work [5].
Inside the poultry houses, there are numerous variables that need to be measured to enable the control process of a climate control system. Thus, data acquisition is an essential component to any climate control system, being the sensor the central element, responsible for the capture of the environmental variables in certain time intervals. In more advanced poultry facilities, numerous points are needed for sensing a better representation of the local climate at different regions of the house so that the control systems can operate more efficiently [6].
The reduced variation dynamics of the environmental
variables, which vary in a long time and with samplings that can be spaced at intervals of minutes, points toward the use of wireless sensor networks, using a spectral band reduced in time and low power consumption [7]. In addition, the flexibility offered by the adoption of wireless sensor nodes, especially regarding the amount of sensors, is an option that is attractive, modular and cheaper compared to wired solutions [6].
The low consumption and simplicity of the network configuration offered by Zigbee technology have encouraged researchers to explore its applicability in poultry farming. Zigbee specifications define the layers for network and application, as well as security, to be used in conjunction with the IEEE 802.15.4 standard. The IEEE 802.15.4 standard is a physical radio specification (physical and medium access layers) that provides a low rate of data connectivity between relatively simple devices that consume minimal power and that, usually, connect short distances [8].
Through the use of CTP (Collection Tree Protocol) on the IEEE 802.15.4 standard, [6] proposed a monitoring system for poultry houses, where temperature and relative humidity data, acquired through a wireless sensor network, were loaded into an online database for later analysis through web applications. Following a similar path, [9], through a Zigbee sensor network, associated with a web gateway based on an embedded Linux platform, developed a system that would allow producers to monitor and remotely control facilities for laying hens.
[7] evaluated the propagation of radio signals for Zigbee technology in broiler houses. And, through the attenuation curve obtained, the authors were able to confirm the feasibility of implementing the proposed solution.
Given the aforementioned, this work proposes a Zigbee multi-sensor node intended for use in automatic climate control systems in broiler houses. Knowing that the variables of greatest impact on the homeostasis, and consequently thermal comfort, of birds are air temperature (T), relative humidity (RH) and air velocity (AV) [10-12], the node was built especially to measure these three variables, though it can be expanded to add other sensors.
II. MATERIAL AND METHODS
A. Multi-sensor node hardware
The first step in the direction of making the node was the choice of the Zigbee transceiver. Given its simplicity it is commonly being used in prototyping or to reduce the development effort, we selected the Xbee Series 2,
Design and Development of a Wireless
Multi-Sensor Node for Poultry Houses
manufactured by Digi International. The hardware of the Xbee Series 2 incorporates an Ember Networks microchip that offers a wide variety of Zigbee mesh network standards, essential for the creation of robust sensor networks [13]. In addition, Xbee transceivers are marketed with multiple antenna options. Thus, to avoid possible breakage problems and to facilitate the adaptation of the node to a protective encasing, we decided to acquire transceivers with chip antennas.
To sense temperature and relative humidity, we selected the SHT11 module, manufactured by Sensirion, which, in a single chip, provides a calibrated output for both variables. With an accuracy of ±3 % for RH and ±0.4 ºC for T (25 ºC), the device is formed by a capacitive polymer as humidity sensor element and a band-gap temperature sensor, both coupled to a 14-bit digital-to-analog converter and a digital serial interface. The calibration of each SHT11 is performed in a precision climate chamber, and the calibration coefficients are programmed in the memory of each device. In addition, to ensure security, in each transmission the sensor sends an 8-bit checksum, produced by the built-in CRC generator. The SHT11 is a compact device and of low consumption, which, together with a simple serial interface and internal voltage regulator, can be easily and quickly integrated into any hardware design [5].
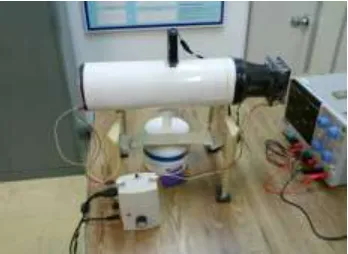
The air velocity sensor was obtained through the adaptation of a digital anemometer manufactured by the company BENETECH. The propeller anemometer, which employs an inductive principle, was converted into a sensor whose output can be measured in pulses per second or through the period between consecutive pulses. The correspondence between the measured output and the AV in m/s was found through sensor calibration, using the tunnel system shown in Fig. 1. Based on the microcontroller PIC18F1320, the calibration system has a potentiometer for pulse width selection of the PWM generator. Pulse width variation allows the variation of the speed of its three propellers and, thus, air velocities from 0 to 4.8 m/s inside the tunnel. During calibration, we selected 22 AV values that showed stable readings through a test sensor (another anemometer). In each of these points, we took ten readings in the period between pulses, and the average values were used to obtain the conversion equation and calibration curve shown in Fig. 2. Data collection for the calibration was performed visually with a test sensor and with the aid of a sensor node testing program, detailed in the next section.
Fig. 1. Calibration system for air velocity sensors.
Fig. 2. Calibration curve and equation of the air velocity sensor.
Although the Xbee transceivers are able to collect data and send them without the need of using an external microcontroller, because of the complexity of the sensors used and the desired processing for this project, the PIC 18F1320 microcontroller was selected to integrate the sensor node. The 18F1320 is a microcontroller manufactured by Microchip, with 18 pins, 8 KB Flash memory, 256 bytes of SRAM and EEPROM and can operate at a frequency of up to 25 MHz. In addition, it features 16 I/O pins, 7-channel A/D, Capture/Compare/PWM module, 4 timers and USART module. As previously shown, the 18F1320 is part of a line of PIC microcontrollers, which are popular because they are compact and low cost, with devices for various applications. The PICs share some characteristics, such as, Harvard architecture, instruction pipeline, RISC, single accumulator (W recorder) and fixed reset and interrupt vector [5].
Typically, sensor nodes, known as end devices on a Zigbee network, are powered by battery; therefore, a Li-ion battery with 3.7 V and 2400 mAh, manufactured by Ultrafire, was selected to power the multi-sensor node. As this is a rechargeable battery, we integrated into the multi-sensor node design the integrated circuit, linear battery charger, MAX8606, produced by MAXIM. The MAX8606 operates from 4.25 V to 5.5 V, including locking for low voltage, lower than 3.4 V, and overvoltage protection, up to 14 V. The voltage from the battery is rectified to 3.3V through the voltage regulator TC1264, manufactured by Microchip, this constitutes the working voltage of the entire multi-sensor node.
Fig. 3. Layout of the printed circuit board of the multi-sensor node and detail of the expansion (P2) and test (P3) connectors.
In the detail in Fig. 3, we highlight the P2 and P3 connectors, where P2 serves the expansion of the sensor node and P3 the tests using only the Xbee transceiver. An expansion board, whose inclusion would require amendments to the program written for the 18F1320. This could be connected to P2, which offers power, 1 and 2, and access to PIC, 3 to 7. The P3 connector was added to enable the possibility of exploring the Xbee potential, which, as seen above, can be used without the presence of an external microcontroller.
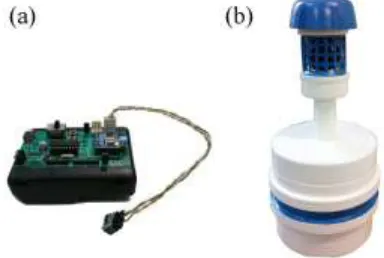
Fig. 4. Multi-sensor node with SHT11 sensor (a) and in protective encasing with SHT11 and AV sensor (b).
Fig. 4 A displays the multi-sensor node with only the SHT11 sensor, while in Fig. 4 B all sensors, T, RH and AV, are connected to the node and housed in a protective encasing.
B. Multi-sensor node software
The Xbee modules can be configured to operate in two modes, API (Application Programming Interface) and AT (transparent/command). When configuring the Xbee for the API mode, data are encapsulated, offering a standardized and efficient way for different devices to communicate. The AT mode presents a more direct form of iteration, where the transceiver transits between the transparent mode - the bytes received by a transceiver are presented directly to its serial port - and the command mode, which serves the communication with a local radio on its configuration and performance.
The API is the key element of the program written for the node, because of its different types of packages it brings the information needed to build a robust network, which can
integrate a monitoring and/or control system. All API packages feature the fields Start delimiter (byte that delimits the beginning of a package), Length (two bytes that represent the number of data specific to the package – bytes between the Length and checksum fields) and checksum (byte used in error detection), differing only by the data specific for each type of package. The packages considered for the production of the sensor node software are the Zigbee Transmit Request and Zigbee Receive Packet. The data specific for the Zigbee Transmit Request can be divided into the fields Frame type (0x10), Frame ID, 64-bit destination address, 16-bit destination network address, Broadcast radius, Options and RF data. The fields for the Zigbee Receive Packet are divided into Frame type (0x90), Frame ID, 64-bit source address, 16-bit source network address, Receive options and Received data. The fields of greater importance to the software design in addition to the address fields, are those that store the information sent (RF data) or received (Received data) used for specifying a type of subpackage. These subpackages can be divided between Reception and Transmission, and its structures are presented in Table I. There is a special type of Transmission subpackage, which is used only during the initialization of the sensor node. This subpackage consists of two bytes, the mode byte (0x00) and the Sensor byte that specifies the sensors available on the node.
Table I.
Subpackages of Reception and Transmission of the multi-sensor node.
Reception Transmission
Structure Example Description Structure Example Description
Mode 0x01 0x00 – Puts the node in the command mode.
0x01 – Requests data acquisition and puts the node in the command mode. 0x02 – Puts the node in the sensing mode, where the node "wakes up" periodically, sending the data acquired from sensors.
Mode 0x01 0x01 – Data transmitted in the command mode. 0x02 – Data transmitted in the sensing mode.
Sensors 0x03 Sensors to be sent: 0x01 – Battery, 0x02 – Temperature, 0x04 – Relative Humidity, 0x08 – Air velocity
* These codes can be combined;
Sensors 0x03 Sensors sent: 0x01 – Battery, 0x02 – Temperature, 0x04 – Relative Humidity, 0x08 – Air velocity In the case of the example: Battery and Temperature
Time (Sleep/ Wake)
0x01 Time in seconds of the interval between sensing, when in the sensing mode, or the time before sleep by inactivity, when in the command mode.
Sensor Data
0x03 Each sensor, selected in Sensors, will have two bytes in this field. The order of sensors obeys the ascending
order of
hexadecimal codes that represents them.
0xAB
0x2C 0x12
Based on the previously mentioned subpackage formats, the software has a very simple operating principle. When the sensor node is activated, it waits for a maximum period of ninety seconds so that, as a device, a coordinator will accept it on its network. The non-acceptance of the node on a network implies its entry in the sleep mode, in order to conserve battery power. When accepted, the node sends a boot subpackage for the coordinator and waits, for up to three seconds, the receiving of a confirmation subpackage. The non-receipt of a confirmation can lead the sensor node to perform two more attempts, and if all fails it enters into the sleep mode. However, when the node receives the confirmation, it can be placed in command mode (0x00 and 0x01), waiting for requests from the coordinator regarding sensor data (0x01), or sensing mode (0x02), where the node enters the sleep mode, waking up after a certain time and sending the data from the sensors. The sensor node operating mode may change during its operation, because after sending each subpackage of Transmission, a subpackage of Reception, mode 0x02 or 0x00, is awaited. This subpackage is, semantically, a confirmation that the coordinator has received the data transmitted by the node. By not receiving the confirmation, the node maintains its mode of operation, and, in the command mode, the sleeping from inactivity timer is not restarted or, in the sensing mode, makes another attempt to send, before entering into sleep for the same previous period.
In addition to the importance in the selection of the mode of the sensor node, the subpackage of Reception is responsible for selecting what sensors will have their data sent. The selection depends on the field Sensors, being performed when the coordinator requests data (0x01) or puts the node in the sensing mode (0x02). The field Time, also present in this subpackage, brings a period in seconds, stored in two bytes, that changes context according to the mode of the sensor node. When in the command mode, it will be the maximum period that the node can remain without receiving a requisition before entering the sleep mode. In the sensing mode, this period is the sleep time, after which the node will be awakened, collecting and sending data from the selected sensors.
In the Transmission subpackage responsible for transmitting data from the sensors, the field Mode can be 0x01, which will inform the recipient that the node is in command mode and that it is a response to a request for data, or 0x02, so that the recipient is aware that the node is in the sensing mode. The field Sensors, in this case, serves to indicate what the sensors will be sent, and the combination of codes is present in Table I. The sensors are sent following the order of their hexadecimal codes, two bytes for each sensor.
The battery voltage reading is done through the analog-to-digital converter of the microcontroller, and its two bytes (bat), sent by the sensor node, will need to be converted into voltage using equation (1). This conversion will need to be made for data interpretation, and the result of equation (1) is given in Volts (V). This equation was empirically adjusted due to the interference of a transistor whose absence would allow the development of the equation from applications of the first Ohm's law, considering that the analog-to-digital converter of
18F1320 is 10bits, operating with reference voltage of 3.3 V, and that the battery voltage is measured in a voltage divider formed by 330 KΩ and 80 KΩ resistors.
(1)
Temperature and relative humidity are required, independently, through the SHT11serial interface. The data variables, T or RH, are sent by SHT11 accompanied by one byte of checksum, which is used by the embedded software in 18F1320 on error detection. The occurrence of an error causes the connection between PIC and SHT11 to suffer a reset. As a result, the program makes a new request to SHT11. When T and/or RH are read successfully, two bytes are added to the subpackage of Transmission for each variable.
Air velocity is measured and with the aid of timer0, obtains the elapsed time between two consecutive pulses produced by the AV sensor. The detection of these pulses must occur within a maximum period of one second. The timer0, in fact, allows the obtaining of a numeric value, which was configured so that each unit corresponds to 51.2 μs. When AV is requested, this value is placed in two bytes that will be attached, properly, to the subpackage of Transmission. The AV in m/s may be obtained, subsequently, through the conversion equation in Fig. 2, where ρ is this numeric value. The multi-sensor node software was written in C using the MPLAB X IDE v 1.90, distributed free by Microchip, configured to use the demo distribution of the compiler CCS PCWHD v. 5.0.
In addition, so that the node can work properly, the X-CTU v. 6.1, official program for setting up the Xbee modules, was used to configure the transceiver as an API device end (firmware version 22A0). The X-CTU needs to be used in association with an Xbee adapter, in which the transceiver is fixed for its configuration. The adapter SparkFun Xbee Explorer was selected for its popularity and because it presents an USB interface easily accessed by the X-CTU.
C. Testing Software
The testing software was written so that a general-purpose computer can be used as coordinator, requesting data and modifying the mode of operation of the multi-sensor node. To this end, the program assumes that the transceiver, configured as Coordinator API (firmware version 21A0), is connected to the USB port through the adapter SparkFun Xbee Explorer.
In a computer Intel Core 2 Duo T6400 2 GHz with 3 GB RAM and operating system Linux Ubuntu 13.10, the software was developed using the IDE Qt Creator 2.4.1, in association with the libraries Qt 4.8.1 and Boost 1.55. The compiler used by the IDE is the GNU GCC 4.8.1, native to the Linux operating system.
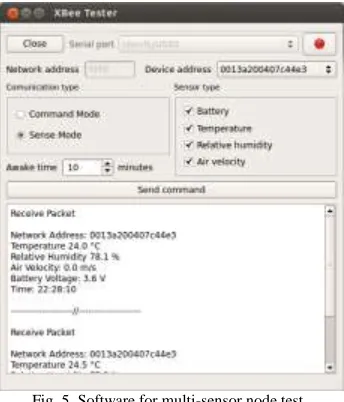
The interface of the application, present in Fig. 5, was entirely developed using the visual editor Qt Designer. Through the iteration with this interface, the user is able to start or finish the communication between the computer and the adapter SparkFun Xbee Explorer, recognized by the computer on the USB serial ttyUSB0 or ttyUSB1, and send a subpackage of Reception, if the properly configured Xbee is present, selecting the target sensor node address (Device Address), its mode of operation (Communication type), what sensors will be read (Sensor type) and the time in minutes (Awake time) between sensing or before sleep by inactivity.
Fig. 5. Software for multi-sensor node test.
The selection of the address is performed through a ComboBox that stores a list, filled with the addresses of the sensor nodes, whose boot subpackage arrived successfully to the coordinator. All activity of the sensor modules, sensing data, can be viewed in the area with the scroll bar.
In addition, the application has a button that allows recording of the sensing data in a file. This button must be pressed before the receipt of the data to be recorded, allowing them to be preserved for future analyses.
In order for the application to function as expected, it needs to be able to establish an asynchronous serial communication with the adapter SparkFun Xbee Explorer. This was possible through the classes AsyncSerial and QAsyncSerial, dependent on the library Boost. These Classes are written by Terraneo
Federico, being found on his website
(www.webalice.it/fede.tft/) and distributed under the Boost Software License.
III. RESULTS AND DISCUSSION
During a five day period, the multilsensor node had its usability tested in laboratory conditions, from February 23 to February 28, 2014 in Campinas-SP. During this period, running the test software on the same computer where it was developed, values of temperature, relative humidity, air velocity and battery voltage were collected at intervals of 10 minutes. Fig. 6 shows the behavior of the curves of T, RH and AV in February 25, 2014. The battery, charged for 10 hours before performing the experiment, has the behavior of its
voltage, for the entire period of experimentation, shown in Fig. 7.
Fig. 7. Multi-sensor node voltage during the experiment.
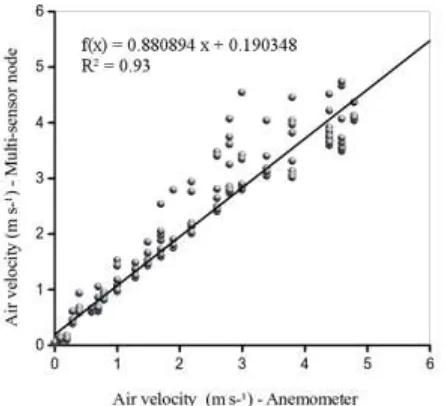
The AV presented in Fig. 6 C is only to demonstrate that it is possible to collect the variable through the node, and the AV values are measurements of forced ventilation. This way, for the analysis of the conversion equation, we calculated the coefficient of determination (R²) and the root mean square error (RMSE) using the calibration data. Performing the conversion of the measured data and using the readings taken with the anemometer, excellent results were found, with R² of 0.93 and RMSE of 0.41. Fig. 8 presents the distribution chart that relates the data measured by the anemometer and the multi-sensor node, where points can be observed very close to the trend line.
Fig. 8. Distribution chart relating the data measured by the anemometer and the multi-sensor node during calibration.
[14] conducted tests with respect to energy consumption in the sending and receiving of data, which are the most important components of a sensor node. However, this type of information can be found in the documentation of the Xbee Series 2, being the consumption power approximately 45mA in transmission and 50mA in reception, at 3.3 V [15].
IV. CONCLUSION
The multi-sensor node presented in this article was developed with the purpose of being applied in poultry farming, more specifically for the comfort of confined birds, measuring T, RH and AV. However, it is a very flexible node and can be reprogrammed and expanded. The subpackages, used to communicate with the node, allowed us to structure the communication, facilitating the understanding of the data transmitted and the future integration to a monitoring and control system. During the tests, both the node and the program developed to test it worked properly, which can be seen through the curves generated from the data measured (Fig. 6 and Fig. 7). In addition, the AV sensor, whose inclusion, outside the applicability in monitoring and control, can help in detecting local problems in airflow, obtained excellent results in the calibration (Fig. 8).
ACKNOWLEDGMENT
Capes/CNPQ for the financial support and Espaço da Escrita - Coordenadoria Geral da Universidade - UNICAMP - for the language services provided.
REFERENCES
[1] C. M. Medeiros, F. C. Baêta, F. M. Oliveira, I. F. F. Tinôco, L. F. T. Albino, P. R. Cecon, “Efeitos da temperatura, umidade relativa e velocidade do ar em frangos de corte,” Eng. Agric., vol. 13, no. 4, pp. 277-286, Oct./Dec. 2005.
[2] D. D. Salgado, I. A. Nääs, D. F. Pereira, D. J. Moura, “Modelos estatísticos indicadores de comportamentos associados a bem-estar térmico para matrizes pesadas,” Eng. Agric., vol. 27, no. 3, pp. 619-629, Sept./Dec. 2007.
[3] F. P. F. Curto, I. A. Nääs, D. F. Pereira, D. D. Salgado, “Estimativa do padrão de preferência térmicade matrizes pesadas (frango de corte),” Rev. Bras. Eng. Agríc. Ambient., vol. 11, no. 2, pp. 211-216, Mar./Apr. 2007.
[4] I. Menegali, I. F. F. Tinôco, F. C. Baêta, P. R. Cecon, M. C. C. Gimarães, M. B. Cordeiro, “Ambiente térmico e concentração de gases em instalações para frangos de corte no período de aquecimento,” Rev. Bras. Eng. Agríc. Ambient., vol. 13, supl. 0, pp. 984-990, Nov./Dec. 2009.
[5] A. Z. Lopes, “Design of a neuron controller for climatized broiler houses,” M.S. thesis, Dept. Eng. Fed. Univ. Lavras, Lavras, Brazil, 2009.
[6] M. Murad, K. M. Yahya, G. M. Hassan, “Based poultry farm monitoring system using wireless sensor network,” in Proc. FIT, Abbottabad, Pakistan, 2009, pp. 1-5.
[7] E. F. Nunes, N. L. Cappelli, C. K. Umezu, “Avaliação da propagação de sinais de radiofrequência para tecnologia Zigbee em granja de frango de corte,” Rev. Bras. Eng. Agríc. Ambient., vol. 15, no. 1, pp. 102-107, Jan. 2011.
[8] N. Wang, N. Zhang, M. Wang “Wireless sensors in agriculture and food industry: Recent development and future perspective,” Comput. Electron. Agric., vol. 50, no. 1, pp. 1-14, Jan. 2006.
[9] S. Wu, K. Wu, J. Liang, Z. Li, P. Yang, “Design of remote environment control system of intelligent network henhouse based on ARM9,” Procedia Eng, vol. 15, pp. 1056-1060, 2011.
[10] E. Blanes-Vidal, E. Guijarro, S. Balasch, A. G. Torres. “Application of computational fluid dynamics to the prediction of airflow in a mechanically ventilated commercial poultry building,” Biosyst. Eng., vol. 100, no. 1, pp. 105-116, May 2008.
[11] S. Yahav, A. Straschnow, E. Vax, V. Razpakovski, D. Shinder. “Air velocity alters broiler performance under harsh environmental conditions,”. Poult. Sci., vol. 80, no. 6, pp. 724-726, Jun. 2001. [12] X. TAO, H. XIN, “Acute synergistic effects of air temperature,
[13] R. Faludi, “Building wireless sensor networks,” Cambridge: O'Relly Media, 2011.
[14] D. Gao, T. Zheng, D. Peng, S. Zhang, “A general multi-sensor node in wireless sensor networks,” in Proc. IEEE-ICCTA, Beijing, China, 2009, pp. 406-411.