Abstract—Ice load generally occurs cold and heavy fog ambient conditions, and it causes major faults in overhead lines. Hence ice load detection studies are important to prevent ice load effect, and image processing is very useful method for ice load detection studies. It is indicated in literature, dark and heavy fog ambient conditions are major problem for ice load detection. These problems are solved by using multilevel threshold-optimization method, but local optimum falling problems occurs due to high threshold level. Hence threshold level must be reduced to reduce number of local optimum falling problems. In this study, multilevel threshold- optimization methods are used, and threshold level is reduced to reduce local optimum falling number. Gravitational Search Algorithm (GSA) is used as optimization method, and Ramesh and Otsu methods are used as multilevel threshold method. When 7 level GSA-Ramesh Method is used, its accuracy rate is 99.43%, also number of local optimum falling is reduced.
Index Terms—GSA, ice load, optimization method, ramesh method, otsu method.
I. INTRODUCTION
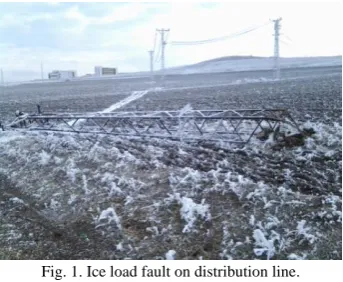
Cutting out of electric energy is the major problem for electric facilities. One of the major cause of the cutting out problem is ice load. Ice load generally occurs under cold and heavy fog ambient conditions, and it causes electric pole bending or conductor breakage. In Fig. 1, an ice load faults is shown. This fault occurred on a distribution line which has 31.5 kV voltage and 1/0 AWG (Raven) conductor. Therefore ice load detection studies is important to prevent ice load faults.
Fig. 1. Ice load fault on distribution line.
The major ice load faults occurred in Zhaotong area, Yunnan Province, South China, and Modified hidden
Manuscript received October 1, 2015; revised December 25, 2015. Bahadır Akbal is with the Department of Electrical and Electronics Engineering, Selçuk University Konya, Turkey (e-mail: [email protected]).
semi-Markov model (HSMM) was used to estimate ice load [1]. There are many ice load detection method in literature. These methods can be sorted as load sensor application, meteorological sensor application, meteorological data of the past years and image processing. Also mechanical calculation model was used to detect ice load [2]. Load sensor application is a difficult and expensive method for all overhead lines [3]. Meteorological sensor application was made by using GSM, SMS, and Zigbee [4]. Meteorological data was used with an expert software, but the estimation error of this method is 200 kg [5]. This value is very big for ice load detection studies. Image processing is very useful method for ice load detection studies because application of this method is easy and inexpensive for all overhead lines. When ice load faults was examined, it is seen that ice load faults occurred at night and under heavy fog ambient conditions [6]. Therefore dark and heavy fog ambient conditions must be considered for image processing method. Image processing method is based on thresholding and edge detection. Therefore, Sobel edge detection method and Hough transform method were used to detect ice load, but real ambient conditions for ice load were not considered [7]. Classification methods have been used for image processing. Hence Support Vector Machine (SVM) and Artificial Neural Network (ANN) were used to detect ice load, but the real ambient conditions were not considered [8]. Also in some ice load detection method, these ambient conditions were not considered [9]-[12]. Multilevel threshold and optimization methods were used together to detect ice load under dark and heavy fog ambient conditions. 20 threshold level CSA-Otsu method was used to detect ice load, and its accuracy rate is 99%. However number of local optimum falling problems were increased because of high threshold level [13]. In this study, ice load detection studies was made under dark and heavy fog ambient conditions, and multilevel threshold and optimization method were used. Local optimum falling problems are important for ice load detection, so reducing of local optimum falling number is aimed in this study. Hence Ramesh method was used as a new multilevel threshold method, and Gravitational Search Algorithm (GSA) was used as a new optimization method.
II. MATERIAL AND METHOD
In this study, an artificial climate cabinet (ACC) was used to create ice load on distribution line conductor. ACC is shown in Fig. 2, and the iced conductor in ACC is shown in Fig. 3. Dark and heavy fog ambient conditions were created in ACC, and the iced conductor image was taken by an outdoor camera which was placed inside of ACC. This
Comparison of GSA-Ramesh and GSA-Otsu Method to
Detect Ice Load in Real Ambient Conditions
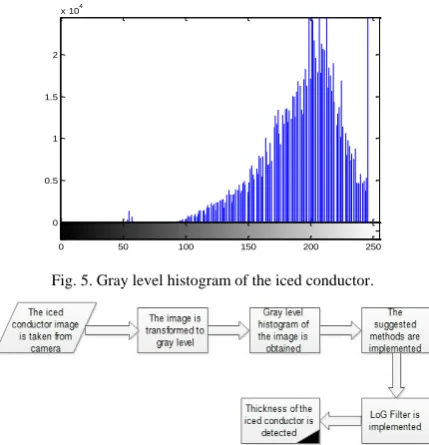
camera has night vision feature and 3.1 mega pixel image resolution. The iced conductor image which was obtained under dark and heavy fog ambient conditions is shown in Fig. 4. It is seen in Fig. 4 that image contrast is reduced by dark and heavy fog ambient conditions. Therefore, if image processing is used to detect ice load, threshold level must be increased. Hence in this study, multilevel threshold methods were used to detect ice load. Also, gray level histogram of the iced conductor image must be obtained before multilevel threshold methods are implemented. If threshold level is m, the set of t (t0,t1,t2,…tm) are values of thresholding levels. Gray level histogram of the iced conductor image which is shown in Fig. 4 and threshold levels are shown in Fig. 5. A block diagram summarizing for ice load detection studies is shown in Fig. 6.
Fig. 2. Artificial climate cabinet.
Fig. 3. The iced conductors.
Fig. 4. The iced conductor image under dark and heavy fog conditions.
0 0.5 1 1.5 2
x 104
0 50 100 150 200 250
Fig. 5. Gray level histogram of the iced conductor.
Fig. 6. A block diagram summarizing the proposed approach.
In literature, Otsu method has generally used for image recognize studies. In this study, Otsu and Ramesh methods were used as multilevel threshold method to detect ice load.
A. Otsu Method
Otsu indicated between-class variance method for image segmentation. In this method, variance of different classes is maximum value. If image is divided as two classes, these classes can be defined as C0 and C1. If threshold level of C0 and C1 is determined as t, C0 includes the gray levels from 0 to t-1, and C1 includes the gray levels from t to L. Gray levels probabilities are defined as w0 and w1, and distribution of gray levels probability of classes as follows [14];
0 1
0
0 1
,..., t t
p p
C
w w
and
1 t,..., L
t L
p p
C
w w
(1)
1 0
0
t i i
w P
and1
L
i i t
w P
(2)The mean level of classes is defined as µi. The mean level of image is defined as µT.
1
0
0 0
. t
i
i
i P w
and1
1
. L
i
i t
i P w
(3)0.w0 1.w1 T
and w0w11 (4)Otsu's method is described as follows;
0 1
( )
f t (5) 2
0 w0.( 0 T)
and
1w1.(
1 T)2 (6)In bi-level threshold studies, optimal threshold level (t) is determined by Otsu method as follows;
arg max ( )t f t (7) Multilevel thresholding of an image can be extended between-class variance function.
0
( )
m i i
f t
(8)The number of thresholds is m, and the number of classes in original image is m (C0, C1, C2,...Cm).
f t( )0 1 2...m (9)
2
0 0 0
2
1 1 1
2
2 2 2
2
.( )
.( )
.( ) ...
.( )
T T
T
m m m T
w w w w
(10)
determined as follows ;
( , , ,....,t t t0 1 2 tm)arg max
f t( )
(11)B. Ramesh Method
Image gray level is presented L (0,1,2,…L-1). ith gray level probability of image is p(g), and p(g) is calculated with Equation (12).
( )
( ) / (
)
p g
h g
NxM
(g=0,1,2….L-1)(12)
h(g) is an string which indicates image histogram. In bi level threshold method, minimization of the sum of square errors is made by using Equation (13) and Equation (14). Where T is threshold value. The sum of square errors is shown in Equation (15) [15].
0 0 0 ( ) ( ) ( ) T g T g gp g b T p g
(13) 1 1 1 1 1 ( ) ( ) ( ) L g T L g T gp g b T p g
(14) 1 2 2 0 1 0 1arg min ( ( ) ) ( ( ) )
T L
opt
g g T
T b T g b T g
(15)In this study, bi-level Ramesh threshold method was improved by using Equation (16) and Equation (17) for multilevel threshold method.
0 0 0 0 0 0 1 1 0 1 1 1 1 0 ( ) ( ) , ( ) ( ) ( ) ( ) t g t g t g t t g t gp g b t p g gp g b t p g
1 1 1 1 1 1 ( ) ( ) ( ) L g tm m m Lg tm gp g b t p g
(16)
0 1 1
2 2 2
0 0 1 1
0 01 11
arg min ( ( ) ) ( ( ) ) ... ( ( ) )
t t tm
opt m m
g g t g tm
T b t g b t g b t g
(17)
It is indicated in literature that threshold level must be increased to detect the iced conductor thickness under dark
and heavy fog ambient conditions. However, if threshold level of multilevel threshold method is increased, computational time of multilevel threshold method increases. Also, Otsu method is a maximization problem, and Ramesh method is a minimization problem. Hence, optimization methods were used with multilevel threshold method to detect optimum threshold level and to reduce computational time of multilevel threshold methods. Namely, optimization methods were used for optimization of multilevel threshold methods. In this study, Gravitational Search Algorithm was used as optimization method.
C. Gravitational Search Algorithm
Each particle which is defined in Gravitational law is defined as agent in GSA. According to gravitational law, the other particles are attracted by gravitational force of each particle. Gravitational force is affected by particles masses. The particle which has heavier mass attracts the other particles, and the other particles move towards the particle. Each agent has four features. These feature are position (Xii), inertial mass (Mii), active gravitational mass (Mai) and passive gravitational mass ( Mpi). Mai = Mpi = Mii is calculated with Eq. (18) [16].
( ) ( ) ( )
( ) ( )
i
fit t worst t m t
best t worst t
(18)
1 ( ) ( ) ( ) i i N j j m t M t m t
i1, 2,....N (19)If agent number is N in search space, each agent position can be defined by Eq. (20).
1
( ... d... n) i i i i
X x x x i1, 2,....N (20)
n is agent dimension, and agents occur
x
id particles. Namely,x
id is defined as variable of agent. F is gravitational force between ithagent and jth agent at the t time. Gravitational force is shown in Eq. (21).( 1) ( ) ( 1)
d d d
i i i
x t x t v t (21)
Mi is mass of ith agent, Mjis mass of jth agent, Rij(t) is the
Euclidian distance between ith agent and jthagent, and it is defined Eq. (22). G(t) is gravitational constant and is defined Eq. (23).
R tij( ) X t Xi( ), j( )t 2 (22)
( /max) 0
( ) . t t
G t G e (23)
G0 is an initial value, β is constant value, t is the current iteration number, tmax is maximum iteration number, and total
force on ith agent is defined with Eq. (24) at t time.
,
( ) . ( )
N
d d
i j ij
j Kbest j i
F t rand F t
r and j is random number between 0 and 1, Kbest is the first
agents which have the best fitness value. Acceleration of agent is calculated with Eq. (26). Velocity and position are updated with Eq. (27) and Eq. (28) according to acceleration of agent at the t time.
( ) ( )
( ) d
d i
i
ii
F t
a t
M t
(26)
( 1) . ( ) ( )
d d d
vi t rand vi i t ai t (27)
( 1) ( ) ( 1)
d d d
i i i
x t x t v t (28)
( )
d i
x t is position of ith agent, vid( )t is velocity of agent, and ran djis random number between 0 and 1 at the t time.
Working principle of GSA as follows [16]:
1) Initial population is occurred, and positions of agents are determined as randomly.
2) Fitness values of agents are calculated.
3) Best and worst agents are selected in population, and G is updated.
4) M and a of agents are calculated, and velocity and position of agents are updated.
After these steps are implemented, fitness values of the updated agents are calculated. If optimum value is found, or the maximum iteration number is reached, program is stopped. Otherwise, the steps which are between 2 and 4 are continuously implemented.
III. EXPERIMENTAL RESULTS
In this study, GSA-Otsu and GSA-Ramesh methods were used as multilevel threshold-optimization methods. It is indicated in literature that if threshold levels of multilevel threshold-optimization methods are increased, local optimum falling number increases. It is seen at the end of ice load detection studies that if threshold levels of multilevel threshold-optimization methods are reduced, number of local optimum falling reduces. Hence in this study, threshold levels of GSA-Otsu and GSA-Ramesh methods were reduced and selected maximum 7 level to reduce local optimum falling number. Also the iced conductor image which is shown in Fig. 4 was used for ice load detection studies. Population and iteration numbers of GSA-Otsu and GSA-Ramesh methods are 25, and the results of GSA-Otsu and GSA-Ramesh methods are shown in TABLE I. In TABLE I, the detected iced conductor thickness is shown as D (cm), threshold level is shown as m, and threshold values is shown.
TABLEI:THE RESULTS OF GSA-RAMESH AND GSA-OTSU METHODS
Method m D (cm) Thresholds
GSA-Ramesh 5 3.62 146 161 172 196 233
6 3.57 164 209 213 221 240 250
7 3.52 2 35 151 169 175 179 242
GSA-Otsu 5 4.11 87 156 193 221 237
6 3.71 72 106 167 192 218 240
7 3.62 58 137 181 191 204 223 239
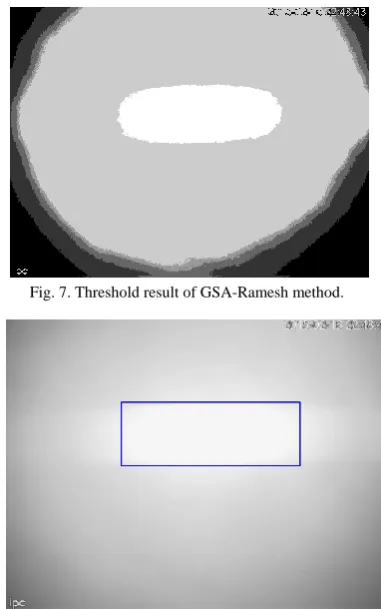
The iced conductor total thickness was measured as 3.5 cm during experiments, and this thickness was detected by using GSA-Ramesh and GSA-Otsu method. The best value is determined as 3.52 cm, and this result belongs to 7 level GSA-Ramesh method. Namely accuracy rate of 7 level GSA-Ramesh method is 99.43%. Also local optimum falling number of GSA-Ramesh method is less than local optimum falling number of GSA-Otsu method. Threshold result of 7 level GSA-Ramesh method is shown in Fig. 7, and the detected iced conductor thickness is marked on original image in Fig. 8.
Fig. 7. Threshold result of GSA-Ramesh method.
Fig. 8. The detected iced conductor thickness.
IV. CONCLUSION
ACKNOWLEDGMENT
This study was supported by Selçuk University Coordinatorship of Scientific Research Projects with 15701883 number.
REFERENCES
[1] X. Wu, L. Li, and X. Rui, “Icing load accretion prognosis for power transmission line with modified hidden semi-Markov model,” IET Generation, Transmission and Distribution, vol.8, pp. 480-485, March 2014.
[2] X. Jiang, Z. Xiang, Z. Zhang, J. Hu, Q. Hu, and L. Shu, “Predictive model for equivalent ice thickness load on overhead transmission lines based on measured insulator string deviations,” IEEE Transactions on Power Delivery, vol. 29, pp. 1659-1665, March 2014.
[3] M. G. Ming, L. C. Rong., J. Jian, Q. J. Tao, and Y. Chun, “Design of fiber bragg grating load sensor used in ice monitoring on overhead transmission lines,” in Proc. International Conference on High Voltage Engineering and Application (ICHVE), 2010, pp. 232-235. [4] H. Xinbo, S. Qindong, and D. Jianguo, “An on-line monitoring system
of transmission line conductor de-icing,” in Proc. 3rd IEEE Conference on Industrial Electronics and Applications, 2008, pp. 891-896.
[5] P. L. Qimao, C. Min, G. Shangfei, and H. Haiyan, “Time series prediction for icing process of overhead power transmission line based on BP neural networks,” in Proc. IEEE 30th Chinese Control Conference, 2011, pp. 5315–5318.
[6] B. Akbal, “System design and implementation to melt the ice Occurring in high voltage aerial transmission lines,” PhD dissertation, Selçuk University Directorate of Graduate School of Natural and Applied Sciences Institute of Science, Konya, Turkey, 2015.
[7] W. Xie, “Monitoring system of power line icing based on GPRS,” in
Proc. International Conference on Medical Physics and Biomedical Engineering, 2012, pp. 705-711.
[8] J. Runhai, L. Bin, and L. Yuancheng, “Detection of cladding ice on transmission line based on SVM and mathematical morphology,” in
Proc. IEEE 3rd International Congress on Image and Signal Processing, 2010, pp. 1624-1628.
[9] B. Akbal and M. Aydın, “Usage of GA with multilevel thresholding to detect ice thickness of iced conductor,” American Academic & Scholarly Research Journal, vol. 6, pp. 276-282, 2014.
[10] B. Akbal and M. Aydın, “Multilevel threshold and PSO for ice load detection on aerial lines,” Journal of Applied Environmental and Biological Sciences, vol. 4, pp. 50-55, November 2014.
[11] B. Akbal and M. Aydın, “DE-Otsu method to eliminate ice load effects,” Journal of Applied Environmental and Biological Sciences, vol. 4, pp. 423-427, , November 2014.
[12] L. Jiazheng, L. Jing, Z. Hongxian, and L. Bo, “An image recognition algorithm based on thickness of ice cover of transmission line,” in Proc. IEEE International Conference on Image Analysis and Signal Processing (IASP), 2011, pp. 210-213.
[13] B. Akbal, M. Aydın “Multilevel thresholding and artificial intelligence methods to detect the thickness of iced conductor in ambient conditions,” Turk J Elec Eng & Comp Sci, 2015.
[14] N. Otsu, “A threshold selection method from gray-level histograms,”
IEEE Transactions on Systems, Man and Cybernetics, vol. 9, pp. 62-66, 1979.
[15] M. Sezgin, “Quantitative evaluation of image thresholding methods and application to nondestructive testing,” Ph.D., İstanbul Technical University Graduate School of Science Engineering and Technology, İstanbul, Turkey, 2002.
[16] E. Rashedi, H. Nezamabadi, and S. Saryazdi, “GSA: A gravitational search algorithm,” Elsevier Information Sciences, vol. 179, pp. 2232–2248, June 2009.
B. Akbal was born in Elbistan, Turkey, in 1983. He received the B.Sc. degree in Electrical-Electronics Engineering Department from Inonu University, Malatya, Turkey, in 2006 and the M.Sc. degree in Electrical-Electronics Engineering Department from Selçuk University, Konya, Turkey in 2011 and then, the Ph.D degree in Electrical-Electronics Engineering Department from Selçuk University, Konya, Turkey in 2015. He has studied in Electrical-Electronics Engineering Department from Selçuk University as a Dr. research assistant. His areas of research include electrical energy transmission and distribution, power system stability, optimization techniques and artificial intelligent, industrial automation, power quality.