Big IoT Data Analysis: A Generic Overview
1
Emmy Bhatti,
2Sonia Sharma
1,2Dept. of CET, Guru Nanak Dev University, Amritsar, Punjab, India
Abstract
Voluminous amounts of data have been produced since the past decade as the miniaturization of Internet of things (IoT) devices increases. However, such data are not useful without analytic power. Numerous big data, IoT and analytics solutions have enabled people to obtain valuable insight into large data generated by IoT devices. However, these solutions are still in their infancy, and the domain lacks a comprehensive survey. This study provides a generic overview of big IoT data analytics. The relationship between big data analytics and IoT is explained. Architecture-cum-framework for big IoT data analytics with cloud is presented here. Several opportunities brought by data analytics in IoT paradigm are then discussed. Next comes the open research challenges, such as privacy, big data mining, visualization, and integration, presented as future research directions. And lastly, two applications of big Iot data are described as examples of the technology.
Keywords
Big Data, Internet of things, Data analytics, Distributed computing, Smart city.
I. Introduction
A. IoT
IoT offers a platform for sensors and devices to communicate seamlessly within a smart environment and enables information sharing across platforms in a convenient manner. The recent adaptation of different wireless technologies places IoT as the next
revolutionary technology by benefiting from the full opportunities
offered by the Internet technology. IoT has witnessed its recent adoption in smart cities with interest in developing intelligent
systems, such as smart office, smart retail, smart agriculture, smart
water, smart transportation, smart healthcare, and smart energy. IoT has emerged as a new trend in the last few years, where mobile devices, transportation facilities, public facilities, and home appliances can all be used as data acquisition equipment in IoT. All surrounding electronic equipment to facilitate daily life operations, such as wristwatches, vending machines, emergency alarms, and garage doors, as well as home appliances, such as refrigerators, microwave ovens, air conditioners, and water heaters are connected to an IoT network and can be controlled remotely.
A large number of communication devices in the IoT paradigm are embedded into sensor devices in the real world. Data collecting devices sense data and transmit these data using embedded communication devices. The continuum of devices and objects are interconnected through a variety of communication solutions, such as Bluetooth, WiFi, ZigBee, and GSM. These communication devices transmit data and receive commands from remotely controlled devices, which allow direct integration with the physical world through computer-based systems to improve living standards.
A paper mentioned that IoT could be recognized in three paradigms: Internet-oriented, sensors, and knowledge. The recent adaptation of different wireless technologies places IoT as the next revolutionary
technology by benefiting from the full opportunities offered by
Internet technology.
B. Big data
The volume of data generated by sensors, devices, social media, health care applications, temperature sensors, and various other software applications and digital devices that continuously generate large amounts of structured, unstructured, or semi-structured data
is strongly increasing. This massive data generation results in ―big data. Traditional database systems are inefficient when storing,
processing, and analyzing rapidly growing amount of data or big
data. The term ―big data has been used in the previous literature
but is relatively new in business and IT. McKinsey Global Institute
defined big data as the size of data sets that are a better database
system tool than the usual tools for capturing, storing, processing, and analyzing such data.
The Digital Universe study labels big data technologies as a new generation of technologies and architectures that aim to take out the value from a massive volume of data with various formats by enabling high velocity capture, discovery, and analysis. The 3V’s model highlights an e-commerce trend in data management that faces challenges to manage volume or size of data, variety or different sources of data, and velocity or speed of data creation. The researchers introduced additional characteristics for big data, such as veracity, value, variability, and complexity. The 3V‘s model, or its derivations, is the most common descriptions of the
term ―big data.[1]
II. Relationship Between IoT and Big Data Analytics
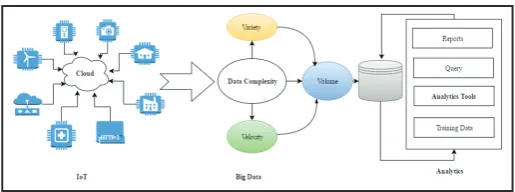
Fig. 1:
Big data analytics is rapidly emerging as a key IoT initiative to improve decision making. One of the most prominent features of
IoT is its analysis of information about ―connected things. Big
data analytics in IoT requires processing a large amount of data
on the fly and storing the data in various storage technologies.
Given that much of the unstructured data are gathered directly from
web-enabled ―things, big data implementations will necessitate
performing lightning-fast analytics with large queries to allow organizations to gain rapid insights, make quick decisions, and interact with people and other devices. The interconnection of sensing and actuating devices provide the capability to share
information across platforms through a unified architecture and
in the fields of IT and business. Although, the development of big
data is already lagging, these technologies are inter-dependent and should be jointly developed. In general, the deployment of IoT increases the amount of data in quantity and category; hence, offering the opportunity for the application and development of big data analytics. Moreover, the application of big data technologies in IoT accelerates the research advances and business models of IoT. The relationship between IoT and big data, which is shown
in the figure above, can be divided into three steps to enable the management of IoT data. The first step comprises managing IoT
data sources, where connected sensors devices use applications to interact with one another. For example, the interaction of devices
such as CCTV cameras, smart traffic lights, and smart home
devices, generates large amounts of data sources with different formats. This data can be stored in low cost commodity storage on the cloud. In the second step, the generated data are called
―big data, which are based on their volume, velocity, and variety. These huge amounts of data are stored in big data files in shared
distributed fault tolerant databases. The last step applies analytics tools such as MapReduce, Spark, Splunk, and Skytree that can analyze the stored big IoT data sets. The four levels of analytics start from training data, then move on to analytics tools, queries,
and reports [1].
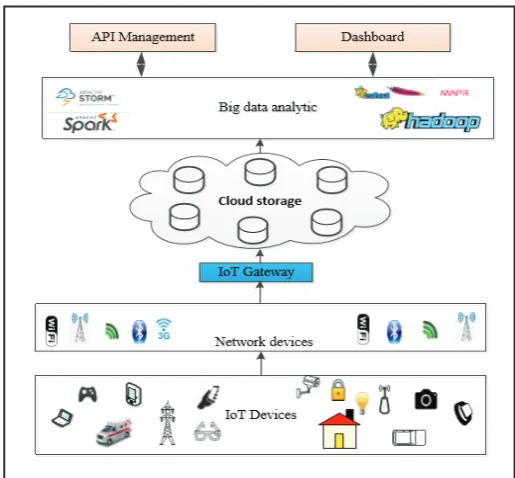
III. The Functional Framework Of Cloud-Based IoT Applications
Fig. 2: IoT Architecture and big Data Analytics
The framework is divided into several functional modules as follows:
Data Acquisition and Integration Module:
• As an input module, how to acquire and integrate heterogeneous data from distributed and mobile devices is a fundamental problem for the whole system construction.
Data Storage Module:
• Considering different types of IoT data including structured, semi-structured, and unstructured data of huge
quantity, different kinds of database or file system such as XML files in HDFS(Hadoop distributed file system),RDBMS(relational database management system), NoSQL(Not only SQL). A NoSQL database provides a mechanism for storage and retrieval of
data that is modelled in means other than the tabular relations used in relational databases.), Graph DBMS should be combined
to achieve a high efficiency for data storage in cloud platforms.
Table 1: Comparison Betbeen Data Storage Types
Data Management Module:
• For the purpose of searching and retrieving data from huge volume of data sources with high
efficiency, different approaches such as data index, metadata, semantic relations and linked data are realized for data management
in different platforms.
Data Processing Module:
• In cloud platform, mass data processing mechanisms such as MapReduce are constructed for parallel
and distributed data processing. Data querying and reasoning can be carried out in a more flexible way to adapt to large volumes
of data.
Data Mining Module:
• Considering that data from sensors are always raw and low-level data, high-level information needs to
be extracted, classified, abstracted and analyzed for application purpose. Thus data mining on IoT data mainly aims to achieve
comprehensive views or data analysis results for end-users.
Table 3: Comparison Between Data Mining Methods
Application Optimization Module:
• Based on application
analysis, related algorithms or approaches are required for processing IoT data in cloud platform providing different performance requirements, such as Decreased I/O, Accelerated convergence, Security, Scalability, Availability, Management,
Decreased Cost and Price, etc. [2][5].
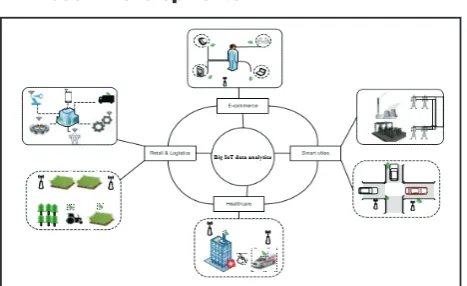
IV. Present Developments
Fig. 3: Example of use case and Opportunities for Big IoT Data Analytics Architecture
IoT is currently considered one of the most profound transitions in technology. Current IoT provides several data analytics opportunities for big data analytics. Fig. 4 shows the examples of use cases and opportunities discussed below.
A. E-commerce
Big IoT data analytics offers well-designed tools to process real-time big data, which produce real-timely results for decision making. Big Iot data exhibit heterogeneity, increasing volume, and real-time data processing features. The convergence of big data with IoT brings new challenges and opportunities to build a smart environment. Big IoT data analytics has widespread applications
in nearly every industry. However, the main success areas of analytics are in e-commerce, revenue growth, increased customer size, accuracy of sale forecast results, product optimization, risk management, and improved customer segmentation.
B. Smart Cities
Big data collected from smart cities offer new opportunities in
which efficiency gains can be achieved through an appropriate
analytics platform/infrastructure to analyze big IoT data. Various devices connect to the Internet in a smart environment and share information. Moreover, the cost of storing data has been reduced dramatically after the invention of cloud computing technology. Analysis capabilities have made huge leaps. Thus, the role of big data in a smart city can potentially transform every sector of the economy of a nation. Hadoop with YARN resource manager has offered recent advancement in big data technology to support and handle numerous workloads, real-time processing, and streaming data ingestion.
C. Retail and logistics
IoT is expected to play a key role as an emerging technology in the area of retail and logistics. In logistics, RFID keeps track of containers, pallets, and crates. In addition, considerable advancements in IoT technologies can facilitate retailers by
providing several benefits. However, IoT devices generate large
amounts of data on a daily basis. Thus, powerful data analytics enables enterprises to gain insights from the voluminous amounts of data produced through IoT technologies. Applying data analytics to logistic data sets can improve the shipment experience of
customers. Moreover, retail companies can earn additional profit
by analyzing customer data, which can predict the trends and demands of goods. By looking into customer data, optimizing
D. Healthcare
Recent years have witnessed tremendous growth in smart health monitoring devices. These devices generate enormous amounts of data. Thus, applying data analytics to data collected from fetal monitors, electrocardiograms, temperature monitors, or blood
glucose level monitors can help healthcare specialists efficiently
assess the physical conditions of patients. Moreover, data analytics enables healthcare professionals to diagnose serious diseases in their early stages to help save lives. Furthermore, data analytics improves the clinical quality of care and ensures the safety of
patients. In addition, physician profile can be reviewed by looking
into the history of treatment of patients, which can improve
customer satisfaction, acquisition, and retention [1]-[4].
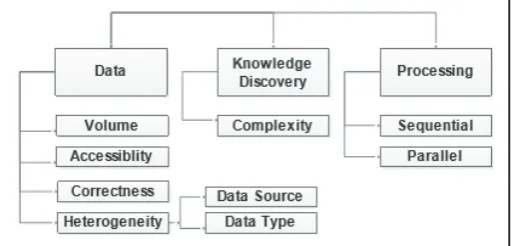
V. Challenges
IoT and big data analytics have been extensively accepted by many organizations. However, these technologies are still in their early stages. Several existing research challenges have not yet been
addressed. This section presents several challenges in the field
of big IoT data analytics.
Fig. 4: Big Data Mining Issues in IoT
A. Privacy
Privacy issues arise when a system is compromised to infer or restore personal information using big data analytics tools, although data are generated from anonymous users. Most people are reluctant to rely on systems, which do not provide solid
service-level agreement (SLA) conditions regarding user personal
information theft or misuse. Another security risk associated with IoT data is the heterogeneity of the types of devices used and the nature of generated data
B. Data mining
Data mining methods provide efficient and best-fitting predictive
or descriptive solutions for big data that can also be generalized for new data. The size and heterogeneity of data impose new data mining requirements, and diversity in data sources also poses
a challenge. Large data sets comprise more abnormalities and
ambiguities that require additional preprocessing steps. Another issue lies in the extraction of exact and knowledgeable information from the large volumes of diverse data.
C. Visualization
Visualization is an important entity in big data analytics, particularly when dealing with IoT systems where data are generated enormously. Furthermore, conducting data visualization
is difficult because of the large size and high dimension of big
data. Similarly, response time is a desirable factor in big IoT data analytics.
D. Integration
Integration refers to having a uniform view of different formats. Data integration provides a single view of the data arriving from different sources and combines the view of data. Integrating diverse data types is a complex task in merging different systems or applications. Overlapping the same data, increasing performance and scalability, and enabling real-time data access are among the challenges associated with data integration that should be addressed in the future. Another challenge is to adjust structures in semi-structured and unstructured data before integrating and analyzing these types of data. So, new technologies should be developed to extract images, videos, and other information from
other non-text formats of unstructured data [1][4].
VI. Two Applications of Big Data to Smart Cities
In this section two examples of services of smart city are described. In both scenarios it is addressed the perspective of the processing
techniques classification put forward in Section II, and the data
sources diversity introduced in Section III. The services cited here are framed in the smart city of Murcia, located in Spain.
A. Smart Campus of the University of Murcia
The EU project SMARTIE is targeting a secure IoT platform for smart cities. Its core focus is on developing a number of technologies
to fulfil the needs of the different users of such a platform with
respect to security, privacy and trust. For better understanding
the specific requirements, as well as demonstrating the results,
the SMARTIE project has three concrete use cases in the areas of
traffic, energy management and transport. In this work we focus
on the energy management use case which is implemented in the SmartCampus of Espinardo of the University of Murcia. The goal of this use case is to provide a reference system able to manage intelligently the energy use of the most relevant contributor to the
energy use at city level, i.e. buildings. To achieve energy efficiency
in buildings, it is required the interaction between a number of actors and entities providing energy monitoring and consumption feedback, using automation systems, sensors and actuators, and carrying out economic strategies to save energy. Following this approach, in this scenario we propose to extract useful information about the context of buildings, which, after processing, allows recognition of behaviour patterns of aspects involved in energy consumption to make optimal decisions on saving energy. In this direction, during the data analysis carried out, localization of
building occupants was identified as a main problem which needed
to be faced. To solve this, we proposed a solution based on a hybrid mechanism that fuses information provided by infrared (IR) and
radio-frequency identification (RFID) sensors. In previous works,
this solution is described in detail. The data processing techniques implemented are based on Radial Basis Functions networks to estimate the location of occupants, and a Particle Filter to track
their next positions. The mean error obtained is 1 m., which is sufficient to provide users with individualized comfort conditions
in the context of buildings. Once solved the localization problem, we can split the overall problem of energy building management
into three simpler subproblems (see Figure 1) related with:
The estimation of optimum comfort conditions in each
•
location of the building;
The estimation of energy consumption involved in such
•
comfort conditions; and,
Optimization of the setting of those comfort devices involved
•
in the target locations in such a way that they ensure the
The energy performance model of our building management
system is based on the CEN Standard EN 15251, which specifies
the design criteria to be used for dimensioning the energy system
in buildings, establishing and defining the main input parameters
for estimating building energy requirements and evaluating the
indoor environment conditions. In Figure 1 it is reflected the inputs
considered to solve our problem, which are the data coming from the RFID cards of users, the user interaction with the system through the control panels or the web access, environmental parameters coming from temperature, humidity and lighting sensors installed in outdoor and indoor spaces, the consumption energy sensed by the energy meters installed in the building, and the generated energy sensed by the energy meters installed in the solar panels deployed in our testbed. Regarding the computational techniques applied to solve this type of problem, Neural Networks (NNs),
Fuzzy Logic Systems (FLSs) and Genetic Algorithms (GAs)
are the most commonly applied by researchers and developers. Since a key issue in the design of our intelligent system is that it must be understandable to the end users, and be able to show the reasons for the actions automatically proposed, we decided to use fuzzy logic techniques to solve the problems mentioned in
Figure 1. Fuzzy techniques offer a framework for representing
imprecise and uncertain knowledge in a similar way to that in which people make their own decisions. Thus, it is possible to
identify anomalies and configuration errors of the system, and then
users can understand the reasons for such suggested actions, using this as a learning tool. Then, a combination of techniques based on behavior centered mechanisms and computational intelligence were implemented to solve the comfort and energy management of our target buildings. To evaluate and validate our solution, experiments were carried out in several reference buildings of the SmartCampus of Espinardo. As result of the experiments carried out, daily energy saving values were achieved during the month of operation of our energy management system compared with the previous month. With the aim of validating our building energy management proposal in a conventional building with reduced monitoring and automation capabilities, which does not belong to the SmartCampus deployment, we selected a commercial building where different actions (monitoring, analysis and control) to save energy were carried out. From these actions, we achieved energy saving of about 23%. In this way, we demonstrate the applicability of the management system proposed in this work through its installation in different buildings. More details about these experiments can be found in.
Fig. 5: Home Automation Module (HAM)
C. Public Tram service of Murcia City
The second scenario centres on the tram service of the city of
Murcia (Spain)2. Such service’s infrastructure includes 18-km railway with 28 different stations.
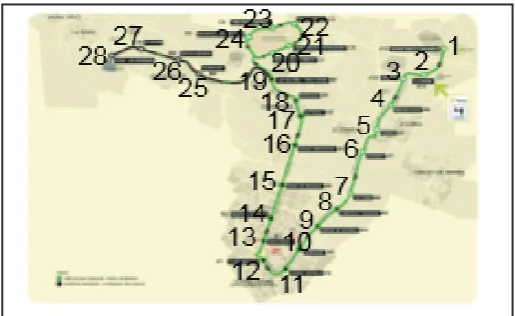
Fig. 6: Line Map of the Tram service in Murcia
Fig. 6 depicts the current line map of the service. The key goal of
the study was to extract different profiles of travellers of a public
transit system at the same the transactions of the transit cards they hold are generated. Since the service’s automatic fare system only requires users to validate their transit cards every time they get into a tram but not when they alight, the smart-card recorded data is incomplete because only the transaction at the origin of each trip is registered. A well-known solution to deal with this incompleteness is know as the trip-chaining method. This method intends to recover both the origin and destination of each trip on the
basis of several pre-defined assumptions. In the present scenario, a
solution based on Complex Event Processing (CEP) was proposed to timely extract the underlying trips from the records generated by the transit cards of the public transport service (e.g tram, subway, bus) is stated. Such solution is combined with a fuzzy clustering
algorithm to automatically identify profiles in a semi real-time
approach in order to eventually extract meaningful patterns of usage of the target public service. Firstly, CEP is used to timely extract trips as origin destination tuples from card records that only contain the origin of each trip. This destination recovery is done by means of the aforementioned trip-chaining method. Unlike previous proposals, the timely generation of the trips allows to use them to early detect potential card-usage fraud. Thus, the present solution does not limit to extract the regular trips card holders perform, but also it is capable of detecting certain “irregular“ trips due to an incorrect usage of the cards. Next, the
Gustafson-Kessel algorithm [34] is applied to the tuples to identify groups with similar features representing different profiles of usage of the
public transport. This algorithm was selected due to its capacity to identify clusters with different shapes and orientations. As a result, unlike other pattern mining approaches which only focus on extracting individual mobility patterns, this clustering step
allows to extract more general profiles of the public transport
which can be more useful for stakeholders. As a result, given a
dataset comprising 378719 transactions from 23400 unique users, our solution was able to extract 110697 trips. Figure 3 shows an
histogram of how many times each station of the service was either the origin or destination of one trip. As we can see, most
of the trips started on ended in four stations (11, 12, 13 and 14).
In particular, almost half of the detected trips started or ended
at station 12. These are the stations closer to the city center of
Murcia and, unsurprisingly, they are the ones with higher density
of traffic. Other stations with a remarkable flow of travellers are
Fig. 7: Number of time each station has been a trip's origin or destination
Next, the dataset of mined was divided into 4 subsets depending
on the day of the week each trip refer to (1. Monday-Thursday,
2. Friday, 3. Saturday and 4. Sunday). This was done to generate
different traveller profiles depending on the day of the week. This
is useful for many transit service providers as they intuitively
know that the traffic flow varies in a certain degree from regular
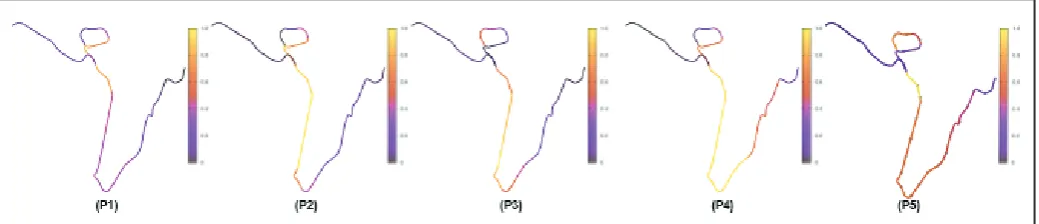
workdays to weekends. Then, the fuzzy-clustering algorithm was executed with each subset. Finally, Figure 4 depicts as a heat map
the membership of each Monday-Thursday trip to each of the five profiles described above. If we regard this figure as a time-framed
sequence, we can see that most of the traffic load is concentrated
at the right side of the line (the one which goes from the city center to the university areas) during almost all the day. However,
during the evening such traffic is more spread along the whole
tram line. To sum up, all the results from the experiments allowed the service staff to draw up quite interesting conclusions. First
of all, experiments confirmed that most of the tram users were college students. As a consequence, most of the traffic flow was
concentrated in the line segment between the inner city and the campuses. This was of great help to come up with more tempting promotional campaigns focusing on such type of young users so as to engage them in using the tram service more regularly. Moreover, the frequency of trains moving along the inner
city-campuses segment was modified by considering the start and
end time of classes. This allowed to optimize the trains’ schedule and, thus, reduce the number of packed carriages. Secondly,
results also confirmed the underuse of the line segment towards
the shopping-mall areas. As a result, campaigns to promote the
use of the tram for shopping purposes were devised. Lastly, the
formal discovery of the stations’ load in terms of trips’ origin and destination would allow the service provider and the city council to better plan the whole public transport service of the city. This way, the more important stations might be considered as “hub“ points where commuters can easily transfer from tram to another kinds of transport. Moreover, such an information could be also useful so as to forecast future infrastructure needs in each part of the tram line (e.g. location and number of places of new parking
lots for bicycles close to tram stations) [3].
Fig. 8: Heat-map of the Tram Line for the five Profiles for Monday - Thursday
VII. Conclusion
The growth rate of data production has increased drastically over the past years with the proliferation of smart and sensor devices. The interaction between IoT and big data is currently at a stage where processing, transforming, and analyzing large amounts of data at a high frequency are necessary. We conducted this survey in the context of big IoT data analytics. First, we introduced both the terms i.e., big data and Iot. The relationship between big data analytics and IoT was also discussed. Moreover, we proposed a framework for big IoT data analytics. Some credible use cases were also provided. In addition, we explored the domain by discussing various opportunities brought about by data analytics in the IoT paradigm. Several open research challenges were discussed as future research directions. Also two application of big data with iot are explained. Finally, we concluded that existing big IoT data analytics solutions remained in their early stages of development. In the future, real-time analytics solution that can provide quick insights will be required.
References
[1] Mohsen Marjani, Fariza Nasaruddin, Abdullah Gani, Ahmad
Karim, Ibrahim Abaker Targio Hashem, Aisha Siddiqa, Ibrar Yaqoob,"Big IoT Data Analytics: Architecture, Opportunities, and Open Research Challenges".
[2] Hongming Cai, Boyi Xu, Lihong Jiang, Athanasios V.
Vasilakos,"IoT-based Big Data Storage Systems in Cloud Computing: Perspectives and Challenges".
[3] Victoria Moreno-Cano, Fernando Terroso-Saenz, Antonio
F. Skarmeta-Gómez,"Big Data for IoT Services in Smart Cities", Department of Information and Communications
Engineering University of Murcia, Murcia, 30100 Spain [4] Tiainen, P., New opportunities in electrical engineering as a
result of the emergence of the Internet of Things. 2016. [5] S. Villarroya, D.M. Casas, M. Vilar, J. R.R. Viqueira, J.A. Taboada, J.M. Cotos,“Heterogeneous sensor data integration
for crowdsensing applications”, In Proceedings of the