Non Linear Model : Logit Model Application for
The Study of Catalyst Dosage Effect in Methylene
Blue Photodegradation
J. Nugraha
1and I. Fatimah
21Statistics Department , Islamic University of Indonesia, Yogyakarta. Kampus Terpadu UII, Jl. Kaliurang Km 14, Besi,
Yogyakarta, Indonesia 55581, Email : [email protected]
2Chemistry Department , Islamic University of Indonesia, Yogyakarta, Email : [email protected]
Abstract-- This paper present the role of Logit Model in optimizing photocatalyst dosage in methylene blue (MB) photodegradation system by using prepared photocatalyst. The model was constructed by measuring the percentage of target molecule degraded in the system by using linear and logistic regression. The deviation of the model used to compare the goodness of fit of the three models. The study on the most appropriate model for predicting the effect of catalyst dosage to the MB concentration is discussed.
Index Term
—
Logit Model, Kinetics data, Photodegradation, Methylene BlueI. INTRODUCTION
The textile industry is one of the most polluting industries generating large volumes of wastewater during cloth dyeing and washing processes. Effluents released from textile industries contain highly organic and often the toxic compounds with non-degradable properties. Many treatment techniques including chemical, physical and biological process have been applied to reduce the toxicity to the environment. Each procedure has limitation and specification regarding to the efficiency and cost. One of most popular technique is heterogeneous photocatalysis technique. Heterogeneous photocatalysis is a promising method among advanced oxidation processes (AOPs), which can be used for degradation of various organic pollutants in wastewater. A combination of semiconductor phiticatalyst such as TiO2, ZnO, Fe2O3, CdS and ZnS with
UV or visible lights can be used. TiO2 is the most popular
material in photocatalysis application. As reported in previous literature, to improve TiO2 activity and enhance its
stability in utilization, immobilization of TiO2 on stable
solid support were investigated [1-3]. One interesting support reported was Al2O3-montmorillonite reported by
Fatimah et al.(2009) [2]. Highly activity of prepared material was evaluated follow the Langmuir-Hinshelwood (L-H) kinetics model. By this model, it was predicted that adsorption process affecting photocatalytic activity. Accordingly, several parameters determining adsorption rate play important roles to determine the photocatalytic activity. As the surface area promote the activity, effect of catalyst
dosage is proposed to be significant to the degradation rate. This paper present the utilisation of statistical modelling to predict the effect of catalyst dosage to the methylene blue(MB) photodegradation by catalyst reported in previous research.
In the most general terms, On modeling, computation will be used to express the relationship between a set of independent variables and a dependent variable. For example, we may want to compute the relationship between the dose of a drug and its effectiveness, the relationship between training and subsequent performance on a task, the relationship between the price of a house and the time it takes to sell it, etc. We may recognize research issues in these examples that are commonly addressed by such techniques as multiple regression or analysis of variance. Multiple regression and analysis of variance assume that the relationship between the independent variable(s) and the dependent variable is
linear in nature. Nonlinear Estimation leaves it up to you to specify the nature of the relationship; for example, we may specify the dependent variable to be a logarithmic function of the independent variable(s), an exponential function, a function of some complex ratio of independent measures, etc[7-8]. Some of non linear modeling and statistical approach for catalyst preparation and application is also reported from previous research [4-6]. Included within this type of modeling is multiple regression analysis.
For multiple Regression, we assume the dependent variable to be a linear function of the independent variables, that is:
xi kxki xi
y 0 1 1 ... '
(1)
between 0 and 1) is ignored as the standard multiple regression procedure used. Nonlinear Estimation allows to specify essentially any type of continuous or discontinuous regression model. Some of the most common nonlinear models are probit, logit, exponential growth, and breakpoint regression.
In the logit regression model, the predicted values for the dependent variable will never be less than (or equal to) 0, or greater than (or equal to) 1, regardless of the values of the independent variables.
) ' exp( 1
) ' exp(
i i i
x x
(2)
This model will always produce predicted values in the range of 0 to 1. While the left-hand-side is in the familiar probability scale, the right-handside is a non-linear function of the predictors, and there is no simple way to express the effect on the probability of increasing a predictor by one unit while holding the other variables constant. The effect of the j-th predictor on the probability i depends on the coefficient j and the value of the probability (Agresti, 2005). Analysts sometimes evaluate this product setting i to the sample mean (the proportion of cases with the attribute of interest in the sample). The result approximates the effect of the covariate near the mean of the response.
Both linear and logit regression model (logistic regression) were developed in R program. The generalized linear modeling (“glm”) function was used for both methods. The link function for logistic regression is “binomial” and for linear regression is “gaussian.” The full models generated by each approach, with the same number of terms in the same format, were used to ensure the validity of the comparison.
To compare the model prediction, out-of-range predictions from linear models were counted and the number of predictions from logistic regression that were closer to the observed values was also calculated. the deviation of the model from observations was calculated as follows:
2
predicted observed
Devian (3)
At smaller devian, the model predictions were close relate to the observations. The method can detect predictions far out from that were observed and allows for detection of those wide deviations by measuring the range of the differences between the predicted and observed values.
II. METHODOLOGY
Photodegradation reaction of MB was conducted by using TM catalyst with the specific surface area of 109.88 m2/g in a batch system. Data of MB concentration in treated
and logit model 2 (LM 2). The appropriate model was measured statistically based on the goodness of fit of the model.
III. RESULT AND DISCUSSION
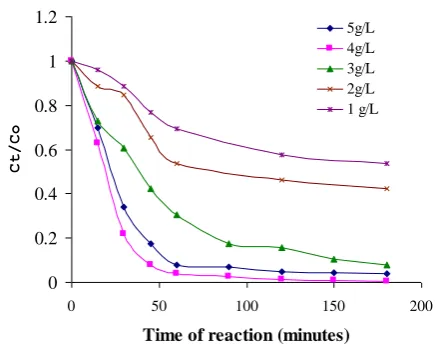
Photocatalytic degradation of MB was conducted in various dosage of TM catalyst. The fraction of MB in treated solution was measured as the percentage of MB (MB at time of t / MB at initial time). Effect of catalyst dosage to the MB degradation kinetics is depicted in Figure 1.
The curve describes the information addition of catalyst dosage increased MB degradation rate. This trend is in agreement with Langmuir-Hinshelwood model in which adsorption process forced the activity of MB photodegradation.
0 0.2 0.4 0.6 0.8 1 1.2
0 50 100 150 200
Time of reaction (minutes)
Ct/Co
5g/L 4g/L 3g/L 2g/L 1 g/L
Fig. 1. Kinetics of MB photodegradation in various TM catalyst dosage
This research was aimed to find the model between
weight and MB fraction in treated solution. Three
models: linear transformation model (LTM), logit
model 1 (LM 1) and logit model 2 (LM 2). The
models obtained by all model used are as follow:
a. LTM
ln(
)= 1.77 - 0.805 Weight - 0.0136 Time
(4.57) (-6.31)
(-5.69)
= exp(1.77 - 0.805 Weight - 0.0136 Time) (4)
b. LM 1
) 29 . 1 036612
. 0 7154 . 5 exp( 1
) 29 . 1 036612
. 0 7154 . 5 exp(
Weight Time
Weight Time
(5)
or
Weight
Time 1.29
036612 . 0 7154 . 5 )
Weight Time) 1.52 ln(
71789 . 1 10.7552 )
1
ln(
(55.08)
(-60.58)
(-38.83)
Quantitiy (in the bracket) is statistic z informing that
effect of time variable and weight in all model are
significant.
Weight 1
0 0.5 1 1.5 2 2.5 3
0 50 100 150 200
Time
P
er
ce
n
t
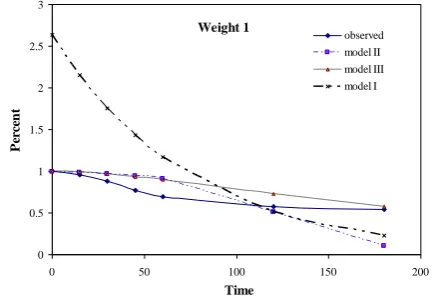
observed model II model III model I
Fig. 2. Scatter plot of kinetics data on the dosage of 1 g/L.
Weight 2
0 0.2 0.4 0.6 0.8 1 1.2 1.4
0 30 60 90 120 150 180 210
Time
P
er
ce
n
t
observed model II model III model I
Fi. 3. Scatter plot of kinetics data on the dosage of 2 g/L.
Weight 3
0 0.2 0.4 0.6 0.8 1 1.2
0 30 60 90 120 150 180 210
Time
P
er
ce
n
t
observed model II model III model I
Fig. 4. Scatter plot of kinetics data on the dosage of 4 g/L.
Weight 1
0 0.5 1 1.5 2 2.5 3
0 50 100 150 200
Time
P
er
ce
n
t
observed model II model III model I
Fig. 5. Scatter plot of kinetics data on the dosage of 4 g/L.
0 minute
0 0.5 1 1.5 2 2.5 3
0 1 2 3 4 5
Weight
P
er
ce
n
t
observed model II model III model I
Fig. 6. Scatter plot of kinetics data in the time of 0 minute.
15 minutes
0 0.5 1 1.5 2 2.5
0 1 2 3 4 5
Weight
P
er
ce
n
t
observed
model II
model III
model I
30 minutes
0 0.5 1 1.5 2 2.5
0 1 2 3 4 5
Weight
Percent
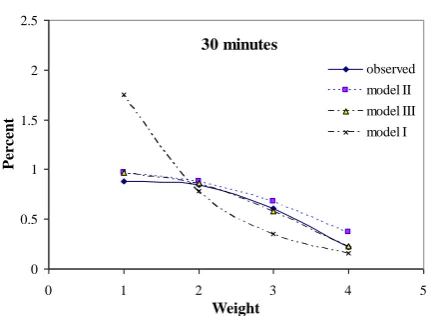
observed model II model III model I
Fig. 8. Scatter plot of kinetics data in the time of 30 minutes.
45 minutes
0 0.5 1 1.5 2
0 1 2 3 4 5
Weight
P
er
ce
n
t
observed model II model III model I
Fig. 9. Scatter plot of kinetics data in the time of 45 minutes.
60 minutes
0 0.5 1 1.5
0 1 2 3 4 5
Weight
P
er
ce
n
t
observed model II model III model I
Fig. 10. Scatter plot of kinetics data in the time of 60 minutes.
120 minutes
0 0.25 0.5 0.75 1
0 1 2 3 4 5
Weight
Percent
observed model II model III model I
Fig. 11. Scatter plot of kinetics data in the time of 120 minutes.
180 minutes
0 0.25 0.5 0.75 1
0 1 2 3 4 5
Weight
P
er
ce
n
t
observed model II model III model I
Fig. 12. Scatter plot of kinetics data in the time of 180 minutes.
Figure 2 to Figure 5 depict the scatter plot between the pertentage of MB as function of treatment time using varied catalyst dosage ( 1 g/L to 4 g/L). Figure 6 to Figure 12 are the scatter plots of MB concentration in each catalyst dosage (stated as weight).
Based on Figure 2, Figure 3, and Figure 6 to Figure 10, it is seen that at the dosage of 1 g/L the value predicted by linear approximation is more than 100%. It is indicate that the model is not proper for prediction. Another facts were shown based on Figure 2, Figure 4 and Figure 5 in that there was big bias of predicted value and observed value compared to the LM method.
The third model (LM2) is the most accurate model caused the value predicted was nearest value to the observed value. Focused to the dosage of 4g/L, time of 120 min and 180 min, it is found that the data are in agreement as shown as strenghtened by the deviance value for LTM with the value of 6.987732. In other case, the deviance value for LM 1 is 0.843322 and for LM 2 is 0.216831.
IV. CONCLUSION
ACKNOWLEDGMENT
Authors are acknowledged for the financial support from research grant Hibah Penelitian Mahasiswa Doktor
2009, DP2M-DIKTI via Lembaga Penelitian dan
Pengabdian pada Masyarakat, Gadjah Mada University.
REFERENCES
[1] K. Rajeshwar,Osugi, Chanmanee, C.R. Chenthamarakshana, M.V.B. Zanonib, P. Kajitvichyanukuld, R. Krishnan-Ayera”Heterogeneous photocatalytic treatment of organic dyes in air and aqueous media”, J.Photochem.Photobiol.9 (2008) 15–36. doi:10.1016/j.jphotochemrev.2008.09.001
[2] I.Fatimah, K. Wijaya Narsito and S.Wang,” Preparation of TiO2/Aluminium Pillared Montmorillonite and its Application
for Methylene Blue Photodegradation under UV Illumination”. World Journal of Chemistry. 4(1):21-26; 2009.
[3] L. Pirkanniemi and R. Sillanpaa,”Heterogeneous water phase catalysis as an environmental application: a review”, Chemosphere 48 (2002 :1047–1060, PII: S00 4 5-6 5 35 (0 2 )0 01 6 8- 6.
[4] C.J.Lee , D. Kumar, V.Prasad and J.M.Lee, “A Stochastic Approach to Catalyst Optimization: Robust Design of Experiments and Catalysts”, AIChe Proceeding 2010.
[5] N. El Boulifi, A. Bouaid, M. Martinez, and J. Aracil, “ Process Optimization for Biodiesel Production from Corn Oil and Its Oxidative Stability”, International Journal of Chemical Engineering (2010): Article ID 518070, 9 pages, doi:10.1155/2010/518070
[6] Ch. Venkateswarlu and A. Damodar Reddy, “Nonlinear Model Predictive Control of Reactive Distillation Based on Stochastic Optimization” Ind. Eng. Chem. Res., 2008, 47 (18), pp 6949– 6960
[7] A. Agresti ,2005, Categorical Data Analysis, John Wiley and Son
[8] R Development Core Team (2009), R: A language and
environment for statistical computing. R Foundation for