R E S E A R C H A R T I C L E
Open Access
Do dietary patterns explain high
prevalence of cardiovascular risk factors
among Pakistani urban adults? A
cross-sectional study
Nilofer F. Safdar
1*, Elizabeth Bertone-Johnson
2, Lorraine Cordeiro
3, Tazeen H. Jafar
4and Nancy L. Cohen
3Abstract
Background:The prevalence of cardiovascular disease (CVD) in South Asia is higher than in any other developing countries. The diversity of diets in populations among developing countries may be one explanation for the differences in CVD. This study was carried out to explore the association between dietary patterns and the presence of cardiovascular risk factors among Pakistani low income urban adults.
Methods:Socio demographic, physical activity and dietary information was collected from 1546 Pakistani subjects aged≥40 years from the Control of Hypertension and Risk Attenuation (COBRA) study. Anthropometric, clinical and biomarker measures were assessed. Cluster analysis was used to identify dietary patterns from a food frequency questionnaire (FFQ) and multinomial regression was employed to investigate the association between dietary clusters and cardiovascular risk factors, using one of the dietary clusters as a reference category.
Results:The most prevalent CVD risk factors among participants were elevated low density lipoprotein- cholesterol (LDL-C) (69.8 %) and systolic blood pressure (SBP) (68.2 %), followed by central obesity (57.1 %), low levels of high density lipoprotein-Cholesterol (HDL-C) (56.3 %), overall obesity (46.0 %), high total cholesterol (32.3 %), and elevated fasting blood sugar (FBS) (34.9 %). The cluster analysis generated 3 non-overlapping diet patterns. Cluster 1(Traditional Pakistani Diet), was dominated by fruits, vegetables, milk products and chicken, included participants with high mean body mass index (BMI), waist circumference (WC), HDL-C and low mean SBP. Cluster 2 (Moderate Diet) reflected a moderate intake of most food items and included participants with significantly higher mean SBP. Cluster 3 (Fatty Diet) was characterized by high intake of beef, whole milk,parathaand lentils and those following this cluster had a low mean HDL-C and high SBP. In analyses controlling for age, gender, tobacco use and physical activity, participants in the Traditional diet cluster were more likely to be overweight (OR 1.39, 95 % CI 1.08 to 1.78) and high central adiposity (1.33, 95 % CI 1.04 to 1.71) than participants in the Moderate diet cluster, though less likely to have elevated SBP (OR 0.67, 95 % CI 0.51 to 0.86). LDL-C levels were higher in both the traditional Pakistani diet and Fatty diet cluster compared to the Moderate diet cluster. Low HDL-C was also more prevalent among the Traditional Pakistani diet cluster.
Conclusion:Among Pakistani population discernable diet patterns can be derived using clusters analysis. CVD risk factors prevalence differed by cluster membership, though relations for specific CVD risk are not consistent across clusters.
(Continued on next page)
* Correspondence:[email protected]
1School of Public Health, Dow University of Health Sciences, KDA Scheme 33, Gulzar-e-Hijri, OJHA Campus, Suparco Road, Karachi 75270, Pakistan Full list of author information is available at the end of the article
(Continued from previous page)
Keywords:Dietary patterns, Cluster analysis, Biomarkers, Pakistan, Cardiovascular disease
Abbreviations:ANOVA, One-way analysis of variance; BMI, Body Mass Index; COBRA, Control of blood pressure
and risk attenuation; CVD, Cardiovascular disease; DBP, Diastolic blood pressure; FFQ, Food frequency
questionnaire; HDL-C, High density lipoprotein-cholesterol; IPAQ, International physical activity questionnaire; LDL-C, Low density lipoprotein-cholesterol; MET, Metabolic equivalent; OR, Odds ratio; SBP, Systolic blood pressure; TC, total cholesterol; TG, Ttriglycerides; FBS, Fasting blood glucose (FBS); WC, Waist circumference; WHR, Waist hip ratio
Background
Globally cardiovascular diseases (CVD) are a major con-tributor to chronic disease burden [1]. South Asians, in particular have a higher rate of acute myocardial infarc-tion, and develop CVD at a younger age than individuals from other countries [2, 3]; CVD is becoming a leading cause of premature adult mortality in the region [4], mainly due to increased occurrence of CVD risk factors including central obesity, hypertension, and dyslipide-mias among South Asians [3, 5]. Moreover, compared to other groups within the South Asian population, the prevalence of CVD has been found to be as high as 26.9 % among Pakistanis who are 40 years and older [2].
The quality of diet has been associated with the devel-opment of CVD [6]. Diet is a complex exposure variable and individual dietary factors (nutrients) are highly cor-related with one another. In addition to studies evaluat-ing individual nutrients, dietary patterns are now beevaluat-ing employed to better understand diet and disease relation-ships. Dietary pattern analyses integrate consumption of individual foods and nutrients into meaningful groups or patterns [7–9]. Cluster analysis is a data-driven analytical method useful to identify dietary patterns within a homogenous group of people; which are then treated as independent variables for analysis of associations with markers of disease risk and health outcomes [10].
Studies using CVD biomarkers can provide important evidence on the relation of dietary patterns and disease risk [11, 12]. For example, risk of CVD can be largely predicted by measurement of plasma lipids. Large pro-spective studies from the United States [7, 13, 14] and Europe [15, 16] linking diet patterns and triglycerides, cholesterol, low-density lipoprotein, and high-density lipoprotein cholesterol have shown inconsistency in the effect of overall diet on disease risk.
Given the well-recognized link between diet and CVD, an important step is to identify dietary patterns that are associated with CVD in specific populations [17, 18]. As there are variations and differences in dietary intakes across different populations, it is likely that risk factors of CVD differ among Pakistani people as compared to other populations [5, 19]. Limited research has been
conducted in Pakistan on dietary patterns and CVD risk factors [20, 21]. Previously we reported an associations between dietary pattern derived from factor analysis and socio-demographic, anthropometric, lifestyle characteris-tics and hypertension in Pakistani adults enrolled in the Control of Hypertension and Risk Attenuation (COBRA) study [22, 23]. In the current study, our aim is to derive dietary patterns using the cluster analysis method and investigate how these diet patterns are associated with CVD risk among Pakistani people aged 40 years and above.
Methods
Study design and participants
This study was a secondary analysis of the data from the COBRA trial of 2004–7 that tested the effectiveness of home-based health education to prevent and control high blood pressure in low income urban adults in Karachi, Pakistan [24]. The sampling technique and participants particulars of the COBRA trial have been described in greater detail elsewhere [25]. Briefly, the sampling volved randomly selecting 12 out of 4200 lower middle in-come (average household inin-come less than $70/month) household groups. Each group comprised of approxi-mately 250 houses with an average household size of 7 in-dividuals. The study population was further divided into three sub groups; children aged 5–14 years, younger adults aged 15–39 years, and older adults aged 40 years and above. At enrollment, all individuals aged 40 years or older were invited to participate in the study and 3143 agreed. After excluding 1418 individuals with self-reported history of hypertension, heart disease, kidney dis-ease, diabetes and stroke (because their condition may have altered their eating patterns) and those (n= 179) who refused biochemical testing, 1546 participants’ data were analyzed.
Assessment of diet
experiences with the study population. In addition, they reviewed available literature and information gathered through dietary surveys, which reflected the common dietary habits of the low income, Pakistani population. Using preliminary information, a 33-item FFQ was formulated to assess the intake of specific food items over the previous month without specifying the quan-tity or portion size. The FFQ contained questions about the frequency of intake of different food items such as type of locally used bread, meat types, cooked and uncooked vegetables, fruit and juices, milk and local dairy products, and cooked food dishes normally consumed by low income population and that may pose a risk to hypertension. The response options in the FFQ ranged from none to less than once per month, number of times per month, number of times per week, or number of times per day. The question-naire was pretested for input on content, language clarity, and layout and revisions were made accord-ingly for final data collection from the study cohort. All weekly food frequency variables were used to de-rive dietary patterns via cluster analysis.
Assessment of CVD risk factors
Cardiovascular risk factors including body weight, height, WC and blood pressure were measured and re-corded by trained field workers and technicians using calibrated equipment and standardized protocols de-scribed in detail elsewhere [24]. Body mass index (BMI) was calculated as weight/height2(kg/m2). WC was mea-sured at the mid-point between the iliac crest and the lower rib margin. SBP and diastolic blood pressure (DBP) were measured with a calibrated automated sphygmoman-ometer (Omron HEM-737 Intellisense Blood Pressure Monitor) by trained staff after the participants sat quietly for more than five minutes. Three consecutive readings were recorded with a five minute gap between each read-ing. The average of the last two blood pressure readings were recorded for each subject. Blood samples were col-lected after 10 h of overnight fast for the estimation of serum total cholesterol (TC), LDL-C, HDL-C, TG and FBS. Lab analyses were performed at the Aga Khan Uni-versity Hospital using the CHOD-PAP enzymatic end point method with the Colorimetric/Selectra Hitachi 912 analyzer (Roche Diagnostics, Switzerland) [27]. Lifestyle factors including physical activity was assessed with Inter-national Physical Activity Questionnaire (IPAQ) [28]. Average weekly duration of walking, moderate and vigor-ous activity was reported and computed as a metabolic equivalent (MET) score using Ainsworth's compendium [29]. Smoking status was assessed by gathering informa-tion on participant use of different forms of tobacco (cigarettes/cigars/biddi, pipe/huqqah, niswar, and to-bacco chewing with or without pan leaf ). Participants
were classified if they had never used tobacco in any form (never) versus those who used tobacco in the past but had stopped use in the last year (past) and those who were currently using tobacco in some form (current) user .
Each of the CVD risk factors were defined according to the evidence-based guidelines in the prevention of CVD and established criteria were used to evaluate each participant for all risk factors. Participants were classi-fied as: obese, kg/m2(BMI≥25, Asian criteria) [30]; hav-ing central obesity (WC of ≥90 cm in males or ≥80 cm in females, Asian-specific) [24]; having elevated SBP (≥120 mmHg) [31]; high cholesterol (≥200 mg/dl); high LDL-C (≥100 mg/dl); high TG (≥150 mg/dl); low HDL-C (<40 mg/dl) and elevated FBS (≥100 mg/dl) [32, 33]. Smoking and physical activity risk was determined if participants reported use of tobacco in any form and were physically inactive. Each cardiovascular risk factor was converted into dichotomous variables (categorical) indicating their presence or absence.
Statistical analysis
Data were analyzed using SPSS, version 16.0 (SPSS Inc, Chicago, IL). Gender differences in basic sociodemo-graphic and other baseline variables were assessed using independent sample t-tests and the values were reported as means ± SD if the data were continuous (age, BMI, WC, lipid biomarkers, and blood pressure). Categorical variables (educational status, tobacco use, physical activity) are presented as absolute and relative frequencies and their significance across gender were tested by chi-square test.
regression was conducted to assess association between cardiovascular risk factors and dietary patterns while controlling for age, gender, physical activity and tobacco use. All reported p-values are based on two-sided tests and compared to a significance level of 5 %.
Results
Participant characteristics
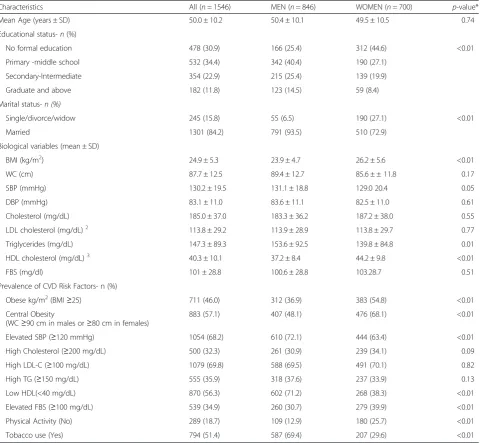
Complete data on 1546 subjects were available, repre-senting 89 % participation rate. Table 1 summarizes the physical characteristics of the subjects. Men represented 54.9 % of the total sample with no significant differences
in age between men and women. Women were less likely to have formal education as compared to men. The mean BMI in women was significantly higher than that of men, whereas SBP was higher in men as com-pared to women. For biomarkers, significant differences between men and women were seen for triglycerides and HDL-cholesterol. No other gender differences in blood lipids were found in the sample. When we analyzed the proportion of participants having various CVD risk fac-tors, there were none without any CVD risk factors. Risk of central and overall obesity as defined by WHO Asian criteria was higher in women than men. High SBP was
Table 1Baseline characteristics of the participants from the COBRA study
Characteristics All (n= 1546) MEN (n= 846) WOMEN (n= 700) p-value*
Mean Age (years ± SD) 50.0 ± 10.2 50.4 ± 10.1 49.5 ± 10.5 0.74
Educational status-n(%)
No formal education 478 (30.9) 166 (25.4) 312 (44.6) <0.01
Primary -middle school 532 (34.4) 342 (40.4) 190 (27.1)
Secondary-Intermediate 354 (22.9) 215 (25.4) 139 (19.9)
Graduate and above 182 (11.8) 123 (14.5) 59 (8.4)
Marital status-n (%)
Single/divorce/widow 245 (15.8) 55 (6.5) 190 (27.1) <0.01
Married 1301 (84.2) 791 (93.5) 510 (72.9)
Biological variables (mean ± SD)
BMI (kg/m2) 24.9 ± 5.3 23.9 ± 4.7 26.2 ± 5.6 <0.01
WC (cm) 87.7 ± 12.5 89.4 ± 12.7 85.6 ± ± 11.8 0.17
SBP (mmHg) 130.2 ± 19.5 131.1 ± 18.8 129.0 20.4 0.05
DBP (mmHg) 83.1 ± 11.0 83.6 ± 11.1 82.5 ± 11.0 0.61
Cholesterol (mg/dL) 185.0 ± 37.0 183.3 ± 36.2 187.2 ± 38.0 0.55
LDL cholesterol (mg/dL)2 113.8 ± 29.2 113.9 ± 28.9 113.8 ± 29.7 0.77
Triglycerides (mg/dL) 147.3 ± 89.3 153.6 ± 92.5 139.8 ± 84.8 0.01
HDL cholesterol (mg/dL)3 40.3 ± 10.1 37.2 ± 8.4 44.2 ± 9.8 <0.01
FBS (mg/dl) 101 ± 28.8 100.6 ± 28.8 103.28.7 0.51
Prevalence of CVD Risk Factors- n (%)
Obese kg/m2(BMI≥25) 711 (46.0) 312 (36.9) 383 (54.8) <0.01
Central Obesity
(WC≥90 cm in males or≥80 cm in females)
883 (57.1) 407 (48.1) 476 (68.1) <0.01
Elevated SBP (≥120 mmHg) 1054 (68.2) 610 (72.1) 444 (63.4) <0.01
High Cholesterol (≥200 mg/dL) 500 (32.3) 261 (30.9) 239 (34.1) 0.09
High LDL-C (≥100 mg/dL) 1079 (69.8) 588 (69.5) 491 (70.1) 0.82
High TG (≥150 mg/dL) 555 (35.9) 318 (37.6) 237 (33.9) 0.13
Low HDL(<40 mg/dL) 870 (56.3) 602 (71.2) 268 (38.3) <0.01
Elevated FBS (≥100 mg/dL) 539 (34.9) 260 (30.7) 279 (39.9) <0.01
Physical Activity (No) 289 (18.7) 109 (12.9) 180 (25.7) <0.01
Tobacco use (Yes) 794 (51.4) 587 (69.4) 207 (29.6) <0.01
BMIBody mass index,WCWaist circumference,SBPSystolic blood pressure,DBPDiastolic blood pressure,LDLLow density lipoprotein,HDLHigh density lipoprotein,FBSFasting blood sugar,TGTriglycerides
more prevalent in men than women. For abnormal lipid biomarkers as a CVD risk factor, men had lower HDL-C than women whereas elevated FBS was more prevalent among women than men. Lifestyle related CVD risk fac-tors were also found to be significantly different in males and females, with a higher proportion in men who used tobacco and higher proportion of women who were physically active (Table 1).
Characteristics of clusters & CVD risk
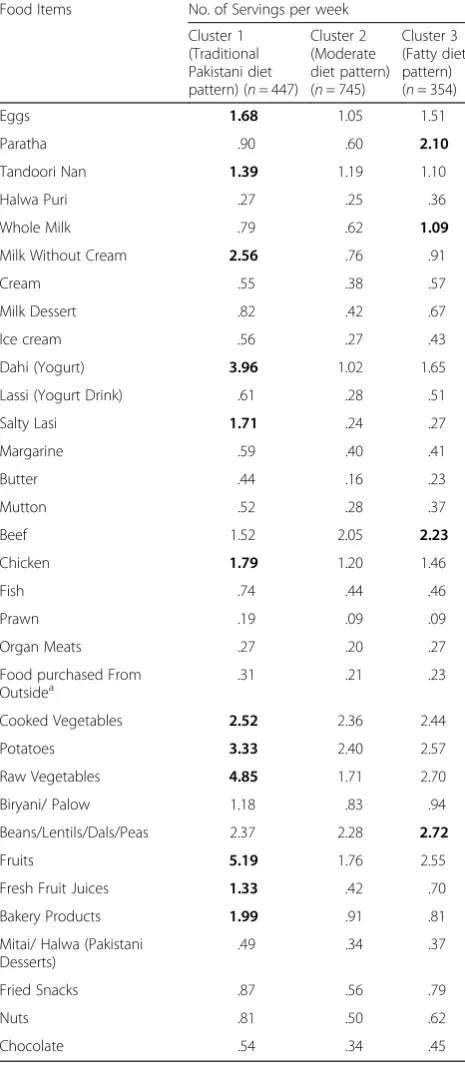
Three discernable clusters or diet patterns were identi-fied, though there was no clear “healthy" or "unhealthy" diet cluster in this population. A total of 447 subjects were in diet cluster 1 consuming mostly fruits, vegeta-bles, milk without cream, yogurt and chicken. This clus-ter was named arbitrarily as the ‘Traditional Pakistani diet pattern’. Cluster 2 diet pattern was followed by the largest group of subjects, consuming moderate amount of most food items and therefore we labeled the cluster as 'moderate diet pattern'. In cluster 3, people were mainly consuming foods high in saturated fats such as paratha, whole milk, beef etc. and therefore we labeled this cluster as 'fatty diet pattern'. The naming of clusters was done arbitrarily and for ease in the discussion. Table 2 shows the frequency of consumption of each food items in each of the three diet clusters. Each diet cluster was further examined for CVD associated risk factors. Significant mean differences were seen for BMI, waist circumference, SBP and HDL-C across the three diet clusters (Table 3), with highest mean BMI, WC, and HDL-C among cluster 1 subjects.
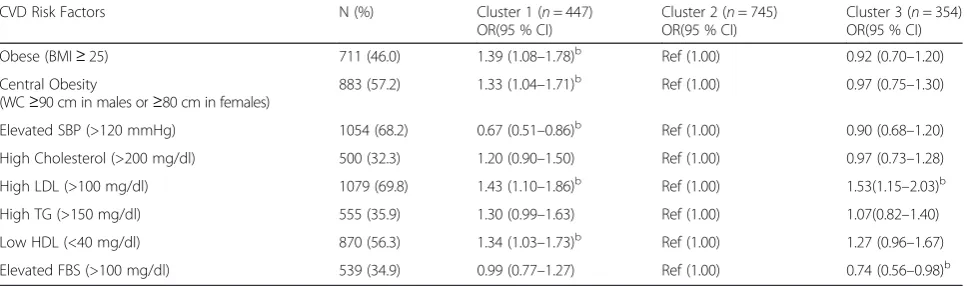
Association of diet clusters with CVD risk factors were assessed by multinomial logistic regression analysis. The probability of being obese, having central obesity, ele-vated SBP were assessed across diet clusters. The refer-ence category for the regression model was the moderate diet pattern (cluster 2). The model was ad-justed for age, gender, tobacco use and physical activity. Table 4 shows that if a subject was following‘Traditional Pakistani’, then he or she was more likely to be obese as measured by BMI (OR 1.39, 95 % CI 1.08 to 1.78;P< 0.01) and waist circumference (OR 1.33, 95 % CI 1.04 to 1.71;
P< 0.01) as compared to other dietary clusters. How-ever, subjects in this diet pattern (cluster1) were less likely to have a high SBP (OR 0.67, 95 % CI 0.51to 0.86;
P< 0.01) as compared to others. Those subjects follow-ing ‘Traditional Pakistani’ diet pattern (OR 1.43, 95 % CI 1.10 to 1.86P< 0.01) and fatty diet pattern (OR 1.53, 95 % CI 1.15 to 2.03P< 0.01) were more likely to have higher LDL-C as compared to reference diet pattern (cluster 2). Subjects were more likely to have a high TG (OR 1.30, 95 % CI 0.99 to 1.63 P 0.054) and low HDL (OR 1.34, 95 % CI 1.03 to 1.73 P< 0.03) in cluster 1 characterized by as compared to others. Subjects
following fatty diet pattern (cluster 3) were 26 % (OR 0.74, 95 % CI 0.56 to 0.98P< 0.03) less likely to have el-evated FBS than those following other dietary patterns.
Table 2Selected food intake by dietary patterns (clusters) identified at baseline among older adults (≥40 yrs) participating in the COBRA study- Pakistan
Food Items No. of Servings per week
Cluster 1 (Traditional Pakistani diet pattern) (n= 447)
Cluster 2 (Moderate diet pattern) (n= 745)
Cluster 3 (Fatty diet pattern) (n= 354)
Eggs 1.68 1.05 1.51
Paratha .90 .60 2.10
Tandoori Nan 1.39 1.19 1.10
Halwa Puri .27 .25 .36
Whole Milk .79 .62 1.09
Milk Without Cream 2.56 .76 .91
Cream .55 .38 .57
Milk Dessert .82 .42 .67
Ice cream .56 .27 .43
Dahi (Yogurt) 3.96 1.02 1.65
Lassi (Yogurt Drink) .61 .28 .51
Salty Lasi 1.71 .24 .27
Margarine .59 .40 .41
Butter .44 .16 .23
Mutton .52 .28 .37
Beef 1.52 2.05 2.23
Chicken 1.79 1.20 1.46
Fish .74 .44 .46
Prawn .19 .09 .09
Organ Meats .27 .20 .27
Food purchased From
Outsidea .31 .21 .23
Cooked Vegetables 2.52 2.36 2.44
Potatoes 3.33 2.40 2.57
Raw Vegetables 4.85 1.71 2.70
Biryani/ Palow 1.18 .83 .94
Beans/Lentils/Dals/Peas 2.37 2.28 2.72
Fruits 5.19 1.76 2.55
Fresh Fruit Juices 1.33 .42 .70
Bakery Products 1.99 .91 .81
Mitai/ Halwa (Pakistani Desserts)
.49 .34 .37
Fried Snacks .87 .56 .79
Nuts .81 .50 .62
Chocolate .54 .34 .45
Bold: indicates the most consumption for the food among 3 clusters
a
No other significant associations were seen for CVD risk factors in our data set.
Discussion
South Asians are at higher risk of cardiovascular disease due to an increasing prevalence of its risk factors amongst them [35]. This cross-sectional study was undertaken to examine the association of diet patterns derived by cluster analysis with the prevalence of CVD risk factors (mainly obesity, lipid biomarkers, SBP and FBS) in Pakistani adults aged 40 years and older. Identi-fication of overall diet trends that incorporates the inter-action of different food items in a specific population is a more appropriate method to examine the relationship
between diet and disease risk than focusing on individual foods or nutrients [7, 36]. Dietary pattern studies tend to identify at least one pattern or cluster that can be de-fined a healthier eating pattern, however, in some popu-lations a typical healthy or unhealthy diet pattern may not exist but dietary behaviors might be characterized by different types of foods categorized as healthy or un-healthy within the similar diet patterns.
In Pakistan, limited research has been done to identify the different type of diets that are normally consumed by Pakistani people. In addition, currently no dietary guidelines, recommendations, or evidence-based dietary indices have been established by health and nutrition au-thorities in Pakistan. Therefore, studies using data driven methods including factor and cluster analysis are essen-tial to identify existing dietary patterns among Pakistani people and inform public health initiatives in Pakistan. In our study, men and women following traditional Paki-stani diet pattern (cluster 1) were characterized by high intake of foods including milk and milk products, pota-toes and other vegetables, fruits, Pakistani bread, and bakery products with highest risk for obesity as com-pared to other diet patterns. Though, this diet pattern has some foods that are relatively healthier but because the usual intake in this group was highest for most foods, thereby increasing the total energy intake that may have been resulted in higher prevalence of over-weight and obese adults in this pattern. Similar results were also observed in previous research studies [34, 37].
The relationship between dietary patterns and CVD risk could be manifold and complex in different popu-lations [12, 38]. A large body of scientific evidence from observational studies [39], clinical trials [40], and gen-etic studies [41] have shown that lipids and glucose bio-markers may have causal relationship with CVD risk, though results have been inconsistent [7, 15]. Dyslipidemia,
Table 3ANOVA for comparison of CVD associated characteristics across dietary clusters among adults in the COBRA study Biological variables
(mean ± SD)
Cluster 1
n= 447
Cluster 2
n= 745
Cluster 3
n= 354
Pvalue*
BMI (kg/m2) 25.9 ± 5.0a,b 24.8 ± 5.6 24.3 ± 4.9 <0.01
WC (cm) 89.0 ± 12.2b 87.5 ± 13.2 86.6 ± 11.1 <0.01
SBP (mmHg) 127.4 ± 19.6a,b 131.4 ± 19.4 131.6 ± 19.2 <0.01
Cholesterol (mg/dL)
187.5 ± 35.4 184.0 ± 39.5 186.0 ± 33.6 0.66
LDL cholesterol (mg/dL)
115.1 ± 28.7 112.3 ± 30.7 115.5 ± 26.7 0.97
Triglycerides (mg/dL)
152.1 ± 90.0 144.4 ± 91.8 147.5 ± 82.8 0.41
HDL cholesterol (mg/dL)
41.0 ± 10.8b 40.5 ± 10.1 39.3 ± 9.2 <0.01
FBS (mg/dl) 102.6 ± 29.8 102.0 ± 27.9 100.0 ± 29.3 0.26 BMIBody mass index,WCWaist circumference,SBPSystolic blood pressure,
LDLLow density lipoprotein,HDLHigh density lipoprotein,FBSFasting blood sugar
a
Significant difference between cluster 1 & 2 using Tukey HSD
b
Significant difference between cluster 1 & 3 using Tukey HSD
Table 4Adjusted odds ratios (OR)aand 95 % confidence intervals (CI) for CVD risk factors by dietary clusters among Pakistani older adults
CVD Risk Factors N (%) Cluster 1 (n= 447)
OR(95 % CI)
Cluster 2 (n= 745) OR(95 % CI)
Cluster 3 (n= 354) OR(95 % CI)
Obese (BMI≥25) 711 (46.0) 1.39 (1.08–1.78)b Ref (1.00) 0.92 (0.70–1.20)
Central Obesity
(WC≥90 cm in males or≥80 cm in females)
883 (57.2) 1.33 (1.04–1.71)b Ref (1.00) 0.97 (0.75–1.30)
Elevated SBP (>120 mmHg) 1054 (68.2) 0.67 (0.51–0.86)b Ref (1.00) 0.90 (0.68
–1.20) High Cholesterol (>200 mg/dl) 500 (32.3) 1.20 (0.90–1.50) Ref (1.00) 0.97 (0.73–1.28)
High LDL (>100 mg/dl) 1079 (69.8) 1.43 (1.10–1.86)b Ref (1.00) 1.53(1.15
–2.03)b
High TG (>150 mg/dl) 555 (35.9) 1.30 (0.99–1.63) Ref (1.00) 1.07(0.82–1.40)
Low HDL (<40 mg/dl) 870 (56.3) 1.34 (1.03–1.73)b Ref (1.00) 1.27 (0.96
–1.67)
Elevated FBS (>100 mg/dl) 539 (34.9) 0.99 (0.77–1.27) Ref (1.00) 0.74 (0.56–0.98)b
BMIBody mass index,WCWaist circumference,SBPSystolic blood pressure,LDL-CLow density lipoprotein,TGTriglycerides,HDLHigh density lipoprotein,
FBSFasting blood sugar
a
Multinomial regression analysis was performed. The model was adjusted for age, gender, physical activity and tobacco use
b
manifested by abnormal lipids with increased TC, LDL-C, and TG accompanied by a decrease in HDL-C, is consid-ered a traditional risk factor for CVD [42]. It was difficult to compare our findings with earlier studies conducted in other populations because we were unable to identify a very distinct healthy or unhealthy diet pattern with which we could noticeably associate biomarkers of CVD risk. However, those following traditional Pakistani and fatty diet patterns (cluster 1 and 3) were relatively at a higher risk for LDL- cholesterol as compared to cluster 2. This could have been due to more food in general and high fatty food intake as reflected by these clusters. Similarly the risk for high TG was also observed in traditional Pakistani diet pattern (cluster 1). Previously Jafar has shown that factors including obesity, caloric-dense diet and sedentary lifestyle are likely to be associated with increased prevalence of CVD risk in Pakistani women [43]. In the current ana-lysis those following pattern 3 were not consuming high levels of fatty foods including eggs, milk desserts, ice cream, and butter but had more CVD risk factors as compared to reference. The FFQ used in the assessment of food intake included a limited list of fatty foods re-flective in a typical Pakistani diet, as the intent of the COBRA study was to determine only those types of foods that may pose a risk to hypertension. In addition, the FFQ was unable to capture the type and amount of fat used in cooking, and previous studies from Pakistan has shown an increased intake of saturated fats in daily cooking that may perhaps have contributed to an in-creased risk for those following pattern 3 [2, 43, 44].
Most data linking dietary patterns with biomarkers of CVD risk comes from observational studies. The Lyon Diet Heart Study, a randomized control trial was unable to show any association between lipid biomarkers of CVD risk (HDL-C, LDL-C, TG, and lipoprotein-a) and intake of diets characterized by fruits, vegetables, olive oil, and hard bread [45]. Thus, these results suggest that risk factors other than serum lipids may mediate risk between dietary patterns and CVD risk. We recommend caution in interpreting the relationship between the dietary patterns and biomarkers as ours was a cross-sectional study.
In our study, the prevalence of subjects with elevated SBP was found to be relatively high (68.2 %), though subjects who self-reported hypertension were excluded. Distributions of these participants were highest (71.8 %), across moderate diet pattern, despite the fact that the frequency of intake of many food items was much less than in other two clusters. Also notable was the fact that certain Pakistani foods that are supposedly proposed to increase blood pressure for example paratha, tandori nan, salty lassi, biryani etc. were eaten much less frequently in this group as compared to other cluster groups. In contrast, subjects in cluster 1 showed a
protective effect on SBP risk that cannot be explained by more frequent consumption of above food items. This un-usual observation could be explained by the fact that in-take of fruits and vegetables along with some unhealthy food were seen in this group (Traditional Pakistani diet, cluster 1). Nevertheless, similar results have also been ob-served by Sadakane et al.[46], who has reported that the Western diet pattern was not associated with higher sys-tolic and diassys-tolic blood pressures in the Japanese popula-tion. We recommend further exploration of these findings in order to improve our understanding about the associ-ation between western type of diet in a Pakistani popula-tion and blood pressure.
This study is notable because of its large sample size and a high response rate (88.38 %). The extensive infor-mation gathered from the study subjects makes our study findings more informative and may have substan-tial implications for other similar populations in South Asia.
long term intake, especially if there is lot of variation in an individual’s diet. In addition, there are collection and measurement issues that may have affected the results in the current study [12].
Cluster analysis is a useful exploratory data driven technique for deriving dietary patterns in populations where fundamental dietary patterns do not exist. While identifying data driven or posteriori dietary patterns, many arbitrary but important decisions are made by the researcher, such as consolidation of food items into food groups, the number of patterns to derive from the data, labeling of patterns etc. This can make it difficult to compare and interpret the findings with other studies. However the exposure groups derived from cluster ana-lysis are homogenous and non-overlapping, which is helpful in studies explaining relationship between diet patterns and risk for diseases [10]. As dietary guidelines for Pakistan get established, future studies of guideline-based indices and CVD risk will be possible and well warranted.
Conclusion
The present study shows that some of the CVD risk fac-tors including obesity and hypertension are highly preva-lent among low income urban Pakistani adults. The study further provides some evidence that CVD risk fac-tors could be linked with certain type of diet patterns but not consistently for all CVD risk factors as well as in all population groups. However, these results are import-ant for Pakistan as people here are already susceptible to a high prevalence of obesity, hypertension and dyslipid-emia [47]. Effective Public health strategies and multiple lifestyle change initiatives are required against obesity and hypertension among Pakistani adults to avert rise in CVDs.
Acknowledgments
The authors thank members of the Hypertension Research Group (HRG) who were responsible for the COBRA study (clinical trial NCT00327574). We also sincerely thank Adnan Ali for his contribution in the statistical analysis of this research paper.
Funding
This study received no financial support and was part of the doctoral dissertation of Nilofer F. Safdar at the Department of Nutrition, School of Public Health and Health Sciences, University of Massachusetts, Amherst USA.
Availability of data and materials
Most of the data supporting our findings is contained within the manuscript. However, detailed SPSS data spread sheets are available with the authors.
Authors’contributions
NFS conceptualized the research idea, study design, analysis, interpretation of the data, and drafting of the manuscript. EBJ provided guidance for study design, analysis, interpretation of the data and review of the manuscript. LC provided input on early drafts. TJ designed and conducted the COBRA study, provided guidance in conceptualizing the idea for the manuscript. N.C was closely involved in the design, analyses, and review of the manuscript. All authors have read and approved the final version of the manuscript.
Competing interests
The authors declare that they have no competing interest.
Consent for publication
Not applicable.
Ethics approval and consent to participate
The COBRA study was conducted in accordance with the principles of the Declaration of Helsinki and was approved by the Aga Khan University Ethical Review Committee. Written consents were obtained from the COBRA participants after explaining the objectives of the study. A separate approval was further obtained from the Human Subjects Committee and Internal Review Board (IRB) of the University of Massachusetts, Amherst, USA to use deidentified COBRA data for the secondary analysis for academic research and writing of manuscripts.
Author details
1
School of Public Health, Dow University of Health Sciences, KDA Scheme 33, Gulzar-e-Hijri, OJHA Campus, Suparco Road, Karachi 75270, Pakistan. 2Department of Biostatistics and Epidemiology, University of Massachusetts, Amherst, MA 01003-9304, USA.3Department of Nutrition, University of Massachusetts, Amherst, MA 01003-9282, USA.4Department of Community Health Sciences, Aga Khan University, Karachi, Pakistan.
Received: 3 December 2015 Accepted: 18 August 2016
References
1. Lopez AD, Mathers CD, Ezzati M, Jamison DT, Murray CJL. Global and regional burden of disease and risk factors, 2001: systematic analysis of population health data. Lancet. 2006;367(9524):1747–57.
2. Jafar TH, Jafary FH, Jessani S, Chaturvedi N. Heart disease epidemic in Pakistan: women and men at equal risk. Am Heart J. 2005;150(2):221–6. 3. Yusuf S, Ounpuu S. Tackling the growing epidemic of cardiovascular disease
in South Asia. J Am Coll Cardiol. 2001;38(3):688–9.
4. Yusuf S, Reddy S, Ounpuu S, Anand S. Global burden of cardiovascular diseases: part I: general considerations, the epidemiologic transition, risk factors, and impact of urbanization. Circulation.
2001;104(22):2746–53.
5. Gupta M, Brister S. Is South Asian ethnicity an independent cardiovascular risk factor? Can J Cardiol. 2006;22(3):193–7.
6. Atkins JL, Whincup PH, Morris RW, Lennon LT, Papacosta O, Wannamethee SG. High diet quality is associated with a lower risk of cardiovascular disease and all-cause mortality in older men. J Nutr. 2014;144(5):673–80.
7. Fung TT, Rimm EB, Spiegelman D, Rifai N, Tofler GH, Willett WC, Hu FB. Association between dietary patterns and plasma biomarkers of obesity and cardiovascular disease risk. Am J Clin Nutr. 2001;73(11124751):61–7. 8. Jacques PF, Tucker KL. Are dietary patterns useful for understanding the role
of diet in chronic disease? Am J Clin Nutr. 2001;73(1):1–2.
9. Kant AK. Dietary patterns and health outcomes. J Am Diet Assoc. 2004;104(4):615–35.
10. Bailey RL, Gutschall MD, Mitchell DC, Miller CK, Lawrence FR, Smiciklas-Wright H. Comparative strategies for using cluster analysis to assess dietary patterns. J Am Diet Assoc. 2006;106(8):1194–200.
11. Kant AK. Dietary patterns: biomarkers and chronic disease risk. Appl Physiol Nutr Metab. 2010;35(2):199–206.
12. Bingham SA. Biomarkers in nutritional epidemiology. Public Health Nutr. 2002;5(6A):821–7.
13. Fung TT, Willett WC, Stampfer MJ, Manson JE, Hu FB. Dietary patterns and the risk of coronary heart disease in women. Arch Intern Med. 2001;161(15):1857–62.
14. Hu FB, Rimm EB, Stampfer MJ, Ascherio A, Spiegelman D, Willett WC. Prospective study of major dietary patterns and risk of coronary heart disease in men. Am J Clin Nutr. 2000;72(4):912–21.
15. van Dam RM, Grievink L, Ocké MC, Feskens EJM. Patterns of food consumption and risk factors for cardiovascular disease in the general Dutch population. Am J Clin Nutr. 2003;77(5):1156–63.
17. Ganguli D, Das N, Saha I, Biswas P, Datta S, Mukhopadhyay B, Chaudhuri D, Ghosh S, Dey S. Major dietary patterns and their associations with cardiovascular risk factors among women in West Bengal, India. Br J Nutr. 2011;105(10):1520–9.
18. Talegawkar SA, Johnson EJ, Carithers TC, Taylor HA, Bogle ML, Tucker KL. Carotenoid intakes, assessed by food-frequency questionnaires (FFQs), are associated with serum carotenoid concentrations in the Jackson Heart Study: validation of the Jackson Heart Study Delta NIRI Adult FFQs. Public Health Nutr. 2008;11(10):989–97.
19. Jafar TH, Levey AS, White FM, Gul A, Jessani S, Khan AQ, Jafary FH, Schmid CH, Chaturvedi N. Ethnic differences and determinants of diabetes and central obesity among South Asians of Pakistan. Diabet Med. 2004;21(7):716–23.
20. Yakub M, Iqbal MP, Iqbal R. Dietary patterns are associated with hyperhomocysteinemia in an urban Pakistani population. J Nutr. 2010;140(7):1261–6.
21. Iqbal R, Anand S, Ounpuu S, Islam S, Zhang X, Rangarajan S, Chifamba J, Al-Hinai A, Keltai M, Yusuf S. Dietary patterns and the risk of acute myocardial infarction in 52 countries: results of the INTERHEART study. Circulation. 2008;118(19):1929–37.
22. Safdar NF, Bertone-Johnson E, Cordeiro L, Jafar TH, Cohen NL. Dietary patterns of Pakistani adults and their associations with sociodemographic, anthropometric and life-style factors. J Nutr Sci. 2013;2:e42.
23. Safdar NF, Bertone-Johnson E, Cordeiro L, Jafar T, Cohen N. Dietary patterns associated with hypertension among the low income urban population in Pakistan. FASEB J. 2013;27(1_MeetingAbstracts):622. 611.
24. Jafar TH, Hatcher J, Poulter N, Islam M, Hashmi S, Qadri Z, Bux R, Khan A, Jafary FH, Hameed A, et al. Community-based interventions to promote blood pressure control in a developing country: a cluster randomized trial. Ann Intern Med. 2009;151(9):593–601.
25. Jafar TH, Islam M, Hatcher J, Hashmi S, Bux R, Khan A, Poulter N, Badruddin S, Chaturvedi N. Community based lifestyle intervention for blood pressure reduction in children and young adults in developing country: cluster randomised controlled trial. BMJ. 2010;340:c2641.
26. Willett WC, Sampson L, Stampfer MJ, Rosner B, Bain C, Witschi J, Hennekens CH, Speizer FE. Reproducibility and validity of a semiquantitative food frequency questionnaire. Am J Epidemiol. 1985;122(1):51–65.
27. Jafar TH, Islam M, Jessani S, Bux R, Inker LA, Mariat C, Levey AS. Level and determinants of kidney function in a South Asian population in Pakistan. Am J Kidney Dis. 2011;58(5):764–72.
28. Hagstromer M, Oja P, Sjostrom M. The International Physical Activity Questionnaire (IPAQ): a study of concurrent and construct validity. Public Health Nutr. 2006;9(6):755–62.
29. Ainsworth BE, Haskell WL, Herrmann SD, Meckes N, Bassett Jr DR, Tudor-Locke C, Greer JL, Vezina J, Whitt-Glover MC, Leon AS. 2011 Compendium of Physical Activities: a second update of codes and MET values. Med Sci Sports Exerc. 2011;43(8):1575–81.
30. Razak F, Anand SS, Shannon H, Vuksan V, Davis B, Jacobs R, Teo KK, McQueen M, Yusuf S. Defining obesity cut points in a multiethnic population. Circulation. 2007;115(16):2111–8.
31. Chobanian AV, Bakris GL, Black HR, Cushman WC, Green LA, Izzo Jr JL, Jones DW, Materson BJ, Oparil S, Wright Jr JT. Seventh report of the Joint National Committee on prevention, detection, evaluation, and treatment of high blood pressure. Hypertension. 2003;42(6):1206–52.
32. Eckel RH, Cornier MA. Update on the NCEP ATP-III emerging cardiometabolic risk factors. BMC Med. 2014;12(1):115.
33. International Diabetes Federation. Diabetes Atlas update poster [http://www.diabetesatlas.org/].
34. Newby PK, Muller D, Hallfrisch J, Qiao N, Andres R, Tucker KL. Dietary patterns and changes in body mass index and waist circumference in adults. Am J Clin Nutr. 2003;77(6):1417–25.
35. Ghaffar A, Reddy KS, Singhi M. Burden of non-communicable diseases in South Asia. BMJ. 2004;328(7443):807–10.
36. Cespedes EM, Hu FB. Dietary patterns: from nutritional epidemiologic analysis to national guidelines. Am J Clin Nutr. 2015;101(5):899–900. 37. Maskarinec G, Novotny R, Tasaki K. Dietary patterns are associated with
body mass index in multiethnic women. J Nutr. 2000;130(12):3068–72. 38. Nettleton JA, Steffen LM, Mayer-Davis EJ, Jenny NS, Jiang R, Herrington DM,
Jacobs Jr DR. Dietary patterns are associated with biochemical markers of inflammation and endothelial activation in the Multi-Ethnic Study of Atherosclerosis (MESA). Am J Clin Nutr. 2006;83(6):1369–79.
39. Lewington S, Whitlock G, Clarke R, Sherliker P, Emberson J, Halsey J, Qizilbash N, Peto R, Collins R. Blood cholesterol and vascular mortality by age, sex, and blood pressure: a meta-analysis of individual data from 61 prospective studies with 55,000 vascular deaths. Lancet.
2007;370(9602):1829–39.
40. Baigent C, Keech A, Kearney PM, Blackwell L, Buck G, Pollicino C, Kirby A, Sourjina T, Peto R, Collins R, et al. Efficacy and safety of cholesterol-lowering treatment: prospective meta-analysis of data from 90,056 participants in 14 randomised trials of statins. Lancet. 2005;366(9493):1267–78.
41. Wittrup HH, Andersen RV, Tybjaerg-Hansen A, Jensen GB, Nordestgaard BG. Combined analysis of six lipoprotein lipase genetic variants on triglycerides, high-density lipoprotein, and ischemic heart disease: cross-sectional, prospective, and case–control studies from the Copenhagen City Heart Study. J Clin Endocrinol Metab. 2006;91(4):1438–45.
42. Mendis S. The contribution of the Framingham Heart Study to the prevention of cardiovascular disease: a global perspective. Prog Cardiovasc Dis. 2010;53(1):10–4.
43. Jafar TH. Women in Pakistan have a greater burden of clinical cardiovascular risk factors than men. Int J Cardiol. 2006;106(3):348–54.
44. Jafar TH, Levey AS, Jafary FH, White F, Gul A, Rahbar MH, Khan AQ, Hattersley A, Schmid CH, Chaturvedi N. Ethnic subgroup differences in hypertension in Pakistan. J Hypertens. 2003;21(5):905–12.
45. de Lorgeril M, Salen P, Martin JL, Monjaud I, Delaye J, Mamelle N. Mediterranean diet, traditional risk factors, and the rate of cardiovascular complications after myocardial infarction: final report of the Lyon Diet Heart Study. Circulation. 1999;99(6):779–85.
46. Sadakane A, Tsutsumi A, Gotoh T, Ishikawa S, Ojima T, Kario K, Nakamura Y, Kayaba K. Dietary patterns and levels of blood pressure and serum lipids in a Japanese population. J Epidemiol. 2008;18(2):58–67.
47. Jafar TH, Chaturvedi N, Pappas G. Prevalence of overweight and obesity and their association with hypertension and diabetes mellitus in an Indo-Asian population. CMAJ. 2006;175(17060656):1071–7.
• We accept pre-submission inquiries
• Our selector tool helps you to find the most relevant journal
• We provide round the clock customer support
• Convenient online submission
• Thorough peer review
• Inclusion in PubMed and all major indexing services
• Maximum visibility for your research
Submit your manuscript at www.biomedcentral.com/submit