1371
Volume LXI 152 Number 5, 2013
http://dx.doi.org/10.11118/actaun201361051371
EFFECT OF TIME FROM HARVEST
TO AGGLOMERATION PROCESS OF
HERBACEOUS MASS ON THE DENSITY
AND HARDNESS OF BRIQUETTES
Marek Rynkiewicz, Petr Trávníček, Petr Junga
Received: May 28, 2013
Abstract
RYNKIEWICZ MAREK, TRÁVNÍČEK PETR, JUNGA PETR: Eff ect of time from harvest to agglomeration process of herbaceous mass on the density and hardness of briquettes. Acta Universitatis Agriculturae et Silviculturae Mendelianae Brunensis, 2013, LXI, No. 5, pp. 1371–1376
The study presents the results about the density and hardness of the briquettes produced from barley straw, wheat and rapeseed straw and hay. 6-month and 18-month raw materials a er harvest from the fi elds were used to the agglomeration, stored in stacks in the fi eld. The study showed that the briquettes produced from 6-month material characterized by a greater density in the comparison with the 18-month material. The diff erence was 130.28 kg·m−3 for the hay briquette, whereas the diff erence
was 58.14 kg·m−3 in the case of rape straw briquettes. Similar results were found for the hardness.
All samples of briquette used for testing had longitudinal cracks, however transversal cracks were observed only on the briquettes produced from barley straw and hay.
biomass briquette, barley straw, hay, density
Briquetting is a process of pressure agglomeration of materials which under the knitting of external and internal forces are compressed, and the fi nal product has specifi c, continuous geometric form (Grochowicz, 1998; Hej , 2002). Briquettes produced from biomass are o en used as a source of renewable energy. This is mainly from reason because these products have high density, which facilitates the storage and distribution, and is possible to obtain a larger amount of energy per unit volume.
Kaliyan and Morey (2009) stated that the agglomeration of biomass increases its density from 40–200 kg.m−3, where it is in the baled form, to 600–
800 kg.m−3 when it is agglomerated. Wójcicki (2010)
states that the calorifi c value of straw is 17 MJ.kg−1
and this value is relatively high. From the reason straw is o en used for production of briquettes from biomass. For comparison, the calorifi c value of coal is 28 MJ.kg−1.
Herbaceous mass, which is obtained for energy purposes, is a heterogeneous material. This
material is contented from various crops, which have diff erent humidity, size, form, density. It is recommended that the stored herbaceous mass suitable for briquetting was protected from rain.
Various species composition of briquetted herbaceous mass and its storage time from harvest until the agglomeration eff ect have on the physical properties of the fi nal product in the form of briquettes. This allows performing a wide range of research on the physical properties of briquettes.
The aim of this study was to determine the eff ect of time from harvest to the agglomeration process of herbaceous mass on the density and hardness of briquettes.
MATERIALS AND METHODS
is a material that has been processed into briquettes at the turn of 2010/2011 was a 6 month, and from year prior to the production process – marked as 18 months.
In this study briquettes, for the survey was determined as follows:
A6 – barley straw briquettes 6–month, A18 – barley straw briquettes 18–month, B6 – wheat straw briquettes 6–month, B18 – wheat straw briquettes 18–month, C6 – rape straw briquettes 6–month, C18 – rape straw briquettes 18–month, D6 – briquettes from straw 6–month, D18 – from straw briquettes 18–months.
Altogether 8 samples with diff erent time of storing and diff erent species diversity was tested to their density, hardness, and determining the kind of the cracks.
Moisture content of samples was performed in accordance with EN 14774-3:2009 and was calculated using the following formula:
2 3
2 1
( )
100
( )
ad
m m
M
m m
, (1)
Mad ...humidity [%],
m1 ....the mass of the empty dish (plus lid) [kg];
m2 ....the mass of the dish (plus lid) with sample
before drying [kg];
m3 ....the mass of the dish (plus lid) with samples
a er drying [kg].
Briquette density was determined according to standard EN 15150:2011. For this purpose measurements of the length, diameter and weight for 3 samples of each type of briquette were made. Diameter measurement was performed 6 times, in accordance with Figure 1. Density was determined using the following formula:
p
m V
, (2)
...briquettes density [g·cm −3],
m ...mass of the sample [g], Vp ...volume of the briquette [cm
3], where:
2
4 em P
D L
V , (3)
L ...length [cm],
Dem...average value for 6 measurements of the diameter [cm].
ZGW-1 unit of DHN (Fig. 2) was used to measure the hardness. Examination consisted of exerting the force with head of hardness tester on a given briquettes sample. In the research was used mandrel with a rectangular base of 18 mm × 6 mm. The load, at which the pellet was disintegrating, was a measure of its hardness in kg. The measurement was performed in triplicate for each batch of tested briquettes.
Type of cracks was determined by appearance. Cracks parallel to the axis of briquettes were determined as longitudinal cracks, and perpendicular to the axis was defi ned as transverse.
Briquette production line (from which research material was obtained) consisted of the following components: chipper, mill, tank dispenser and briquetting mixer of eccentrically-piston. Humidity of agglomerated materials ranged from 12 to 20 %. Mill sieve mesh was 8 mm. However, the briquetting press output diameter was 60 mm.
Statistical calculations
Statistical analysis was performed using Statistica and MS Excel. For tested parameters their compatibility with normal distribution was verifi ed. Degradation studies were carried out using the Shapiro–Wilk test. The critical level for signifi cance was p = 0.05. To check the homogeneity of variance Levene’s test was used.
The signifi cance of diff erences in average values of more than two populations with normal distributions and homogeneous variances verifi ed using t-Student test. To verify the diff erences between the average values Tukey’s test was used. Pearson’s correlation coeffi cient was calculated for the parameters when at least one of them had diff erent from the normal distribution (Stanisz, 1998).
1: Briquette diameter measurement
points (EN 15150:2011)
RESULTS AND DISCUSSION
Humidity of tested samples of briquettes was from 4 to 6 %. Figs. 3–6 show the densities of tested briquettes depending on the species and time of storage of raw materials for briquetting (from harvest until they agglomerate).
Based on Figure 3, it can be concluded that the density of the briquettes from 6 months barley straw (A6) was greater than 104.63 kg·m−3, compared to the
18-month barley straw briquette (797.05 kg·m−3).
In the case of wheat straw briquette hardness diff erence between the 6 and 18 month straw was 70.88 kg·m−3. A similar phenomenon occurred in
the case of rape straw (Fig. 5), while in the case of hay briquette diff erence between D18 and D6 sample obtained the highest value among the samples (130.28 kg·m−3).
The statistical analysis showed statistically signifi cant diff erences in the average densities of agglomerated materials depending on the time from harvest to their agglomeration
Density of agglomerated briquettes from 18 months raw materials (Fig. 7) obtained the highest value in the case of hay (D18) (917.03 kg·m−3). On
the other hand rape straw briquettes have the lowest density from all measured samples (C18) (668.71 kg·m−3). The statistical analysis of variance ANOVA
revealed statistically signifi cant diff erences in the average density in group of briquettes from 18 months raw materials at p < 0.05. However, Tukey’s test confi rmed statistically signifi cant diff erences between tested groups.
Hay briquettes from 6 month raw material have the highest density too. However, statistical analysis carried out with post-hoc Tukey’s test, not only showed a statistically signifi cant diff erence between
797,05
901,68
A18 A6
780 800 820 840 860 880 900 920
D
en
s
ity [k
g/
m
3]
3: Density of briquettes from 18 and 6 months barley straw
828,11
898,99
B18 B6
810 820 830 840 850 860 870 880 890 900 910
D
ens
ity
[
kg
/m
3]
4: Density of briquettes from 18 and 6-month wheat straw
668,71
726,86
C18 C6
660 670 680 690 700 710 720 730 740
D
ens
ity
[
kg
/m
3]
5: Density of briquettes from 18 and 6-month rape straw
917,03
1047,31
D18 D6
900 920 940 960 980 1000 1020 1040 1060 1080
D
ens
ity
[
kg
/m
3]
6: Density of briquettes from 18 and 6-month hay straw
797,05 828,11
668,71 917,03
A18 B18 C18 D18
650 700 750 800 850 900 950 1000 1050 1100
D
ens
ity
[k
g/m3]
7: Density of agglomerated briquettes from 18 months raw materials.
901,68 898,99
726,86 1047,31
A6 B6 C6 D6
650 700 750 800 850 900 950 1000 1050 1100
D
ens
ity
[k
g/m
3]
8: Density of agglomerated briquettes from 6 months raw materials
18,41
30,38
A18 A6
14 16 18 20 22 24 26 28 30 32 34
H
ar
d
ne
s
s [
kg]
9: Hardness of briquettes from 18 and 6 months barley straw
23,53
40,82
B18 B6
20 22 24 26 28 30 32 34 36 38 40 42 44
Ha
rd
n
ess
[k
g
]
10: Hardness of briquettes from 18 and 6 months wheat straw
16,59
33,50
C18 C6
14 16 18 20 22 24 26 28 30 32 34 36
Ha
rd
n
ess
[k
g
]
11: Hardness of briquettes from 18 and 6 months rape straw
25,84
70,04
D18 D6
20 30 40 50 60 70 80
H
ar
dne
s
s [
kg]
12: Hardness of briquettes from 18 and 6 months hay
the average values of the density of briquettes from barley (A6) and wheat (B6), which can be seen in Figure 8.
Figures 9-f 12 show hardness of tested briquettes depending on the species and time of storage of raw materials for briquetting, from harvest until they agglomerate. In the case of the 18-month barley straw briquette (A18) hardness was 18.41 kg and it was about 11.83 kg less than briquette from 6 month straw (A6).
The study showed a similar relationship for briquettes from other raw materials. The statistical analysis with Student’s t-test revealed statistically signifi cant diff erences between the average values of hardness of the briquettes from 6 to 18 monthly raw materials at p < 0.05.
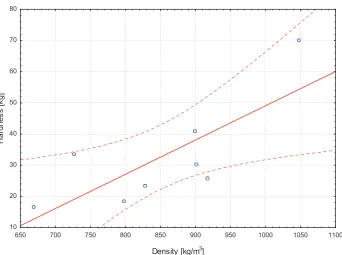
Functional dependence of the density and hardness is given by equation:
y = 0.110x − 60.789, where r2= 0.5844; r = 0.7644; p = 0.0272.
To the tested hardness depending on the density, the Pearson correlation coeffi cient obtained
value when r = 0.76 at level of signifi cance p < 0.05 indicating a very high correlation. A positive value of the slope of the regression line (0.110) indicates a positive linear correlation (Fig. 13).
From Tab. I is evident that only the 6–month hay briquettes (D6) have not transverse and longitudinal cracks. However, the longitudinal and transversal cracks were observed for the 6 and 18–month barley and 18–month hay.
650 700 750 800 850 900 950 1000 1050 1100
Density [kg/m3] 10
20 30 40 50 60 70 80
H
ar
dn
ess [
kg
]
13: Linear regressions function of hardness depending on the density of the tested briquettes
I: Types of cracks observed in the studied briquettes
Component Type of cracks
Transversal Longitudinal
barley 18 (A18) + + barley 6 (A6) + + wheat 18 (B18) - + wheat 6 (B6) - + rape 18 (C18) - +
rape 6 (C6) - +
hay 18 (D18) + +
hay 6 (D6) -
-SUMMARY
1. Samples of briquettes obtained from 6-months raw materials have a higher density compared to 18 months materials in the case of the same species.
2. The lowest density among the examined briquettes from 6 and 18 months materials had rape agglomerate, it means 668.71 and 726.86 kg·m−3.
4. For tested briquettes was found relatively high correlation (r = 0.76) between the hardness and density.
5. Manufacturers to produce briquettes should obtain raw materials from current fi eld production, eventually mixing of raw materials from the current year with previous years.
Address
Dr inž. Marek Rynkiewicz, Department Construction and Use of Technical Equipment, West Pomeranian University of Technology in Szczecin, ul. Papieża Pawła VI/3, 71-459 Szczecin, Poland, Ing. Petr Trávníček, Ph.D., Department of Agriculture, Food and Environmental Engineering, Mendel University in Brno, Zemědělská 1, 613 00 Brno, Czech Republic, Ing. Petr Junga, Ph.D., Department of Agriculture, Food and Environmental Engineering, Mendel University in Brno, Zemědělská 1, 613 00 Brno, Czech Republic, e-mail: [email protected]., [email protected], [email protected]
REFERENCES
EN 14774-3,2009: Solid biofuels. Determination of moisture content. Oven dry method – Part 3: Moisture in general analysis sample.
EN 14961-3, 2011: Solid biofuels – Fuel specifi cations and classes – Part 3: Wood briquettes for non-industrial use. EN 15150,2011: Solid biofuels – Determination of
particle density.
GROCHOWICZ, J., 1998: Zaawansowane techniki wytwarzania przemysłowych mieszanek paszowych. Lublin: Pagros s. c., 203. ISBN 83-910152-0-3.
HEJFT, R., 2002: Ciśnieniowa aglomeracja materiałów roślinnych. Radom: WiZPITE, 257. ISBN 83-720425-1-9.
KALIYAN, N., MOREY, R. V., 2009: Factors aff ecting strength and durability of densifi ed, Biomass and Bioenergy, 33, 3: 337–359. ISSN 0961-9534.
STANISZ, A., 1998: Przystępny kurs statystyki w oparciu o program Statistica PL. Kraków: Statso Polska, 362. ISBN 83-904735-4-2.
WÓJCICKI, Z., 2010: Potrzeby energetyczne i wykorzystanie odnawialnych zasobów energii.