816
Numerical Solution For Spread Of Tuberculosis
Model With Perturbation Homotopy Method
(MPH)
Syafruddin Side, Muh Isbar Pratama, Nur Rezky Ramadhan, and Wahidah Sanusi
Abstract: This paper discuss about the numerical solution of TBC transmission using Perturbation Homotopy Methods (MPH). This article using TBC sufferers’ data on South Sulawesi was taken from Public Health Office South Sulawesi Province. The discuss started form SEIR model of TBC transmission, the simulation of SEIR models of TBC transmission on South Sulawesi, and the numeric solution of SEIR model with Perturbation Homotopy Methods (MPH). On this article we got predictions about TBC transmission that occurred in South Sulawesi for several years later.
Index Terms: SEIR Model, Numeric Solution, Perturbation Homotopy Methods (MPH).
—————————— ——————————
1.
INTRODUCTION
The World Health Organization (WHO) states that one third of the world's population has been infected, 9 million new TB patients and 3 million deaths from tuberculosis worldwide, 95% of TB cases and 98% of deaths from TB in the world occur in developing countries [1; 2]. The spread of a disease is a threat to humans, especially infectious diseases carried by various types of microbes, such as bacteria, fungi, parasites, and viruses. Bacillus tuberculosis (TB) or better known as tuberculosis is an infectious disease caused by the bacterium Mycrobacterium tuberculosis [3]. Eliminating tuberculosis is not easy because it is difficult to develop effective vaccines, expensive and time-consuming diagnostic processes, and treatments that take months, but the spread of this disease can be controlled by providing appropriate treatment for patients with TB [4; 5]. Research carried out by [6] proposed and analyzed the distribution model for tuberculosis. Control and prevention of tuberculosis using chemotherapy drugs for TB patients. The efficacy of each drug is examined and observations show that low drug efficacy can prolong the treatment period. [4] discussed the case of detection and its effectiveness by dividing individuals into five sub-classes namely Susceptible, Exposed, Infected undetected, Infected detected, and Recovered. Research conducted by [7] has also described and analyzed the forms of mathematical modeling in tuberculosis. In his journal entitled "Mathematical Modeling in Transmission of Tuberculosis" discusses transmission of tuberculosis (TBC) using the SIR and SEIR mathematical models and the analysis used is the Lyaponuv function method which describes the existence of tuberculosis in a region, but researchers have not discussed numerical solution of existing models. Research by [8; 9; 10] has also discussed in his journal about Numerical Solutions in the transmission of dengue fever in the SIR and SEIR models. In this paper, article a numerical solution will be examined in the model of TB transmission with Homotopy Perturbation Method (MPH) from the SEIR model that was previously reviewed by [8], and by using secondary data on the number of TB patients in South Sulawesi from the 2016 Health Office. The purpose and benefits expected from this paper are by knowing the model of TB virus transmission and transmission and the numerical solution of the mathematical model of TB transmission with the homotopy perturbation method, it can be used as a basis for further treatment of TB disease, so that TB disease is no longer a scourge frightening to society.
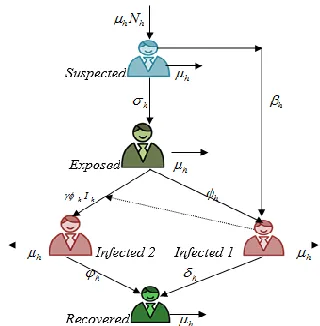
The population is increasing and sustainable at this time so it is a warning to all countries in the world. This causes global warming to occur with climate change. Countries in Southeast Asia, especially Indonesia also feel the effects of global warming. The rainy season almost occurs throughout the year, as a result of diseases that usually appear after the rainy season can no longer be predicted like tuberculosis. TB disease in South Sulawesi poses a serious threat to more than 8 million people in 2016, coupled with a lack of public awareness about the importance of health, so it needs attention from the government, especially the health ministry. The TB transmission model requires an additional variable to complement the SIR model, which is a human population variable that shows symptoms of infection. Changes that apply to each human population can be defined in the following picture:
Fig. 1. Diagram of the human population of the SEIR model
817 cause transmission of the virus. Every human being is
categorized in one part at a time. Every human in the Sh group has the possibility to show symptoms of being infected with the TB virus at hSh level, immediately infected with hIh and dying hSh. While the rate of humans infected by the transmission of the TB virus hEh, infected humans are caused by humans who have been infected with hIhEh. Furthermore, if humans have been infected by the TB virus, they will be given care. This study presupposes that every human being treated will become immune throughout his life so that he is no longer contracting TB. This is because there is no specific vaccine that can fight the TB virus. The level of humans recovering from transmission of the virus due to treatment or the duration of the outbreak in the individual's body is hIh and the level of humans recovering from the transmission of the virus from infected humans in the individual's body is hIh.
2
METHOD
The type of research used is applied research, which aims to solve existing problems by first drafting concepts as needed. In this study, data on TB patients who were used were secondary data obtained from the South Sulawesi Provincial Health Office. This research is a literature study, namely the process of collecting data as a reference material both from the Mathematics Department Library and from other sources related to mathematical modeling and other prerequisite materials. The research procedures applied in writing are described according to the amount in the formulation of the problem, are:
Knowing the homotopy perturbation method in the SEIR TB transmission model in South Sulawesi with the following steps:
a. Write down the SEIR model of TB disease transmission in South Sulawesi that has been obtained previously from decomposition [7].
b. model The written SEIR model is formed into a system of equations that follows the following operators:
( ) ( ) ( )
and reshaped into a system of differential equations
𝐷 ( ) ( ) 𝑁( ) ( ) with
is a linear operator and N1, N2, … , Nm is a nonlinear operator.
c. Complete the system of equations using inverse operators
( ) ∫( )
d. Obtain a form of completion of the homotope perturbation method.
Knowing the numerical solution of the mathematical model of TB transmission with the homotopy perturbation method with the following steps:
a. Retrieving actual data from the South Sulawesi Ministry of Health.
b. Inputting the data into equations obtained as a form of completion of the SEIR model using MPH with the help of Maple or MAPLE 17 software. From these results obtained numerical results and plotting results so that it can be seen the graph of TB disease transmission in South Sulawesi.
3.
RESULTS
AND
DISCUSSION
3.1. SEIR Model for Transmission of Tuberculosis
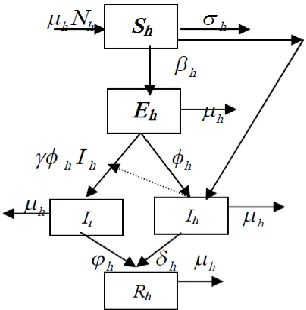
The SEIR model of Tuberculosis transmission (TBC) which shows changes that occur in each human population in transmission of Tuberculosis can be interpreted in the following schematic form [6,9]:
Fig. 2. SEIR model TB transmission population scheme
Based on Figure 2, obtained a SEIR mathematical model for TB transmission [6]
𝑁 ( ) (1)
(2)
( ) (3)
( ) (4)
(5)
The result of SEIR model can be simplified by assuming the following fractions:
( ) , ( ) , ( ) , dan ( ) (6) Then, the human population model for transmission of Tuberculosis can be simplified like the following equation:
(7)
(8)
( ) (9)
( ) (10)
(11)
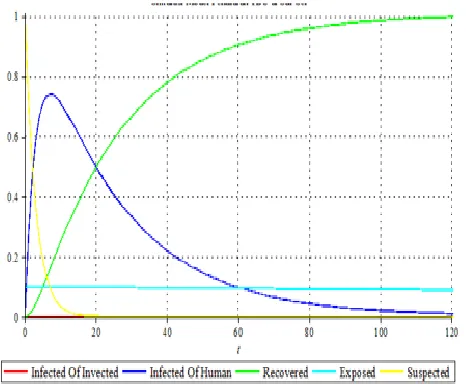
818 Fig. 3. Simulation model of TB transmission in South Sulawesi
Figure 3 resulting from MAPLE for the SEIR model compared to the results of real data from the Ministry of Health of the Republic of Indonesia (KKRI) can be described as follows referring to Real data in South Sulawesi, the number of TB cases (humans infected with viruses) in South Sulawesi will continue to increase every year since 2010. Figure 3 of the results of the SEIR model shows that the number of TB cases is caused by Viruses will continue to grow rapidly, while the number of TB cases caused by infected humans is not too influential and almost constant and will decrease to zero in the next few years. These results indicate that the SEIR model for the spread of tuberculosis in the province of South Sulawesi in particular is in accordance with existing real data.
3.2. The Numerical Solution of the SEIR Model with the Homotopy Perturbation Method
The SEIR model used for transmission of tuberculosis can be solved by finding a numerical solution using the Homotopy Perturbation Method (MPH). According to MPH, a homotopy was built to model Tuberculosis transmission that fulfills the following relationships:
( ) (12)
( ) (13)
( ) (14)
( ) (15)
( ) ( ) (16)
The Homotopy Perturbation Method has the initial approximation as follows: (17)
(18)
(19)
(20)
(21) From the actual data retrieval from the Ministry of Health:
8342000 8329824 1
c
,
c
2
0.09985404
,, 8342000 8523 3 c 8342000 3653 4 c
, and 8342000 1218 5 c
with parameter
000035
.
0
h
,
h
0
.
326655
,
h
0
.
00031
,123111
.
0
,
h
0
.
041230
,
h
0
.
00088
,and038655
.
0
h
giving:V1,1 =– 0,3264877101 t (22)
V2,1 = 0,0002181700241 t (23)
V3,1 = 0,3262239239 t (24)
V4,1 =– 0,00001693054764 t (25)
V5,1 = 0,00004213579094 t (26)
V1,2 = 0,1067614812 t 2
(27) V2,2 = – 0001049399155 t
2
(28) V3,2 = – 0,1201102811 t
2
(29) V4,2 = 0,000004184142769 t
2
(30) V5,2 = 0,013450210032 t
2
(31)
V1,3 = – 0,03491100435 t 3
(32) V2,3 = 0,00003448372780 t
3
(33) V3,3 = 0,03983043004 t
3
(34) V4,3 = – 0,000001453533077 t
3
(35) V5,3 = – 0,004952617501 t
3
(36)
V1,4 = 0,01141589843 t 4
(37) V2,4 = – 0,00001127830383 t
4
(38) V3,4 = – 0,01304742648 t
4
(39) V4,4 = 4,805770588 . 10
-7
t4 (40)
V5,4 = 0,001642381922 t 4
(41)
V1,5 = – 0,003732998787 t 5
(42) V2,5 = 0,000003686870186 t
5
(43) V3,5 = 0,004267452431 t
5
(44) V4,5 = – 1,562155510. 10
-7
t5 (45)
V5,5 = – 0,0005380028604 t 5
(46) Then, the solution of SEIR model for TB transmission using MPH is:
x(t) = 0,9985403980 – 0,3264877101 t + 0,1067614812 t2 – 0,03491100435 t3 + 0,01141589843 t4 – 0,003732998787 t5
(47)
u(t) = 0,09985403980 + 0,0002181700241 t – 0001049399155 t2 + 0,00003448372780 t3 – 0,00001127830383 t4 + 0,000003686870186 t5 (48)
y(t) = 0,001021721410 + 0,3262239239 t – 0,1201102811 t2 + 0,03983043004 t3 –0,01304742648 t4
+0,004267452431 t5(49)
z(t) = 0,0004378806042 – 0,00001693054764 t + 0,000004184142769 t2 – 0,000001453533077 t3 + 4,805770588 . 10-7 t4 – 1,562155510. 10-7 t5 (50)
819
0,013450210032 t2 –
0,004952617501 t3 + 0,001642381922 t4 – 0,0005380028604
t5 (51)
The MPH method for the SEIR model is calculated until the 10th iteration or more to produce the desired or logical solution. The results of these iterations are shown in Figure 4 to Figure 9 below.
Fig. 4. Graph of Suspected Number of TB Cases
Fig. 5. Exposed graph for the number of TB cases
Fig. 6. Graph of Infected of Human Number of TB Cases
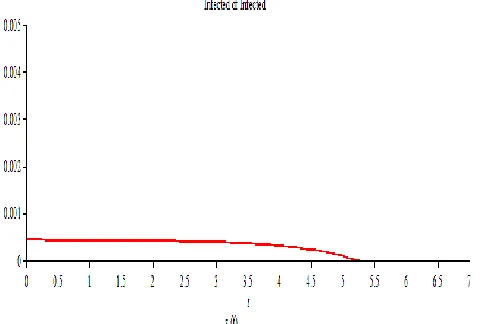
Fig. 7. Graph of Infected of Infected Number of TB Cases
Fig. 8. Recovered Graph Number of TB Cases
Fig. 9. Numerical Solution of SEIR Model for TB Transmission in South Sulawesi
820 of Tuberculosis cases in several regencies or big cities in
South Sulawesi can generally show Tuberculosis cases that occur in South Sulawesi. The simulation results provide a general description of the same pattern for cases that occur in cities or districts in South Sulawesi.
4.
CONCLUSION
Using the homotopy perturbation method (MPH), we obtained an overview of the number of Suspected and Infected tuberculosis in South Sulawesi in the following year, the peak number of TB cases and a decrease in the number of cases. The MPH method also shows the rate of development of the number of infected populations, both infected with the virus, and infected by humans who have been infected in South Sulawesi so that preventive measures can be taken as early as possible.
ACKNOWLEDGEMENT
We would like thanks to Dikti No:122/UN36.9/PL/2019 for financial support this research.
DATA
AVAILABILITY
The data used to finding support of this paper are available from the corresponding author upon request.
REFERENCES
[1]. Arfandi S. ―Kemitraan Sinergisitas dalam Pengendalian Tuberculosis‖. 2012.
[2]. http://repository.unhas.ac.id/handle/123456789/7805. (10 oktober 2016).
[3]. Diknas. Profil Kesehatan Sulawesi Selatan. 2016. [4].
http://dinkes.sulselprov.go.id/berita-situasi-tb-paru-di-sulawesi-selatan.html#ixzz4NyhkE3dd (10 Oct 2016). [5]. KKRI, Fakta kesehatan dunia. 2008.
[6]. Magombedze G, Eda S, & Ganusov VV. 2014 ―Competition for Antigen Between Th1 and Th2 Responses Determines The Timing Off The Immune Response Switch During Mycobaterium Avium Subspecies Paratuberulosis Infection In Ruminants‖. Plos Comput Biol, Vol:10.
[7]. Profil Kesehatan Indonesia, 2009.
[8]. Side, S., Sanusi, W., Usman Mulbar and Sahlan Sidjara ―A SEIR model for Transmission of Tuberculosis‖. AIP Conference Proceedings.1830, 020004. 2016.
[9]. Side, S., ―A Susceptible-Infected-Recovered Model and Simulation for Transmission of Tuberculosis. Advanced Science Letters. Vol. 21, 137-139. 2015. [10].Rangkuti, Y.M., Side, S. and Noorani, M.S.M, 2014.
Numerical analytic solution of SIR model of dengue fever disease insouth Sulawesi using homotopy perturbation method andvariational iteration method. Journal of Mathematical and Fundamental Sciences.,46(1): 91-105
[11].Syafruddin, S. and Noorani, M.S.Md. 2013. Lyapunov Functions of SIR and SEIR Model for Transmission of Dengue Fever Disease. International Journal
Simulation and Process Modeling; Inderscience Publishers 8(2,3):177-184
[12].Side, S., Sanusi, W., Aidid, M.K., and Sidjara, S.. 2016. Global Stability of SIR and SEIR Model for Tuberculosis Disease Transmission with Lyapunov Function Method. Asian Journal of Applied Sciences; 9(3): 87-96