© Global Society of Scientific Research and Researchers http://ijcjournal.org/
Cloud Management Architecture for Private Clouds
Berhanu Endesha
a*, Desta Zerihun
b, Dr. Ravindra Babu
caAcademic & Research Assistance, Adama Science and Technology University, Ethiopia.
bAssistant Professor, Adama Science and Technology University, Adama, Ethiopia.
cAssociate Professor, Adama Science and Technology University, Koniki, India.
a
Email: [email protected]
b
Email: [email protected]
cEmail: [email protected]
Abstract
Operation management for a private cloud infrastructure faces many challenges including efficient resource
allocation, load-balancing, and quick response to real-time work- load changes. Traditional manual IT operation
management is inadequate for this highly dynamic and complex environment. This work presents a distributed
service architecture that is designed to provide an automated, shared, off-site operation management service for
private clouds. The service architecture incorporates important concepts such as: Metric Templates for
minimizing the network overhead for transmission of cloud metrics; a Cloud Snapshot that provides a global
view of the current status of the cloud, supporting optimal decision making; and a Calendar-based Data Storage
Model to reduce the storage required for cloud metric data and increase analysis performance. A proactive
response to cloud events is generated based on statistical analysis of historical metrics and predicted usage. The
architecture, functional components and operation management strategies are described. A prototype
implementation of the proposed architecture was deployed as a service on the OpenStack. The effectiveness and
usability of the proposed proactive operation management solution has been comprehensively evaluated using a
simulated private cloud with dynamic workloads.
Keywords: Architecture; Cloud; Operation Management; OpenStack.
1. Introduction
Cloud computing introduces a new computing paradigm to IT organizations. The cloud deployment of services
is maturing at pace.
---
It seems that market momentum makes the widespread adoption of cloud computing inevitable. At the same
time, the use of a public cloud poses concerns, such as security, privacy, data confidentiality, infrastructure
control, and vendor lock-in (as discussed, for example, [1,2,3]). In this context, the use of private and hybrid
clouds become important alternatives for many organizations.
Acquiring a private/hybrid cloud brings IT management responsibilities back to the IT organizations. In
particular, cloud operation management is different from traditional IT operation management. The new cloud
concepts, such as: asynchronous architecture; virtualization; resource fabric, require IT personnel to gain new
knowledge and skills in order to efficiently manage the cloud infrastructure. Most cloud vendors provide private
cloud operation management suites [2,4]; these are essentially a set of tools given to IT personnel to ease
operation management processes. Faced with the problem of optimal placement of several hundreds of Virtual
Machines (VMs) and the need to respond to thousands of randomly Acquiring a private/hybrid cloud brings IT
management responsibilities back to the IT organizations. In particular, cloud operation management is different
from traditional IT operation management. The new cloud concepts, such as: asynchronous architecture;
virtualization; resource fabric, require IT personnel to gain new knowledge and skills in order to efficiently
manage the cloud infrastructure. Most cloud vendors provide private cloud operation management suites [2,4];
these are essentially a set of tools given to IT personnel to ease operation management processes. Faced with the
problem of optimal placement of several hundreds of Virtual Machines (VMs) and the need to respond to
thousands of randomly occurring system events, it is easy to conclude that the reactive management approach is
no longer suitable for cloud management. As well as management complexity, tools for managing cloud
infrastructure are often available to those with large budges in IT. A distributed, multi-tenant operation
management service can lower such cost as well as on operations and facility. To better respond to business
demands on IT resources, the term Proactive Management has been stressed by many industrial cloud
management solution pioneers [5,6,7]. Proactive management, in essence, deals with the management life cycle
of information collection, event detection/analysis, and response. Consideration must also be given to aspects
such as transmission of metric data to the management service components, metric data storage, anomaly
detection and resource management, and appropriate timely event response. These challenges and their solu-
tion characterize the proposed architecture and differentiate this work from others. A prototype implementation
of the proactive operation management was deployed on the OpenStack, and a simulated private cloud client
was connected to this service. A set of real-world workloads was given to each simulated entity of the simulated
private cloud. The important aspects of the architecture were evaluated in terms of communication cost, Cloud
Snapshot transmission cost, and the effectiveness of the Calendar-based Data Storage Model. The evaluation
demonstrated the effectiveness and usability of the proposed architecture. The remainder of the paper is
organized as follows. Section II presents and discusses the proposed architecture. Section III evaluate the
prototype implementation of the architecture. A discussion of related work follows in section IV, and the final
section presents conclusion and directions of further research.
2.Architecture overview
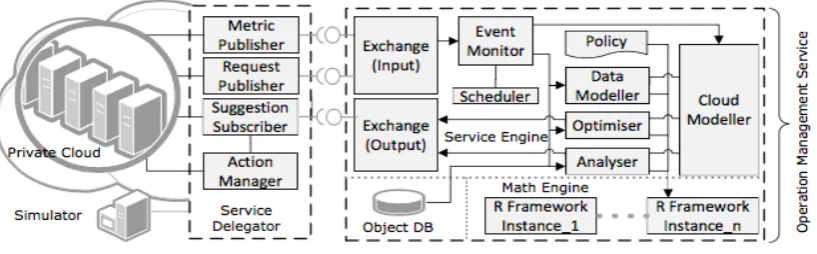
The proposed architecture (Figure 1) has two high-level components, a Service Delegator and an Operation
Figure 1:The Proactive Operation Management Architecture component diagram
A.
The Service DelegatorThe Service Delegator acts as a middleware between a private cloud and the cloud Operation Management
Service (OMS). A key design consideration for the Service Delegator is that the Service Delegator must not
provide any publicly accessible point. Network traffic between the Service Delegator and the OMS can be
bidirectional, but the communication session can only be initiated from the Service Delegator to ensure security.
To satisfy this design goal, the components of the Service Delegator need to actively and periodically check
with the management services. Each component of the Service Delegator is a self-contained program; they can
also be gathered together and provided as a VM image.
Essential for the operation of this architecture are the pre-deployed metric monitors on each VM and hypervisor.
Each monitor periodically emits pre-defined metrics to a central point the Metric Publisher. The metrics sent
from metric monitors are often raw data, and usually contain large amounts of redundant and useless
information. In order to minimize the impact of sending metrics to the management service on the local (private
cloud) network, the Metric Publisher uses the collected metrics to fill up Metric Templates. A Metric Template
is essentially a compact data structure which contains a set of ID tags of cloud entities (Servers and VMs), each
ID tag is associated with a series of floating point numbers (metrics) and the order of metrics are known to the
both Service Delegator and OMS. The number of metrics of interest and the order of the metrics are defined by
Metric Template meta-data. The Metric Template meta-data also contains other auxiliary information including
compression scheme, Metric Template Publishing Interval (MTPI), etc., that keep the Service Delegator and
OMS synchronized. It is the responsibility of the OMS to generate Metric Template meta-data, and implement it
through interaction with the Service Delegator. The Metric Template meta-data is also used to control the
subscription service level (such as: bronze, silver, and gold) by manipulating the number of metrics of interest
and MTPI, etc.
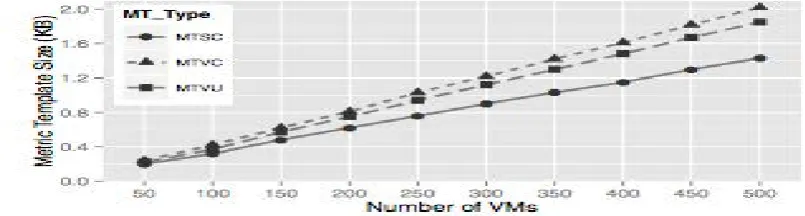
There are four types of Metric Template defined in the prototype implementation: 1) Metric Template for Server
Configuration (MTSC) which contains a list of physical servers with configuration information, current status
and server ID; 2) Metric Template for VM Configuration (MTVC) which contains a list of VMs with
configuration information, current status, VM/server ID, and service ID; 3) Metric Template for VM Utilization
VM/server ID; 4) Metric Template for Server Utilization (MTSU) which contains a list of servers with I/O
related information, such as memory read/write throughput, storage read/write throughput, and server ID.
Within each Metric Template, entities/metrics are separated by selected delimiters accordingly. After filling up a
Metric Template, the Metric Publisher compresses it; prefixes a message-type tag, a time stamp, and a
subscriber ID to the compressed Metric Template; then encapsulates everything into a message using Base64
encode and sends it to the management service Exchange.
The Metric Publisher publishes Metric Templates at a regular time interval the Metric Template Publishing
Interval (MTPI). For the purpose of bandwidth conservation and due to the fact that configuration information
rarely changes, the MTPI for MTSC and MTVC templates are set to be longer than the one for MTVU and
MTSU templates. Notice that metric monitors may emit their measurements at different point of time.
Therefore, within a MTPI, a Metric Template can be in an uncompleted form. For instance,
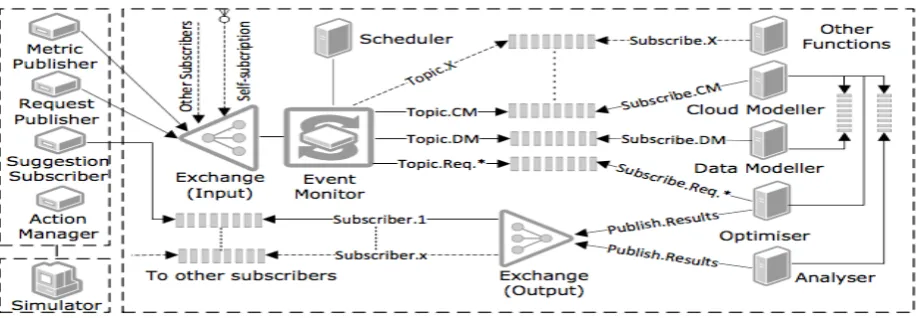
Figure 2:The Proactive Operation Management Architecture communication diagram
a MTVU may not contain all active VMs in the cloud; and any missing data (e.g., storage utilization data) of a
VM listed in the Metric Template is indicated by a special character in the Metric Template. The Request
Publisher does a similar function but deals with customized requests, such as requests for suggestions for a new
VM placement, and these customized requests will be sent immediately. In this work, the MTPI is a fixed time
interval. Ideally it would be dynamically adjusted by the activity level of the private cloud, but this is primarily
limited by the statistical analysis based optimisation engine, and it will be investigated further in future work.
The Suggestion Subscriber component actively and periodically checks with the management service provider
whether there is any information available. The frequency of receiving Suggestions shall be much higher than
MTPI to avoid missing and/or disordered Suggestions. It only receives Suggestions. Suggestions are
encapsulated in the payload of the subscribed messages in XML (eXtensible Markup Language) format. Code
list 1 shows a fragment of a Suggestion for migrating a VM from hostA to hostB (Different actions are
associated with different sets of pre-defined attributes. Furthermore, each action is also associated with a list of
reasons which identify the causes of such an action). In order to achieve automation in the operation
are written in RESTful (Representational State Transfer) APIs. Upon receiving a Suggestion, the Action
Manager will firstly check the validity of the Suggestion (Using the ”< reason >” field). If this Suggestion is still
valid, the Action Manager will use the information from the Suggestion to fill up a corresponding Action
Template and carry out the action in the private cloud. Otherwise, the Suggestion will be ignored.
...
<Suggestion>
<action>
<entity-id>
<source>
<destination> host_B
<reason> src_over_util </reason>
</Suggestion>
...
Listing 1. VM migration Suggestion
B. The Operation Management Service
The Operation Management Service (OMS) is provided as a multi-tenant service. The Service Engine is the core
of the OMS, and it is supported by a sophisticated Mathematical Analysis Engine.
The Service Engine: The Service Engine receives requests and metrics from subscribers through Exchange
(Input). The Exchange (Input) module acts as a common communication interface among subscribers. It
essentially is a queuing system which buffers incoming messages. Messages are directly consumed by the Event
Monitor. The Event Monitor decodes messages, checks expired and miss-ordered messages based on the time
stamp and subscriber ID, then dispatches decoded messages to the designated event-group queue according to
the message type. The Event Monitor defines three groups of events (CM < CloudModelling >, DM <
DataModelling >, and Req < Requests >) (Figure 2) by default. Each group is called a Topic, and Topics are sent
to topic exclusive queues accordingly. Behind each topic queue, there are three compulsory modules (Cloud
Modelling, Optimiser, and Data Modelling) built into the architecture. They are functionally independent.
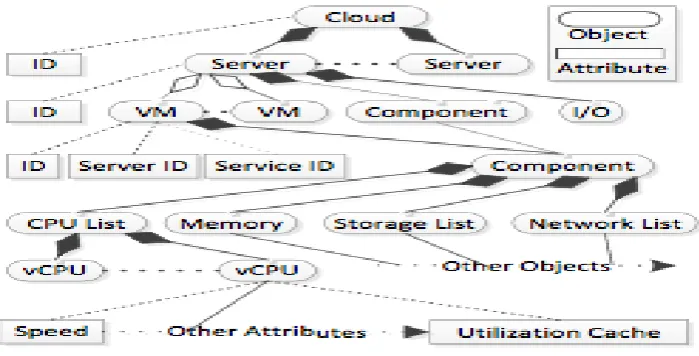
Cloud Modeller. The Cloud Modeller builds a cloud model for each subscribed private cloud. In order to make
correct decisions on cloud operations, such as consolidation of VMs and resource provisioning, a global view of
a subscriber (private cloud) is absolutely necessary. The Cloud Modeller organises cloud objects in a hierarchy.
There are four levels (Cloud, Server, VM, and Component) in the hierarchy illustrated in Figure 3. Ideally, a full
cloud model is built at the beginning of a service subscription. In a real industrial deployment, private clouds
may already up running, and it can be hard to get all information about a private cloud at once. For these
reasons, a cloud model can be built gradually. In another words, a private cloud needs to be connected to the
OMS for a certain period of time to ensure the cloud model is relatively consistent with the actual private cloud.
The consistency level is measured by the number of occurrence of server creation processes in the cloud model.
The Cloud object is created at the service registration phase. The Server, VM, and Component objects are
created upon receiving MTSC and MTVC respectively. If a Server/VM has already been created in the cloud
model, the received data is then used for update purposes. Upon receiving MTSU/MTVU, utilization data of
servers/VMs will be logged into Utilization Cache (Figure 3). The Utilization Cache is a FIFO (First In First
Out) queue. It is used to cache a certain length (a day) of utilization histories which will be used by the
Optimiser. If a server/VM listed in the MTSU/MTVU doesn’t exist in the current cloud model, then it will be
ignored. Because MTSU/MTVU doesn’t contain server/VM configuration information, creating server/VM
objects without configuration information is meaningless in the cloud model. This can be remedied by receiving
subsequent MTSC/MTVC. If both MTVC and MTVU for a VM have not been received for a certain length of
time, it will be considered to be in sleep mode, and eventually be removed. The Cloud model is used directly by
the Optimiser.
Optimiser. The Optimiser is event driven. It is triggered upon receiving requests, MTSUs, or MTVUs. The
Optimiser is tightly coupled with the Cloud Modeller. At the beginning of the service subscription, a dedicated
Optimiser will be assigned to a subscriber (in fact, it is assigned to a cloud model which is specially built for the
subscriber). The Optimiser and the Cloud Modeller run in the same program process but in separate threads, and
listening on their own topic exclusive queues. A proactive response to cloud events is generated based on
statistical analysis of historical metrics and guided by policies. The historical metrics are the data cached in
Utilization Cache (Figure 3). Various restrictions are defined in the Policy including VM affinity, thresholds for
triggering load balancing events. The generated responses are called Suggestions. Suggestions are formatted in
Suggestions based on the Subscriber ID (each subscriber has dedicated Suggestion queues).
Data Modeller. The Data Modeller builds resource usage models for services. Data models are stored and
organised in a Calendar-based Storage Model (CBSM). In simple terms, the CBSM just provides object storage.
Objects (data models) stored in the CBSM are indexed by calendar date so that data models can be associated
with calendar events (such as weekends, public holidays). There are mainly two reasons for storing resource
usage data models rather than the original data. The first reason is to reduce the storage required for cloud
metric data. The OMS continuously receives cloud metrics from subscribers, storing this accumulated data has
serious cost implications. The Data Modeller builds resource usage models for services on a daily, weekly,
monthly, yearly basis. Data models are in fact program objects (generic Java objects, because there are many
choices for modelling data, data models are cast to generic objects and tagged, then stored in CBSM). The
compressed data model objects are much smaller then the compressed original data (discussed in section III-C).
The second reason is to improve the performance of analysis through model reuse. Modelling Data is often a
CPU intensive and time consuming process. Using pre-built data models can significantly improve the
performance of the Analyser.
Two points should be noted. 1). A service is identified by the service ID (Figure 3). The service ID only exists
in the cloud model. It is assigned to be the same as VM ID. If a VM is load balanced, the same service ID will
be shared among them. On the other hand, a service ID is used to determine whether a VM is load balanced. If a
service is load balanced, the resource usage for the service will be the sum of the resource usages of the same
kind. 2). The source of the original data is the cloud model. The cloud model caches resource utilization data for
a day in the Utilization Cache, and when the Utilization Cache is full, it is sent to the Data Modeller to build
daily data model. Rather than sending thousands of Utilization Cache data individually, the OMS sends the most
recent Cloud Snapshot to the Data Modeller. A Cloud Snapshot is simply a serialized cloud model object which
contains a snapshot of the current cloud including any cached data. The Utilization Cache data will also be
temporarily stored for a longer period (a month). After building a monthly data model, the raw data will be
removed permanently (a yearly model can also be built based on the daily model). There are no resource usage
models built for physical servers. The cloud environment is highly dynamic. Events of VM creation, deletion,
migration, load balancing and re- sizing occur frequently and randomly on physical servers. In a such dynamic
environment, long term utilization patterns and trends of physical servers contribute no explicit insight for
improvement of QoS (Quality of Service). The data modelling process is triggered by the Scheduler as well as
the Analysing process.
Analyser. The Analyser has two built-in functions: consolidation of VMs and resource provisioning. It is a
consumer for both the Cloud Modeller and Data Modeller. In general, the Analyser analyses global status of the
cloud using the most recent Cloud Snapshot to determine whether VMs are distributed sparsely in the cloud; and
calculates optimal solutions for consolidation of VMs using data models which have been built by the Data
Modeller. It also uses data models to do resource provisioning.
2) The Mathematical Analysis Engine: The Mathematical Analysis Engine supplies a set of sophisticated
Figure 4: OMS experiment deployment
Modelling components. Because the consumer components require a wide range of functions across branches of
mathematics (such as Structured Time Series forecast technique used by Analyser; sorting algorithms used by
Optimiser; and Auto Regressive Integrated Moving Average data modelling technique used by data modeller),
an extensible and comprehensive mathematical analysis system is needed. The R framework [8] was employed
at the heart of the Mathematical Analysis Engine. R is an open source, statistical framework intensively used in
the field of data analytics. Its flexible and extensible architecture allows packages (various types of functions) to
be installed in a plug-and-play style that best meets our design requirements. If the OMS service is deployed on
a private cloud, The system itself is also a subscriber of its own services. Figure 2 illustrates the proposed
architecture and it is: 1) scalable – each topic subscriber (a functional module) can have multiple instances
listening to the same topic queue, and tasks can then be distributed on multiple topic subscriber instances which
perform the same functions; 2) extensible – as long as new topic definitions are configured at Event Monitor and
topic exclusive queues are in place, new functional modules can be added in at any time, without interfering
with other modules; and 3) flexible – introducing and removing any functional modules has no effect on the
operation of other modules.
3. Evaluation
A prototype implementation has deployed on the OpenStack platform (Infrastructure as a Service - IaaS) (Figure
4). It is a full implementation of the architecture with essential core functionalities for it to work. There were
five VM instances employed for the OMS deployment. All VM instances were configured with two virtual
CPUs (2.4GHz), 4GB memory, and 60GB local storage. CentOS (64-bit) Linux operating system and JRE (Java
Runtime Environment) version 1.8.0 39 were installed on all VM instances. They were located in the Data
Centre, VMware RabbitMQ 3.6.0 queuing
Figure 6: Comparison of compressed Metric Template size
system was deployed on instance-1 acting as the Exchange server. Both Analyser and Data Modeller were
deployed on 4, but they run as separated processes. The R framework 2.15.2 was deployed on
instance-5 acting as the Mathematical Engine. The Service Delegator components ran on a VM. The VM was configured
with single virtual CPU (2.2GHz), 512MB memory, 10GB local storage, and Ubuntu server 12.10 (64-bit). The
private cloud simulator ran on a Windows 7 system with configuration of quad-core CPU (2.2GHz), 8GB
memory and 500GB local storage. It simulated 260 servers and 50 − 500 VMs depending on the purpose of the
simulation. MTPI for MTSC/MTVC/MTVU were set to one minute across all experiments. A collection of
real-world server workloads were given to VMs during simulation. The complexity of the architecture was fully
execised, and important aspects were evaluated.
A. Service Delegator and OMS communication cost
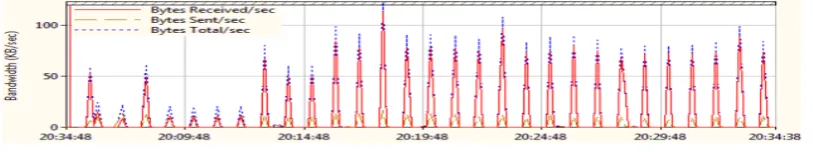
Figure 5 shows the network bandwidth consumption for Service Delegator and OMS communication (indicated
by the dashed line ellipse A, in Figure 4) over 30 minutes. In this experiment, only MTSC, MTVC, and MTVU
were used. The simulator simulated 260 servers and 300 VMs. Each Metric Template was compressed using
ZIP stream algorithm provided by the standard Java package before sending to the OMS. The dashed
yellow-line indicates the bandwidth consumed by sending Metric Templates to the OMS and the cost for transmission
of Metric Templates are found to be relatively small. It increases linearly with the number of VMs (Figure 6).
The red solid-line indicates the bandwidth consumed by receiving Suggestions. The received data is much larger
than the sent data. This is mainly driven by the number of Suggestions received, and Suggestions are not
compressed in the current implementation. Suggestion compression and encryption will be implemented in the
future work. Notice that the received data size varies over time. This is because of the number of Suggestions
received is influenced by the number of abnormal events detected. For instance, if CPU utilization of host A is
reached 90% of its capacity. A VM migration Suggestion (Code list 1) will be sent to the Service Delegator. The
dotted blue-line indicates the total bandwidth consumption. With the scale of 260 server and 300 VMs, the
average bandwidth consumption is approximately 30KB/sec. If the MTPI is set to be longer (for instance, five
minutes), the required network bandwidth will be lowered significantly (to approximately 6KB/sec).
B. Cloud Snapshot transmission cost
of the cloud, supporting optimal decision-making and data modelling. One of the main design concerns was the
Cloud Snapshot transmission overhead between Cloud Modeller module and Analyser/Data Modeller modules
(indicated by the dashed line ellipse B, in Figure 4). Figure 7 shows the serialized, compressed, and encoded
Cloud Snapshot size increases linearly and slowly with the number of VMs. The Cloud Snapshot transmission
time counter starts at the beginning of the cloud model object serialization process at the Cloud Modeller, and
stops at the end of the Cloud
Figure 7: Comparison of compressed Cloud Snapshot size
Figure 8: Metric Template size
Snapshot de-serialization process at the Analyser/Data Modeller. Figure 8 shows the Cloud Snapshot
transmission time for 50 − 500 VMs and the cost in time increases rapidly with the number of VMs. Because
both Analyser and Data Modeller are scheduled processes, and they are primarily used for consolidation of
VMs, resource provisioning, long term decision support, and storage conservation, therefore, such a scale of
time delay is tolerable.
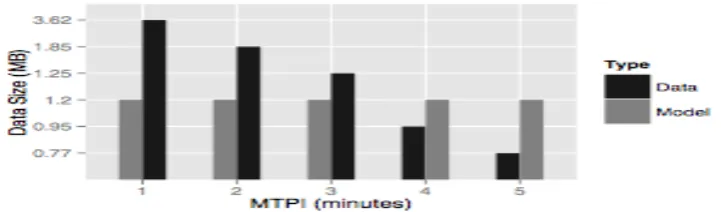
C. Calendar-based Storage Model
Figure 9 shows the comparison of the original data size and its data mode object size. With larger data sets the
CBSM can save more storage space. The original data was one week of CPU utilization for 300 VMs. Sampling
intervals were set to be 1 − 5 minutes (corresponds to the MTPI). The bigger MTPI indicates less metric
readings. Both original data and data model objects were compressed using a ZIP stream algorithm provided by
the standard Java package. Data models were built using a Local Polynomial Fitting algorithm provided by the
R framework. Because all data models were built with a fixed sampling interval (1 hour), therefore the size of
data models doesn’t change with the MTPI.
4. Related work
Clouds and their services operate in an virtualised environment. The adoption of virtualization technology
decouples the traditional relationship between operating systems and physical machines. It offers opportunities
for inserting layers of infrastructure management and operation automation.
Cloud technology vendors, such as Cisco, Microsoft and VMware, provide their own on-site, proprietary cloud
system management suites. Cisco Systems has outlined a notable cloud capacity management strategy based on
ITIL v3 (Information Technology Infrastructure Library Version 3) reference architecture. Its key concept is to
build a Cloud Capacity Model [1]. The capacity model consists of three planes: Component, Service/Domain,
and Business. The Components plane contains all available resources, and they are building blocks to the
Service/Domain plane. These resource building blocks are divided into different component catalogues.
Example component catalogues are network, storage, and compute. In the Service/Domain plane, each
component catalogue associates with a Service Model, Demand Model, and Service Forecast. The Business
plane consists of Service Catalogue and Business Forecast. Capacity plans are produced based on the Business
Forecast and Service Forecast as the two primary inputs. Microsoft as a major cloud player, also provides a
private cloud management solution VMM (Virtual Machine Manager) [2]. A noteworthy component of VMM is
the Library. A Library acts as a resource repository. It contains various resources including VM images, scripts,
and best practice templates, etc. Leveraging the Library maximizes the re- source reusability and avoids
error-prone tasks. VMware CapacityIQ [4] is another cloud infrastructure management solution offered by VMware
Technologies. Its basic function is to collect statistic/history information about cloud objects for management
personnel. Its unique capability is of modelling potential changes to the virtualized environment of clouds.
These solutions are categorised as passive management. They require IT personnel to operate and lack of
automation. In contrast, this work aimed to provide an automated operation management solution.
There are also third parties providing cloud operation management solutions. BMC Software [5] provides
comprehensive solutions for managing clouds services and infrastructures. Service performance is proactively
analysed by an Application Behaviour Learning Engine, which is based on statistical analytic techniques, and
cloud resources are continuously optimised [5,9]. Netuitive [6] is a similar commercially available solution.
Architecturally, it consists of three tiers: Aggregation, Correlation, and Presentation. The Aggregation tier
self-learning mechanisms that learn cloud services behaviours. Abnormal events are then predicted based on
advanced statistical analytic techniques. The Presentation tier provides an visualized presentation of current
cloud status and reports. CA Technologies [7] is another third party cloud management solution provider. Its
Virtual Placement and Balancing solution automatically optimises cloud resource usage based on both statical
and optimisation techniques.
Beside industrial solutions, Sotomayor and his colleagues [10], presented a private, hybrid cloud management
suite the OpenNebula. OpenNebula provides essential tools for managing cloud infrastructure rather than
reactive responding compared to this work. Vasic ́ and his colleagues [11], introduced the DejaVu framework
for virtual resource management. It classifies workloads into a small number of categories using signatures.
Categories are distinguished by resource usage patterns which are learned from the past. As workloads change
with time, virtual resources are automatically adjusted based on the usage patterns of the workload category into
which the workloads fall.
5. Conclusion and future work
This work aims to provide an automated and cost-efficient solution for modern private cloud operation
management. An innovative distributed service architecture designed to provide an automated, shared, off-site
operation management service for private clouds has been presented. The architecture has developed several
useful mechanisms to solve various challenges in the field; these include the Metric Template, Action Template,
Calendar-based Storage Model, and Cloud Snapshot. A prototype implementation of the service architecture
was developed, and important aspects were evaluated under simulated realistic workload conditions. Evaluation
has demonstrated the effectiveness and the usability of the architecture. One issue for future work is to develop a
comprehensive coordination solution to cater for the complexity introduced by an increased number of
functional modules. Schemes for ensuring consistency between the private cloud and cloud model will also be
investigated in detail in future work.
References
[1] G. P. Venkata Josyula, Malcolm Orr, Cloud Computing Automating the Virutalized Data Center. Cisco
Press, 2012, ch. 7, 12, pp. 263–276.
[2] P. L. Aidan Finn, Hans Vredevoort and D. Flynn, Microsoft Private Cloud Computing. Wiley
Publishing, Inc, 2012, ch. 3, 5, pp. 89–116.
[3] Gartner Outlines Five Cloud Computing Trends That Will Affect Cloud Strategy Through 2015,
Gartner, Inc., Connecticut, USA, 2012. [Online].Available:http://www.
gartner.com/it/page.jsp?id=1971515
[4] vCenter CapacityIQ Installation Guide, VMware, Inc., California, USA, 2011, Serial EN-000417-01.
[5] D. Williams and L. Minnix-Wolfe, Netuitive Private Cloud Management, Texas, USA, 2011,
Serial208881.[Online].Available: http://documents.bmc.com/products/documents/88/
81/208881/208881.pdf
[6] Netuitive Private Cloud Management, Virginia, USA, 2012. [Online]. Available:
http://www.netuitive.com/resources/pdf/ds-netuitive-for-cloud-management.pdf
[7] Can You Optimize Your Use of Your Virtualization and Cloud Resrouces, both Now and in the
Future?, CA Technologies, Inc., New York, USA, 2012, Serial CS2014 0312. [Online]. Available:
http://www.ca.com/us/ /media/files/solution briefs/cs1565-virt -place-bal-sol-sb-0711d.aspx
[8] R Development Core Team, R: A Language and Environment for Statistical Computing, R Foundation
for Statistical Computing, Vienna, Austria, 2011, ISBN 3-900051-07-0. [Online]. Available:
http://www.R-project.org/
[9] L. Cherkasova, K. Ozonat, N. Mi, J. Symons, and E. Smirni, “Automated anomaly detection and
performance modeling of enterprise applications,” ACM Trans. Comput. Syst., vol. 27, no. 3, pp. 6:1–
6:32, Nov 2009.
[10] B. Sotomayor, R. Montero, I. Llorente, and I. Foster, “Virtual infrastructure management in private
and hybrid clouds,” Internet Computing, IEEE, vol. 13, no. 5, pp. 14 –22, Oct 2009.
[11] N. Vasic ́, D. Novakovic ́, S. Miucin, D. Kostic ́, and R. Bianchini, “Dejavu: accelerating resource
allocation in virtualized environments,” SIGARCH Comput. Archit. News, vol. 40, no. 1, pp. 423–436,