©2014 JNAS Journal-2014-3-2/151-160 ISSN 2322-5149 ©2014 JNAS
The use of artificial neural network in predicting
bankruptcy and its comparison with genetic
algorithm in firms accepted in Tehran Stock
Exchange
3
Masoud Taherinia
and
*
2
, Darush Javid
1
Masoumeh Zebardast
1-MA in Accounting, Department of accounting, Science and Research branch, Islamic Azad University, Boroujerd, Iran
2-Assistant professor, staff member in Islamic Azad University, Boroujerd Branch 3-Assistant professor, staff member in Lorestan University
Corresponding author: Darush Javid
ABSTRACT
:
Regarding the reverse effects of bankruptcy on capital markets and economics, the researchers and beneficiaries tended to use different approaches, create prediction models and develop them to reduce the losses incurred and their effects. Today different models are used to predict bankruptcy. This analysis is going to predict bankruptcy in firms accepted in Tehran Stock Exchange by using artificial neural network and genetic algorithm and finally we will try to identify the efficiency of the best model. Our sample entails 42 bankrupted and 84 non-bankrupted companies during the time period between 2006 and 2011 and the companies have been selected by using a random sampling method. Our research sample was selected through 70% training and 30% testing and then modeling and model testing were carried out. Independent variables used in this research include 7 financial ratios. Finally results of two models were compared with each other. Artificial neural network model in this research was multi-layer neural network with a hidden layer using train LM method which could achieve a precision of %95.5 in training stage and %80.5 in testing stage and %91.2 on the whole. Also genetic algorithm model gained %86.7 precision in training stage and %86.5 in testing stage, while its overall precision was equal to %86.5. Thus, by using the results gained for artificial neural network model we observed more precision in predicting bankruptcy compared to genetic algorithm model.Keywords: : genetic algorithm, bankruptcy prediction, artificial neural network, bankruptcy.
INTRODUCTION
Bankruptcy has always attracted a vast variety of individuals, organizations and a great part of the society as a whole to itself. Investors not only use bankruptcy prediction to avoid the risk of losing their capital, but also use it as a means to reduce the risk of investment basket. Managers in business units also can prevent bankruptcy to happen if they are informed about bankruptcy risk in time. There have been several methods in bankruptcy literature to model predicting inability of a business. These models have had their weak points and strengths. On the other hand choosing a pattern specifically for the users of financial information and appropriate for their needs and environmental conditions is a complicated issue. If we can use appropriate patterns, creditors, investors, and managers of companies would be able to predict bankruptcy of companies, years before it happens, and then regarding the results of these models they will carry out appropriate actions to avoid losses.
152
Multiple variable statistical models are comprised of multiple recognition models, linear probability, logit, probit, integrative sum, and incomplete adjustment processes.
Artificial intelligence techniques include: artificial neural network, genetic algorithm, retroactive, hard sets, focal point vector tool, and reasoning based on fuzzy logic. Also theoretical models include: balance sheet analysis criteria/ anthrop theory, bankruptcy theory of bonds, cash management theory, and credit risk theory.
MATERIALS AND METHODS
A review of studies carried out about bankruptcy prediction
William Beaver used one variable analysis for the first time to study about financial ratios in predicting financial vulnerability. He mostly used ratios which were related to cash flows in this analysis. His model was able to have correct predictions in %78 of the cases during 5 years before financial vulnerability [8]. In the researches afterwards, multiple variable models were considered. Edward Altman started his study to supply a concise and multiple variable models. He posed a model by choosing 22 financial ratios and analyzing them by using a statistical multiple recognition analysis models of function z-score which was comprised of a financial ratio. Altman's precision for one year before bankruptcy was about %95.5 and for two years before bankruptcy he gained a precision level of about %83 [7].
Shin, Lee & Kim used support vector machine in 2005 to pose a model to predict bankruptcy. They compared their model's performance with performance by artificial neural networks. Their study showed that support vector machine has had a better performance both regarding generalization and overall model precision. They used 10 financial ratios between the years 1966 and 1999 to carry out their research [11].
Varetto used genetic algorithm to predict bankruptcy. His sample entailed 500 companies including 236 bankrupted companies and 264 non-bankrupted companies. Results of this research showed %93 prediction precision one year before bankruptcy and %91.6 precision for two years before bankruptcy [14].
Odom & Sharda used neural networks for the first time to design bankruptcy prediction models in 1990. Their research findings showed that results of neural networks are more correct, more precise, and more valid than multiple variable linear recognition method [12].
Tom & Kiang compared prediction capability of neural networks by predicting linear recognition analysis, logistic regression, decision trees, and the closest neighboring k and showed that results of neural networks are more correct, more precise, and more valid [13].
Shah & Morteza presented a model by using artificial neural network (ANN) to predict bankruptcy. In this study they used information about 60 bankrupted companies and 54 non-bankrupted companies between the years 1992 and 1994. Prediction precision in this model was %73 [10].
Min & Lee used learner machine technique to predict financial crisis. Also researchers have compared research results by using multiple differentiation analysis techniques, logistic regression analysis, and artificial neural networks. By using 11 financial ratios as independent variables, researchers found out that using learner machine technique has better results compared to other methods. Also the precision percentage for control sample was estimated to be between %71 and %83 [9].
But some similar researchers have been carried out in Iran, some of which will be presented below:
Reza Raee & Saeed Fallahpour compared prediction power of neural networks and multiple variable linear isolator method. Average prediction precision for linear isolator model was %93.4 on the whole, and neural networks' prediction precision was calculated to be %95.3. they presupposed stop point in linear isolator method to be 0.5. Finally it was concluded that ANN model has a more prediction precision in predicting financial vulnerability meaningfully compared to MDA model [3].
Mahmoud Firouzian & et al studied the application of genetic algorithm in predicting bankruptcy in firms accepted in Tehran Stock Exchange and compared it with Z model posed by Altman. Genetic algorithm model could have an average precision equal to %90 and %91.5 in one and two years before the base year and Z Altman's model has had a precision equal to %83.32. Regarding these results, genetic algorithm model has had a more precision in predicting bankruptcy and thus it is considered to be a more appropriate tool for prediction [4].
153
Etemadi & et al (2008) used genetic planning (the developed case for genetic algorithm) to predict bankruptcy. Their sample entailed 140 companies, including 70 bankrupted and 70 non-bankrupted companies. Results of this research showed a prediction precision of %94 for one year before bankruptcy [1].
The rest of researches carried out in Iran were mainly dealing with testing bankruptcy models of Altman, Springit, Shirata, Zimmesky, and…
Research hypotheses
Hypothesis (1): Artificial neural network model is an appropriate tool to predict bankruptcy in firms accepted in Tehran Stock Exchange.
Hypothesis (2): Genetic algorithm model is an appropriate tool to predict bankruptcy in firms accepted in Tehran Stock Exchange.
Hypothesis (3): Artificial neural network model acts more conservative than genetic algorithm model.
Population and statistical sample
To determine the number of firms present in bourse and also bankrupted companies (under the application of article 141 of business rules) we have used Rahaward-e-Novin software. The statistical society for this research is all companies accepted in Tehran Stock Exchange including two groups of bankrupted and non-bankrupted companies.
All companies included in our statistical society have had the following conditions: - They were accepted in bourse before 2006.
- Their financial statements were presented to bourse during the time period between 2006 and 2011. - They were not among financial intermediary companies.
Note that our criterion to consider a company as bankrupted or encountering financial vulnerability in this research was to be included under the control of article 141 of business rules. First a list of firms accepted in Tehran Stock Exchange during the time period determined for this research was applied. The number of these companies was 42. We chose a double amount of these companies (84) from among non-bankrupted companies by using a random sampling method. Thus, our sample included 126 companies. The research sample was extracted in the form of %70 training and %30 testing and modeling and model testing were carried out by using them.
It should be noted that we used information about three years of each of the companies. The base year for bankrupted companies was the year they were included as those which accorded with article 141 of business rules and it was the year they had the highest amount of accumulated earnings for non-bankrupted companies.
Variables studied in research analytic model
In this part we will deal with calculating all research variables which were explained in two groups of input and output.
Input variables
Studying literature about this research topic showed that financial ratios posed about bankruptcy prediction fall into 7 ratio groups which will be utilized in this research as follows:
Cash ratio: to calculate this ratio we divide cashes in a company into its current liabilities.
Current ratio: to calculate this ratio we divide current assets into current liabilities.
Immediate ratio: it is an index to show liquidity power in a company. To calculate this ratio we subtract inventory from current assets and divide the residual into current liabilities. The most appropriate number for this ratio is 1 at least.
154
Assets' return: the amount of earning is calculated for each Rial of invested money in assets of the company. To calculate this ratio we divide net earnings into total assets. This ratio is one of the main indexes in assessing efficiency of management in each company.
Assets' flow ratio: using this ratio we can calculate the relationship between assets' value and the amount of activities of a company during a certain period. This ratio represents the amount of assets' flow during a financial period and higher amounts are more desirable.
Flowing capital to total assets ratio: to calculate this ratio we subtract current liabilities from current assets and divide the result into total assets.
Output variable
Output variable of this research was a binary variable which was equal to 1 for firms included in the list of bankrupted companies and was equal to 0 for non-bankrupted ones.
The construction of bankruptcy prediction model by using artificial neural network and genetic algorithm models
The implementation of a model by using artificial neural networks or genetic algorithm requires the use of software. The software utilized in this research was MATLAB.
Neural network
The network used in present research was a front feeding network which will be explained below.
Front feeding network
Front feeding networks often have one of several hidden layers of sigmoid neurons and use a final linear layer. The existence of several layers of neurons with a non-linear transfer function lets network to have the ability of learning linear and nonlinear relationship between inputs and outputs. Linear output layer lets the network to have outputs out of +1 and -1 boundaries. Of course, if we need an output for example within the limits of 1 and 0 we can use a logistic function in linear layer.
The scheme designed for the present research was comprised of two function layers of Tan Sigmoid and Log Sig as follows:
Thus the type of network used in this research was a multilayer front feeding network with 1 hidden layer and a training method of Train LM.
Genetic algorithm
Genetic algorithms work on encoded strings of problem parameters in which every string represents for an answer for the problem. The real amounts of parameters are gained from decoding these strings. These algorithms are parallel search algorithms which work on a population of answers. This characteristic will result in genetic algorithm being able to search different areas of answer environment concurrently and this will result in reducing getting trapped in optimized local points. Below we will describe general principles of genetic algorithm and steps needed to solve a problem in choosing optimal variables in prediction of bankruptcy of companies [5].
Encoding decision variables
155
In order to solve the problem of selecting optimal variables in predicting bankruptcy of companies, each
chromosome is formed of several sub-chromosomes. The number of sub-chromosomes equals with the number of variables (ratios). The corresponding number for each sub-chromosome shows the amount of ratio. For example figure 2 shows that the amount of first variables equals 2 and other variables are equal to 0. It should be noted that the maximum number each gene can have equals with maximum ratios in corresponding variable with that gene. Every sub-chromosome is composed of a number of genes and the number depends on the precision intended for the ratios and maximum and minimum amounts of ratios. Since genetic algorithm utilized in this research is binary genetic algorithm, the number appropriated for each gene can be either 1 or 0.
Figure 2. The structure of chromosomes of the selection of the most optimal variables in firms' bankruptcy prediction
Assessment
This stage plays a very important role in problem solving using genetic algorithm method. In this stage we deal with responses being better or worse chosen from the primary population by introducing a criterion and size. In solving problem the selection of the amount of optimal variables of this research regarding the target function will de determined based on equation (1) below:
Equation (1) Minimize (TF) = TPFNBC - TPCBC Where,
Minimize (TF) is target function which should be minimized. TPFNBC is total predicted firms to be non-bankrupted. TPCBC is total predicted companies bankrupted correctly.
In this problem the target is to predict bankrupted companies and since genetic algorithm usually is used to minimize target functions, it seems that target function should be predicted correctly to be equal to negative sum of bankrupted companies (second expression in equation1). But regarding target function in this way will lead to predict a great number of non-bankrupted companies to be included in the list of bankrupted ones. Thus, in order to modify target function the sum of non-bankrupted companies which were wrongly entitled as bankrupted ones should be added to target function as fare (first expression in equation 1).
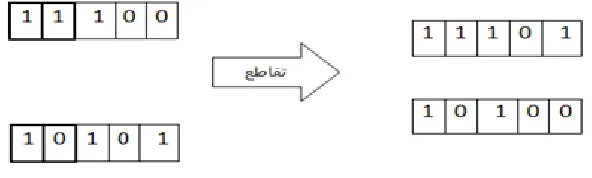
Crisscross operator
In genetic algorithm some changes are made on selected responses (chromosomes) in order to create a new generation (with a set of new chromosomes) of responses. These changes are called operator implementation. Crisscross operator acts on selected responses in a way that a point is chosen randomly on a chromosome string, and then areas to the left or right side of that point are moved in chromosome string. This operator acts on responses by a predetermined probability. The performance of this operator is schematically shown in figure 3 below.
Figure 3. Performance type of crisscross operator
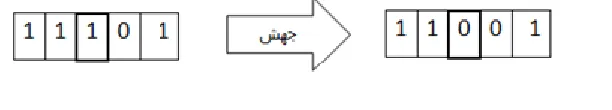
Jump operator
156
predetermined probability. The performance type of this operator has been schematically represented in figure 4. In implementing jump operator on series of responses of equation (1) after the random selection of jumping point, a random number belonging to the set [0, 1] is produced and altered for the previous number. It should be noted that in order to create new response sets, another new number should be produced if this number is equal to the previous one. The production of new number should be continued until the new number becomes different from the previous one.
In implementing jump operator on set of responses in equation (1), we should consider that the maximum number belonging to each gene should be equal to maximum ratios and the random number created should not exceed this limitation.
Figure 4. Performance type of jump operator
Decoding
In this stage after the presentation of the best response for the problem by the algorithm it is required to carry out the reverse action of encoding on responses to achieve the real version of response.
Genetic algorithm develops by doing the followings step by step:
1- Commencement of population with a population of n random chromosomes 2- Calculating merit function for each chromosome
3- Creating new populations by copying each chromosome with an appropriate number considered for merit function of that chromosome
4- Implementing crisscross and jump operators on chromosomes and producing new generation 5- Going to step 2
6- Repeating steps 2 to 5 regarding the predetermined number of repetition
Model administration
Data collected from database of the companies in our statistical sample were categorized using Excel software and the number of research variables was calculated using this software. In administering these models we used t test and F test mentioned below. Then we used SPSS and Matlab software to test research hypotheses.
T test
T test is applicable in small samples. T distribution is similar to normal distribution regarding many aspects and when the sample reaches 30 in number it will be almost the same with normal distribution(2). In the present research and to study the research hypotheses we have used this test. Accordingly, if the meaningfulness level calculated is less than 0.20, the amounts calculated will be meaningful in assurance level of %80 statistically.
F test
Usually F test is used to study the difference and effectiveness regarding two variables. When we tend to test the effectiveness of several variables t test is not able to study the effectiveness of each of independent variables on dependent variable in isolation. In this case the occurrence of statistical errors and wrong calculations would be inevitable. In order to remove this problem we have used F Fischer test. This method creates the possibility of recognizing meaningful differences between groups and the effect of total variables simultaneously (2).
RESULTS AND DISCUSSION
Research findings
To present an overall perspective of the important characteristics of variables calculated, some concepts of descriptive statistics of these variables including average, least criterion deviation, maximum, and number of observations have been represented in table 1.
157
Table 1. Descriptive statistics of research variables
Variable / Statistical index Observations Minimum Maximum Average Criterion deviation
Cash ratio 252 0.00 2.11 0.0791 0.16893
Current ratio 252 0.30 7.24 1.2631 0.80472
Immediate ratio 252 0.13 5.83 0.8098 0.62164
Liabilities to assets' ratio 252 0.10 1.02 0.6659 0.20310
assets' return 252 -0.19 0.43 0.0734 0.10656
Assets' flow ratio 252 0.00 4.04 0.7917 0.52767
Flowing capital ratio 252 -0.60 0.80 0.0623 0.20514
Regarding results reflected in table 1, average cash ratio equals 0.076 unit and this amount shows that the average amount among companies in the sample during research period has been %7.5 cash for current liabilities. Regarding assets' return variable and considering the table above, it can be said that the average of this index equals 0.07 unit and it shows that average amount among companies in the sample during research period has been %7 assets for returns.
Also the table above showed that asset' return variable has had the least dispersion compared to other variables.
Testing research hypotheses:
Testing first research hypothesis
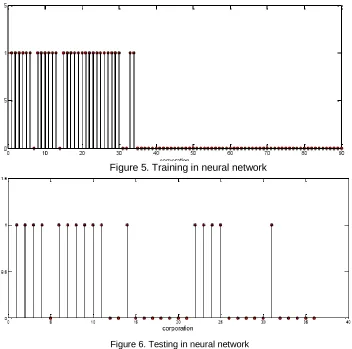
Results of training and also testing neural network in order to predict bankruptcy of firms present in Tehran Stock Exchange are represented in figures 5 and 6 below, respectively.
Figure 5. Training in neural network
Figure 6. Testing in neural network
158
Table 2. Neural network model
Sets Predicted group by using neural network Real group % ratio Precision Overall model precision total bankrupted=1 non-bankrupted=0
Training 30 28 2 1 93.3 95.5 91.2
60 2 58 0 96.7
Testing 12 11 1 1 92 80.5
24 6 18 0 75
First research hypothesis can be stated statistically as follows: neural networks model has the capability of predicting bankruptcy with a precision of more than %80. To study this hypothesis we have used t student test through which model precision was %92.2 which differ %11.2 from the basis determined which has been meaningful in %1 level. Thus, it can be stated with %99 assurance that neural network model is considered an appropriate tool for bankruptcy prediction. On the whole the first research hypothesis regarding that artificial neural network model is an appropriate tool for bankruptcy prediction in firms accepted in Tehran Stock Exchange is approved.
Testing second research hypothesis
Figure 7 represents convergence of genetic algorithm in repetitions. The following curve shows that the optimal response has converged in 58th repetition. Another curve shows the average of responses in each repetition and
the curve trend shows the convergence of response.
Figure 7. Convergence of genetic algorithm
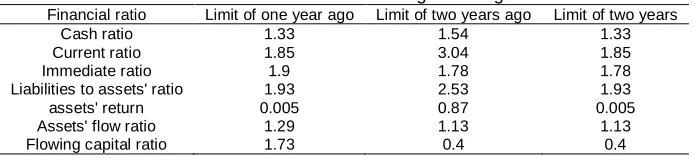
Figure 8 shows the limitation related to financial ratios' limits. The horizontal axis shows financial ratios (7 presented ratios), respectively during one year and two years before basis year and vertical axis shows the boundaries of the corresponding ratios.
Figure 8. Limits related to financial ratios
159
Table 3. Limits of financial ratios in genetic algorithm
Financial ratio Limit of one year ago Limit of two years ago Limit of two years
Cash ratio 1.33 1.54 1.33
Current ratio 1.85 3.04 1.85
Immediate ratio 1.9 1.78 1.78
Liabilities to assets' ratio 1.93 2.53 1.93
assets' return 0.005 0.87 0.005
Assets' flow ratio 1.29 1.13 1.13
Flowing capital ratio 1.73 0.4 0.4
Results of training and also testing genetic algorithm model to predict bankruptcy of companies listed in Tehran Stock Exchange have been presented in table 4.
Table 4. Genetic algorithm model
Sets Predicted group by using genetic algorithm Real group % ratio Precision Overall model precision total bankrupted=1 non-bankrupted=0
Training 30 19 11 1 63.3 86.7 86.5
60 12 59 0 98.3
Testing 12 8 4 1 66.7 86.1
24 1 23 0 95.8
Regarding overall precision of genetic algorithm we can say that from among all companies present in our research sample (126 companies), 109 companies have been categorized properly. Thus, the overall precision of genetic algorithm in categorizing firms in Tehran Stock Exchange to recognize to be bankrupted or non-bankrupted was %86.5.
The second research hypothesis can be stated statistically as follows: genetic algorithm model is capable of predicting bankruptcy with a precision of more than %80. To study this hypothesis we have used t student test through which model precision was %86.5 and it was %6.5 different from the basis determined which had become meaningful in %1 level. Thus, with an assurance level of %99 we can state that genetic algorithm model is an appropriate tool to predict bankruptcy. On the whole the second research hypothesis claiming that genetic algorithm model is an appropriate tool to predict bankruptcy in firms accepted in Tehran Stock Exchange was approved.
Testing third research hypothesis
In order to test the third research hypothesis claiming that artificial neural network model is more conservative than genetic algorithm model we used t test through which the average of prediction of neural network model was equal to %91.2 but in genetic algorithm model it was equal to %86.5. Thus, it can be observed that the difference between the precision of prediction between these two models has been %4.7. On the other hand in the presence of inequalities in variances, this difference has become meaningful in %0.05 level. Therefore, in the present research we can state that neural network model has been more conservative in predicting bankruptcy of firms enlisted in Tehran Stock Exchange than genetic algorithm model. Thus, the third research hypothesis claiming that artificial neural network model is more conservative than genetic algorithm model in bankruptcy prediction is approved.
CONCULSION
Due to economic conditions, the number of bankrupted companies and the importance of bankruptcy are increasing. Even auditors who have a good knowledge about financial status of companies are not able to make correct judgments about the continuation of a company's activities. This has resulted in most investors turning to other markets such as coin and foreign currency instead of investing in firms accepted in Stock Exchange and the main reason to do that is their lack of confidence and their concerns about these companies being bankrupted. The main goal of this research is to determine the efficiency of artificial neural network and genetic algorithm models which are different representations of artificial intelligence. In studying bankruptcy of firms accepted in Tehran Stock Exchange and comparing these two models we tried to identify which of them is more efficient and more conservative. In studying about first hypothesis we used front feeder neural network model. Results showed that neural network has had a precision of %91.2 in prediction.
160
Third hypothesis in this research claimed that artificial neural network model is more conservative than genetic algorithm model in predicting bankruptcy of firms accepted in Tehran Stock Exchange. Research results showed that neural network model's average prediction was equal to %91.2 but it was equal to %86.5 in using genetic algorithm model. In the present research it can be stated that neural network model has been more conservative than genetic algorithm model in predicting bankruptcy of firms accepted in Tehran Stock Exchange.
Suggestions based on research results (applied)
Regarding results of this research and the importance of the issue we can pose following suggestions:
A) Regarding prediction capability of neural network and also genetic algorithm we suggest investors, analysts and other actors in capital market to use these two models in bankruptcy prediction in firms accepted in Stock Exchange in order to make more efficient decisions.
B) It is suggested for managers in companies to use the two models of neural network and genetic algorithm to study the financial status of their companies and if they are exposed to bankruptcy carry out the required actions to avoid this happen.
C) It is suggested to Stock Exchange Organization to use the models used in this research due to their high capabilities in prediction to study and assess financial status of firms in Stock Exchange and also candidate firms to enter Tehran Stock Exchange.
Suggestions for future researches
Some topics can be suggested to investigate in future related researches as follows:
A) The repetition of this research about non-bourse companies and comparing the results with results of the present research
B) Doing the present research for a longer time period in order to increase reliability of results C) Using models based on artificial intelligence in order to predict firms' bankruptcy
D) Using neural network and genetic algorithm models in order to predict auditor's opinion expression type and …
REFERENCES
Altman EL, Financail R. 1968. Disarmament Analysis and the prediction of corporate Bankruptcy, the Journal of finance 1968; 23: 598- 609.
Beaver WH. 1966. financial ratios as predictors of failure, Journal of Accounting research.
Etemadi H, Farajzadeh-e-Dehkordi H. 2008. A review of bankruptcy prediction models (Journal of Accountant), No. 200, 39-56. Firouzian M, Javid D, Najmoldini N. 2011. The function of genetic algorithm in bankruptcy prediction by Altman in firms ccepted
in Tehran Stock Exchange. Journal of Accounting and Auditing studies, No. 65, 99-114.
Hafeznia M. 2003. An introduction into research method in Humanities. 8th edition, Tehran, SAMT Publications.
Nikbakht M. 2010. Financial bankruptcy prediction in firms accepted in Tehran Stock Exchange by using artificial neural networks. (Industrial management). No. 4, 163-180.
Min SH, Lee J, Han I. 2006. Hybrid genetic algorithms and support vector machines for bankruptcy prediction, Expert systems with applications. 31: 652-660
Moradi-e-Joz M. 2011. Locating parking lots optimally in distribution network regarding multiple goal target functions from the perspective of investors. M.Sc. Dissertation in Electricity, Tarbiat Modarres University.
Odom M and Sharda R. 1990. A Neural Network Model for Bankruptcy Prediction. Proceedings of the IEEE International Conference on Neural Networks II
Raee R, Fallahpour S. 2008. The application of support vector machine in predicting financial vulnerability of companies by using financial ratios. Quarterly Journal of Accounting and Auditing studies, No. 53, 17-35.
Shah JR, Murtaza MB. 2002. A neural network based clustering in bankruptcy prediction modeling, Expert Systems with Application. 23(3): 321-328.
Shin K, Lee Y. 2002. A Genetic Algorithm Application in Bankruptcy prediction modeling, Expert systems with application. 1-8. Tam KY and Kiang MY. 1992. Managerial Applications of Neural Networks: The Case of Bank Failure Predictions, Management
Science, 38:926-947, 1992.