3(2): 1-13, 2019; Article no.JENRR.49959 ISSN: 2581-8368
Influence of External Parameters on the Dynamic
Behavior of Resource-economic-pollution System
Jiuli Yin
1, Jing Huang
1and Xinghua Fan
1∗1Faulty of Science, Jiangsu University, Zhenjiang, Jiangsu 212013, China.
Author’s contributions
This work was carried out in collaboration among all authors. All authors read and approved the final manuscript.
Article Information
DOI: 10.9734/JENRR/2019/v3i230092
Editor(s):
(1) Dr. Ewa Kowalska, Associate Professor, Plasmonic Photocatalysis in Institute for Catalysis, Hokkaido University, Japan.
Reviewers:
(1) Yuanbin YU, Jilin University, China. (2) Hardiansyah, Tanjungpura University, Indonesia. (3) Prabha R., KVAFSU, India. Complete Peer review History: http://www.sdiarticle3.com/review-history/49959
Received: 25 April 2019 Accepted: 03 July 2019
Original Research Article
Published: 09 July 2019Abstract
This paper discusses a new type of selective-constrained resource-economic-pollution (REP) system. Based on the nonlinear dynamics theory, the dynamic behavior of the new system is discussed. The genetic algorithm is used to identify the quantitative coefficients of the actual system.
This paper further analyses the impact of state regulation, economic marketization management and green lifestyle on economic growth. Taking the actual situation into consideration in China, the empirical research is carried out by adjusting the parameters of the actual system. The dynamic evolution of real economic growth is observed which predicts future trends more realistically. The research shows that the introduction of state regulation into the REP system can promote economic growth quickly at a small rate in the short term. However, state regulation has little effect on economic growth in the long run. The impact of economic marketization management on the economy is moderate. A short-term, small-scale green lifestyle has little impact on system and economic growth because of China’s large population base.
Keywords: Selective constrained resource-economic-pollution; state regulation; economic marketization management; green lifestyle; economic growth.
1
INTRODUCTION
Economic growth usually refers to a sustained increase in a country’s per capita output (or per capita income) over a long period of time. The level of economic growth rate reflects the growth rate of a country or region’s economic aggregate in a certain period of time, and is also a measure of the growth rate of a country or region’s overall economic strength [1]. Daniel et al explored the relationship between economic growth and environmental pollution in EU-28 countries. The results confirm the EKC hypothesis. EKC is the most famous theory about the relationship between economic growth and environmental quality, which refers to an inverted U-shaped relationship between economic output per capita and some measures of environmental quality [2].
A large number of researchers discuss factors related to economic growth [3, 4]. Different countries have different factors that affect economic development. In Pakistan, the agricultural sector is the backbone of the economy. Pakistan earned a handsome amount through exports of agricultural raw material and refined products [5]. In developing countries such as Qatar, energy conservation policies will have adverse effects on economic growth, and therefore alternative means must be undertaken to promote economic growth without damaging the environment [6]. In a report, the World Bank (2011) argues that, in developing countries, the joint effects of Information and Communications Technology (ICT) is the biggest driving force behind econo-mic growth, serving as an engine of job creation, particularly among youth and women, and has also promoted trade and competitiveness through exports [7].
Since the reform and opening up, Chinese economy has been growing exponentially. However, it also faces many practical problems, resource savings and environmental protection etc. China’s economic growth primarily depends on labor-intensive and energy-intensive production activities, mainly supported by a cheap labor force, natural resources, and natural
environment [8]. For example, water shortages are one of the biggest challenges facing many countries, especially China’s urban development. One study developed a water decoupling model and a water environment decoupling model to better understand the decoupling between urban economic growth and water use to promote economic growth without increasing water consumption [9]. Nevertheless, the element affecting econo-mic growth is complicated and versatile in modern society. There may be other factors, such as state regulation, economic marketization management and green lifestyles et al.
In addition, the researchers used the theory of nonlinear dynamic systems [10, 11] to describe the relationship between resource, economic growth and pollution, and proposed a new three-dimensional REP chaotic system [12, 13], which shows that small changes in economic growth may cause catastrophic environmental damage through the use of The empirical data identifies system parameters to discover the folding relationship. Zhi-Nan Lu et al. studied the dynamic relationship between environmental quality, economic development and public health in China by establishing a simultaneous equation [14]. The impact of environmental pollution on public health and the economy was verified. A green lifestyle should be planned to promote a healthy life while the economy has also developed very well.
Fang et al. analysed a novel type of
a specific inhibitory effect on economic growth. The low-carbon lifestyle does not affect economic growth while controlling energy intensity.
The actual REP system should be a complex system that includes many variables and corresponding constraint conditions. This study introduces state regulation, economic marketization management and green lifestyle into the resource-economic-pollution (REP) system [12] as constraint conditions. In developing countries, state regulation is not merely an issue of the technical design of the most appropriate regulatory instruments, it is also concerned with the quality of supporting regulatory institutions [17] and capacity [18, 11]. An effective regulatory system can promote economic growth and development. Economic marketization management is the impact of the market on the economy according to price changes, which is an essential factor to economic growth [19]. Green lifestyle refers to a natural, environmentally friendly, frugal and healthy lifestyle, based on green growth, sharing and co-construction. The green lifestyle is a factor that needs to be highly valued by the current society [20, 21, 22], which can fundamentally reduce pollution, save resources, and promote long-term economic development in the long run.
Compared to the existing literature, the novelty of this study is primarily reflected in two aspects. (1) This study firstly introduces state regulation, economic marketization management and green lifestyle into the Resource Economic Pollution System (REP) system as constraint conditions by using the nonlinear dynamical system approach. (2) The genetic algorithm is used instead of the artificial neural network to obtain the actual parameters. This method calculates the whole of the three equations with a smaller error. The selective-constrained REP system is more reflective of the actual situation and more realistically predicts future trends.
The outline of this paper is organised as follows. Section 2 provides the establishment of this model. Section 3 is the dynamic analysis of the model. Section 4 identifies actual system parameters based on Chinese statistical data and scenario analysis of economic growth by
constraints. The conclusions and outlook are finally presented in Section 5.
2
ESTABLISHMENT OF THE
MODEL
The Resource-Economy-Pollution dynamical system (REP) includes resource, economic growth and pollution and many other variables. Each variable in the actual REP system has many restriction conditions. The total resource consumed in a region during a given period has much to do with state regulation. Market economy control will affect the economy scale to a large degree, while green lifestyle will have certain impacts on pollution. In the three-dimensional REP system [12], it is assumed that REP, resource, economic growth and pollution are restrained by state regulation, market economy control, green lifestyle incentives respectively. The corresponding restriction conditi-ons are assumed to be F1(x, y, z, t),
F2(x, y, z, t) and F3(x, y, z, t). The
selective-constrained REP system can be described by the following differential equations:
dx
dt =a1x+a2y−a3yz+F1(x, y, z, t) (2.1a) dy
dt =b1x(1− x
M)−b2y−b3z+F2(x, y, z, t)
(2.1b)
dz
dt =c1xy−c2z+F3(x, y, z, t) (2.1c)
where x(t) is the total resource consumed in a region during a given period, y(t), of economy scale, z(t), of pollution [12]. ai, bi, ci, (i=1,...,3) are positive system parameters, and M represents the maximum value of resource consumption.
of waste can be recycled, it can save resources and reduce consumption. So we obtain the third term−a3yz. F1(x, y, z, t)is the time-dependent
variable of state regulation. It has an outstanding effect on controlling x(t); thus the restriction of
F1(x, y, z, t) fromx(t) is simplified as the direct
restriction−a4x.
The second formula in Eq.2.1 Refers to the complex relationship between the economic rate of change the complex relationship between the rate of change of economy scaledy/dt, resource consum-ption and pollution. The rate of change in economic scale is related to both resource consumption x(t) and the potential share of resources(1−x/M), directly proportional to their products. When there are enough resources, i.e., x < M and 1 − x/M > 0, the economy develops very fast. However, when the resource consumption is insufficient, the resource consumption is inversely proportional to the rate, i.e., x > M and 1−x/M < 0. The addition of the economy offsets the pace of change. So dy/dt is inversely proportional to ey(t). The more serious the pollution, the slower the economic development. Therefore
dy/dt is inversely proportional to pollution z(t).
F2(x, y, z, t) = b′4(z−x)·(d/1−(1−d)−t) is
the time-dependent variable of market economy control. b′4 is the adjustment coefficient of
F2(x, y, z, t); d is an effective discount rate. t
is an economic market regulation period. The effective discount rate refers to the ratio of the future limited period expected income to the present value, which is the effective rate of return under certain conditions. The development of
y(t)is restrained byF2(x, y, z, t). The intensity of
F2(x, y, z, t)is decided by the selection between
z(t)andx(t), the value oftandd.
Formula.2.1c in Eq.2.1 indicates that the rate of pollution dz/dt. Resource consumption x(t)
and economic scale y(t) affect pollution , and is positively proportionalc1xy. The environment
can slow down the pollution by its functions such as pollution filtering, waste sink, and waste decomposition. Therefore we get the −c2z.
F3(x, y, z, t) = c3(y−x) is the time-dependent
variable of green lifestyle. c3 is the incentive
coefficient. The impact of F3(x, y, z, t) on z(t)
depends on the change ofy(t)andx(t).
Eq.2.1 can be written as follows:
dx
dt =a1x+a2y−a3yz−a4x (2.2a)
dy
dt =b1x(1− x
M)−b2y−b3z+b ′
4(z−x)·(d/1−(1−d)−
t
) (2.2b)
dz
dt =c1xy−c2z+c3(y−x) (2.2c)
Letb′4(z−x)·(d/1−(1−d)−t) =b4(z−x). Then Eq.2.2 can be simplified as:
dx
dt =a1x+a2y−a3yz−a4x (2.3a)
dy
dt =b1x(1− x
M)−b2y−b3z+b4(z−x) (2.3b)
dz
dt =c1xy−c2z+c3(y−x) (2.3c)
3
DYNAMIC ANALYSIS OF THE MODEL
Table 1: Parameters of Eq.2.3
Parameter a1 a2 a3 a4 b1 b2
Value 0.065 0.035 0.065 0.04 0.5 0.088
Parameter b3 b4 c1 c2 c3 M
Value 0.06 0.06 0.468 0.06 0.001 10
It is not difficult to find that this system has 5 balance points. And we find that although the number of equilibrium points varies with the parameters, there is always a balance pointS(0,0,0,0). Then we calculate the Jacobian matrix of the Eq.2.3 at an equilibriumS(x, y, z, w)is :
J=
b1−ba41−−2ba41x/M a2−−ba23z b−4a−3yb3
c1y−c3 c1x+c3 −c2
. (3.1)
The characteristic polynomial ofJat the equilibrium pointS(0,0,0,0)is :
f(λ) =|J−Iλ|=λ3+pλ2+qλ+r, (3.2) whereIis the three-order unit matrix.
p=−a1+a4+b2+c2
q=−a1b2−a1c2−a2b1+a2b4+a4b2+a4c2+b2c2+b3c3−b4c3
r=−a1b2c2−a1b3c3+a1b4c3−a2b1c2−a2b3c3+a2b4c3+a4b3c3−a4b4c3
In fact, the dynamic system presented in Eq.2.3 will have chaotic attractor and the corresponding dynamic evolution behavior when the system has another group of parameters. We find this group of parameters in the research. Based on the data in the system, the parameters in Table.1 are obtained during the process of parameter identification. These parameters reflect the properties of the system itself, rather than a simple dynamic behavior. From this viewpoint, the parameters Table.1 make the system closer to the actual one, being more convincing.
By the Routh-Hurwitz criterion, all real eigenvalues and all real parts of complex conjugate eigenvalues of Eq.3.2 are negative if and only if the following conditions hold: p1 >0,
p3 > 0, andp1p2 −p3 > 0. For some certain
parameters, Eq.3.2 has unstable saddle-focus points.
Divergence places an important role in the
chaotic system. When there is unstable saddle-focus points, the restrained three-dimensional dynamic system presented in Eq.2.3 may be chaotic if the divergence is negative. Then we calculate the divergence of this three-dimensional dynamic system as follows:
∇V =a1−a4−b2−c2<0. (3.3)
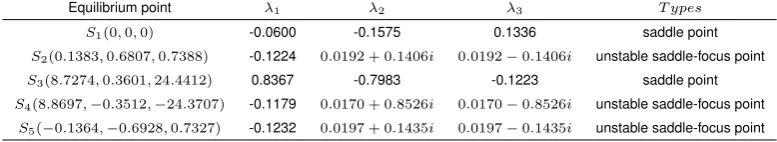
We find a possible parameter set leading to chaos as shown in Table.1. Based on the parameters in Table.1, we have the equilibrium points and their corresponding eigenvalues as shown in Table.2. The different dynamic behaviors of the system are also presented.
When the parameters of Eq.2.3 are given in Table.1 and initials are given[0.196,0.36,0.88], a chaotic attractor could be observed as shown in Fig. 1. The corresponding time series of x(t),
Fig. 1. The 3D view of the selective constrained REP system. x:the total resource consumed y:the gross domestic product z:the pollution variable
Table 2:
Equilibrium points and their corresponding eigenvalues of Eq.2.3Equilibrium point λ1 λ2 λ3 T ypes
S1(0,0,0) -0.0600 -0.1575 0.1336 saddle point
S2(0.1383,0.6807,0.7388) -0.1224 0.0192 + 0.1406i 0.0192−0.1406i unstable saddle-focus point
S3(8.7274,0.3601,24.4412) 0.8367 -0.7983 -0.1223 saddle point
S4(8.8697,−0.3512,−24.3707) -0.1179 0.0170 + 0.8526i 0.0170−0.8526i unstable saddle-focus point
S5(−0.1364,−0.6928,0.7327) -0.1232 0.0197 + 0.1435i 0.0197−0.1435i unstable saddle-focus point
Table 3:
Data ofx(t),y(t),z(t).Year x(t) y(t) z(t)
2007 313339.01 270232.30 2946.94
2008 321114.08 319515.50 2741.00
2009 331735.48 349081.40 2620.57
2010 357653.50 413030.30 2547.55
2011 377788.09 489300.60 3269.37
2012 392657.49 540367.40 3216.01
2013 402345.73 595244.40 3032.43
2014 404956.82 643974.00 2933.81
2015 406362.60 689052.10 2828.04
2016 410478.40 744127.20 1502.52
4
SCENARIO ANALYSIS
4.1
Statistical Data and
Prelimi-nary Process
We have obtained the actual data by the China Statistical Yearbook (2007-2016). All data is standardized asx(i) = (x(i)−¯x)/σ, wherex¯and
σrepresent the mean and the standard deviation ofx(i)respectively.
We choose the data of coal, oil, natural gas, and water resources as resources data,
x(t) are the linear sum of coal, oil, natural gas, and water resources. y(t) (GDP) is the data of GDP. The amount of waste water emissions, waste gas emissions, and industrial solid waste emissions as environmental data indicators. Because waste water and exhaust are difficult to be stored, emissions are adopted. Since tremendous amount of solid waste is stored instead of being discharged, production is employed. Considering China is a large developing economy, we use industrial waste water emissions, industrial exhaust emissions, and industrial solid waste production as indictors
that influence the comprehensive evaluation variables of environmental quality. We put industrial waste water emissions asz1, industrial
exhaust emissions as z2, industrial solid waste
production as z3. Analytic hierarchy process
is used to acquire z = 0.5788z1 + 0.8059z2 +
0.1247z3. Then we sort the data ofx(t),y(t),z(t)
as shown in Table.3.
4.2
Parameter Identification
Table 4:
Parameters of actual systemParameter a1 a2 a3 a4 b1 b2
Value 0.0741 0.3939 0.0051 0.2207 0.0013 0.3784
Parameter b3 b4 c1 c2 c3 M
Value 0.0997 0.2681 0.2623 0.1386 0.5989 0.9011
xk+1=xk+T(a1xk+a2yk−a3ykzk−a4xk)
yk+1=yk+T(b1xk(1−xk
/M)−b2yk−b3zk+b4(zk−xk))
zk+1=zk+T(c1xkyk−c2zk+c3(yk−xk)) (4.1)
Select the previousn−1sets of data as the input data, and the latter n−1 sets of data as the output data. The input and output variables are normalized inx(i) = (x(i)−x)/σ¯ . Let crossover
rate be 0.85, mutation rate is 0.06, and all the adjustable parameters be random. Comparing the data with output target and the error e is obtained and stopping the iteration procedure when e reaches 10−6, the parameters of the actual system are obtained as shown in Table.4.
Choose the parameters of Eq.2.3 shown in Table.4, select the data [0.196,0.36,0.88] as the initial condition, and Obtain the actual phase diagram and time series diagram as shown in Fig.3, it can be seen that the actual system is steady state development, which is consistent with the actual situation.
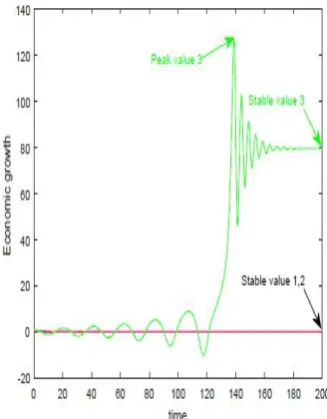
Fig. 4. The evolution tendency of economic growth whena4changes. base case:
a4= 0.4207 strong case 1:a4= 0.5207 strong case 2:a4= 0.9207
4.3
The
Impact
of
State
Regulation
on
Economic
Growth
Each parameter has its practical meaning in a selectively constrained REP system. Changing the value of each parameter indicates the evolution between the corresponding variables, which will lead to very complex dynamic behavior of the entire system. a4 represents the national
regulation coefficient, and Fig.3 shows the impact on economic growth when a4 changes. Stable
value 1 (referred to as curve 1) corresponds to the influence curve of a4 = 0.2207, Stable
value 2 (referred to as curve 2) corresponds to the influence curve of a4 = 0.5207, and Stable
value 3 (referred to as curve 3) corresponds to
a4 = 0.9207. Comparing and observing the
three curves, it is found that whena4is gradually
increased, the impact on the economy begins to be relatively large, which is reflected in Fig.3, that is, the difference between the peak value and the stable value is relatively large. However, with the evolution of the system, the impact on the economy tends to be stable, and the value after stabilization is above the zero-tick line, that is, it is always greater than zero, which promotes the economy; Curve 2 has been greater than zero
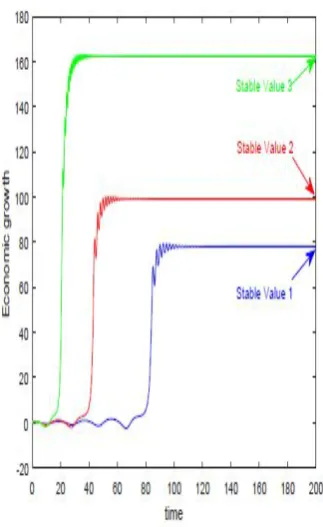
Fig. 5. The evolution tendency of economic growth whenb4changes. base case:
b4= 0.2681 strong case 1:b4= 0.5681 strong case 2:b4= 0.8681
4.4
The
Impact
of
Economic
Marketization
Management
on Economic Growth
b4 is the economic marketization management
coefficient. In the constraint conditions
F2(x, y, z, t) = b4(z −x), attention should be
paid to the influence of the state’s regulation of such rigid administrative meansb4on the current
market-oriented economy. Fig.3 shows the change in the corresponding economic growth when b4 changes. Stable value 1 (referred to as curve 1) corresponds to economic growth whenb4 = 0.2681, stable value 2 (referred to as
curve 2) corresponds to economic growth atb4=
0.5681, stable value 3 (referred to as curve 3) corresponds to economic growth atb4= 0.68681
economic growth. Comparing the three curves, it is found that when b4 gradually becomes
larger, the initial stage of the economic growth
Fig. 6. The evolution tendency of economic growth whenc3changes. base case:
c3= 0.1989 strong case 1:c3= 0.5989 strong case 2:c3= 0.9989
4.5
The Impact of Green Lifestyle
on Economic Growth
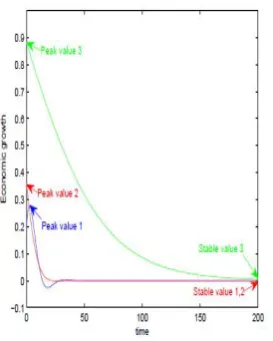
c3 is the adjustment factor for the green lifestyle,
and Fig.3 shows the impact on economic growth when c3 changes. Stable value 1 (referred
to as curve 1) corresponds to the influence curve of c3 = 0.1989, Stable value 2 (referred
to as curve 2) corresponds to the influence curve of c3 = 0.5989, and Stable value 3
(referred to as curve 3) corresponds to
c3 = 0.9989. Comparative observation
of the three curves found that when
c3 changes gradually, in a small range, there
is no obvious effect on promoting economic growth. Whenc3increased to 0.9989, due to the
regulation of the state and the adjustment of the economic market, the economy first fluctuated and grew steadily. The impact on the economy is obvious. The above analysis shows that short-term, small-scale green lifestyles have little impact on system and economic growth, and even unfavorable situations. Because the country has a large population base and increased regulation of green travel, it may help economic
growth, energy conservation and environmental protection. However, this will also cause shocks to the social economy, in that too much green travel may lead to lower efficiency in all aspects. Therefore, we must choose the right coefficient to promote economic growth, so that the economy does not produce too much shock. We need to understand it correctly. The more people choose green lifestyles and reduce pollution, our living environment will be even better, the goal of promoting stable economic growth will be easier to achieve.
5
CONCLUSIONS
constrained REP dynamic evolution system is more realistic and easier to control.
The results of the scenario analysis show that in the early stage, due to the lack of sound resources protection and other systems, the economic growth is volatile, and the state regulation is introduced into the REP system. The state allocates resources rationally, reduces pollution and waste, and finally promotes stable economic growth, that is, the decisive factor for promoting steady economic growth is state regulation. Economic marketization management has a great impact on China’s current REP system and is an important factor in promoting economic growth. The short-term green lifestyle has little effect on the system and economic growth, and even has an unfavorable situation. We need to understand it correctly and continue to practice the concept of green lifestyle in practice. Through the above analysis, today’s social pollution is getting more and more serious. The selective binding REP system provides a good solution for reducing pollution and green development. When resources are scarce and pollution is severe, the implementation of urgent green lifestyle and then control the government and adjust the economic market appropriately. The actual REP system is related to China’s national conditions, economic and cultural background. The results of the theoretical analysis of data may be slightly different from the real situation.
ACKNOWLEDGMENT
Research is supported by the National
Natural Science Foundation of China [No. 71673116, 71690242 and 51876081], Natural Science Foundation of Jiangsu Province [No. SBK2015021674], and the Humanistic and Social Science Foundation from Ministry of Education of China [No. 16YJAZH007].
COMPETING INTERESTS
Authors have declared that no competing interests exist.
References
[1] Schou P. Polluting non-renewable resources and growth. Environmental and Resource Economics. 2000;16(2):211-227.
[2] Bo S. A literature survey on environmental
kuznets curve. Sciencedirect.
2011;5:13221325.
[3] Alain D, Ayong LK. Sustainable growth, renewable resources and pollution. Journal
of Economic Dynamics and Control.
2001;25(12):1911-1918.
[4] Sakamoto T, Managi S. Optimal economic growth and energy policy: analysis of nonrenewable and renewable energy. Environmental Economics and Policy Studies. 2016;18(1):1-19.
[5] Khalid M, Shehla M. Agricultural exports and economic growth in pakistan: An econometric reassessment. Quality & Quantity. 2017;52(4):1561-1574.
[6] Charfeddine L, Afnan Yousef AM, Kholoud AK. Is it possible to improve environmental quality without reducing economic growth:
Evidence from the qatar economy.
Renewable and Sustainable Energy
Reviews. 2018;82:25-39.
[7] Das A, Chowdhury M, Seaborn S. Ict diffusion, financial development and economic growth: New evidence from low and lower middle-income countries. Journal of the Knowledge Economy. 2018;9(3):928-947.
[8] Malin S, Jun P, Jianlin W, Jiajia Z. Environmental efficiency and economic growth of china: A ray slack-based model analysis. European Journal of Operational Research 2018;269:51-63.
[9] Qiang W, Rui J, Rongrong Li. Decoupling analysis of economic growth from water use in city: A case study of beijing, shanghai, and guangzhou of china. Sustainable Cities and Society. 2018;41:86-94.
[10] Mei S, Xiaofang W, Ying C, and Lixin
T. Energy resources demand-supply
system analysis and empirical research based on non-linear approach. Energy. 2011;36(9):5460-5465.
pricesnergy supplyconomic growth dynamic system. Applied Energy. 2015;155:526-546. [12] Jiuli Y, Xinghua F, Huihui X. Chaotic
behaviour in a
resource-economy-pollution dynamic system. Journal of MultidisciplinaryEngineering Science and Technology. 2017;4:2458.
[13] Zhanwen D, Lixin T, Honglin Y. Equilibrium path in oligopolistic market of nonrenewable resource. Nonlinear Analysis: Real World Applications. 2008;9(5):1918-1927.
[14] Zhi-Nan Lu, Heyin C, Yu H, Jingyi W, Xiaojie S, Toi Meng M. The dynamic relationship between environmental pollution, economic development and public health: Evidence from china. Journal of Cleaner Production. 2017;166:134-147.
[15] Guochang F, Lixin T, Mei S, Min F. Analysis and application of a novel three-dimensional energy-saving and mission-reduction
dynamic evolution system. Energy.
2012;40(1):291-299.
[16] Guochang F, Lixin T, Min F, Mei S.
Government control or low carbon
lifestyle? analysis and application of a novel selective-constrained energy-saving
and emission-reduction dynamic evolution system. Energy Policy. 2014;68:498-507. [17] Yanqing J. Springer Berlin Heidelberg,
Berlin, Heidelberg. Environmental Quality and ”Green” Economic Growth in the Chinese Regions. 2014;pages 245-259. [18] Hossein J, Colin K, David P. The impact
of regulation on economic growth
in developing countries: A
cross-country analysis. World Development. 2007;35(1):87-103.
[19] Van Son L, Xiaoxia Y, Lu Z. Are market views on banking industry useful for forecasting economic growth? Pacific-Basin Finance Journal; 2018.
[20] Ingrid O, Susanne S. Green attitude and economic growth. Environmental and Resource Economics. 2018;70(4):757-779. [21] Kurt AH, David MF. Fertility, economic
growth, and human development causal determinants of the developed lifestyle. Journal of Macroeconomics. 2013;38:107-120.
[22] Anthony J. M, Thomas F. W. Economic growth, lifestyle preferences, and urban size. Urban Ecology. 1977;2(3):259-278.
————————————————————————————————————————————————– c
⃝2019 Yin et al.; This is an Open Access article distributed under the terms of the Creative Commons Attribution License (http://creativecommons.org/licenses/by/4.0), which permits unrestricted use, distribution, and reproduction in any medium, provided the original work is properly cited.
Peer-review history: