ISSN: 2231-5381
http://www.ijettjournal.org
Page 2800Composite Pseudocoloring Scheme Using Spiral
Method with Ensuring Same Brightness
Rajbahadur Singh Raghuvanshi
Electronics and Communication Engineering. S.A.T.I (Engg. College), Vidisha ,(M.P.) India
Ashutosh Datar
Biomedical Engineering.
S.A.T.I (Engg. College) , Vidisha ,(M.P.) India
Abstract—This paper develops a method for automatic colorization of images (or two-dimensional fields presented as images), in order to clearly visualize the intensity level. Medical images like X-ray, CT scan, MRI and Ultrasound images are generally gray images. In these type of applications, brightness level are very important for good diagnosis. In generally used pseudocoloring methods intensity information is lost due to simple to one transform. Hence a parametric path in RGB color cube is introduced for preserving the brightness level. The obtained spiral can provide a number of color spectra by altering its parameters. in pseudocored image. This method can also applied on images of higher number of bits. Here this technique is taken as the tool for enhancing the gray medical images. A hybrid scheme is also applied in which a specific window of gray image is psudocolored with a color spectra other than the applied on remaining image. Human beings can only discern a few dozen gray level values while they can distinguish thousands of colors, the use of color for human interpretation could only improve the diagnosis process. It can produce an image in different color spectras for visualising the medical image clearly and effectively highlight the disease areas, which results in better diagnosis.
Keywords—brightness; visualisation; medical images; pseudocolor coding.
I. INTRODUCTION
The purpose of pseudocoloring techniques is to enhance a monochrome image for human viewing purposes. In gray images variations of gray levels may very often mask or hide regions of interest. Since the human eye is capable of discerning thousands of colors and intensities, compared to only about 40 shades of gray[1], replacing gray levels with colors render better visualization and enhanced capability for detecting relevant details within the image. The typical solution consists of using a color lookup table (LUT) designed to map the entire range of (typically 256) gray levels to a (usually much smaller) number of colors. For better results, contrasting colors should appear in consecutive rows in the LUT. The term pseudocolor is used to emphasize the fact that the assigned colors usually have no correspondence whatsoever with the truecolors that might have been present in the original image.of gray scale images is a typical process. Complimentary color coding [2] and gray to color transformation methods are included. Other methods from articles include pseudocoloring of high gray resolution image [3], Peudocoloring based on perceptual color space [4], low contrast image enhancement based on wavelet and
pseudocolor processing [5]. There are various type of pseudocoloring technique present in literature[7]. These pseudocoloring techniques can improve the perceptual information of a gray image upto a great extent. Color provides sufficient part of visual information to us and improves the ability of object detection. Pseudocoloring is a general technique for converting grey scale image, in which color information does not exists, into a colored one. It enhances the details of image, so that more useful information can be extracted. The problem of pseudocoloring gray images has no inherently perfect solution as Since different colors may have the same luminance value but vary in hue or saturation, [8]. An image enhancement technique also introduced to enhance the detectability of detail within the image [9].
II. HUMAN COLOR PERCEPTION AND RGB COLOR MODEL
A. Human color perception can be explained by categorizing 1it in two ways:
1. Physiological Processing of Color - Different wavelengths of light require different focal lengths, and for various pure hues, the lens must change its shape so that the light is kept focused correctly. Chromostereopsis is the appearance of pure colors located at the same distance from the eye but appearing to be at different distances; e.g., reds appear closer, and blues more distant.
ISSN: 2231-5381
http://www.ijettjournal.org
Page 2801intuitive consistency in a design. If the color of a kind of item is known ahead of time, or if a color only applies to a particular type of item, the search time for finding an item decreases. Color can be described more meaningfully in terms of the perceptual dimensions of lightness, hue, and colorfulness than in terms of the measured dimensions.
B. RGB color model
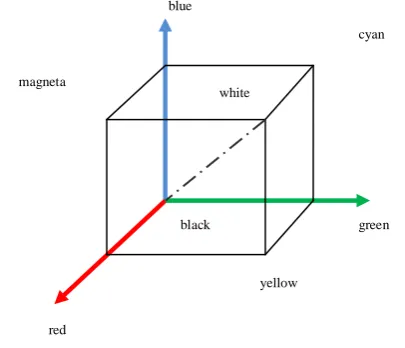
A color model is an abstract mathematical model describing the way colors can be represented as tuples of numbers, typically as three or four values or color components (e.g. RGB , HSI and CMYK are color models). The ―classical‖ Computer Color space 3 different colors: Red, Green, Blue, similar to the human visual system. If R,G,B have the same energy, we perceive a shade of gray In Fig. (1), RGB values are at three corners; cyan, magenta, and yellow are at three other corners; black is at the origin; as shown. In this model, the gray scale extends from black to white along the line joining these two points.
Fig. 1 RGB color model
III.TRANSFORMS AND PSEUDOCOLORING
The basic technique for pseudocoloring is performed by directly applying a single color hue to replace a particular grayscale. Example, the color range from C0-255 can be used to
code the grayscale range I0-255. In another approach defining a
function P[], which maps the original grayscale data I(x,y) to the primary color values R(x,y), G(x, y), and B(x, y). This process can be represented as follows:
R(x, y) = PR [I(x, y)]
G(x, y) = PG [I(x, y)] (1)
B(x, y) = PB [I(x, y)]
where the transforms PR[], PG[] and PB[] could be either
linear or nonlinear functions, based on the desired output image. The complete color-coding process can be described as follows
Where I(x,y) is the gray value of pixel, PR[], PG[] and PB[] is
the color transform or mapping function to generate value for R,G, and B channel to yield color image C(x,y).
Pseudocolor image processing consists of assigning colors to gray values based on a specified criterion. The term ―pseudocolor‖ emphasizes that the colors were assigned artificially opposing to the true (real) colors. The principal use of pseudocolors is for human visualization and interpretation of gray scale details on an image or their sequence. The main objective of pseudocoloring is to obtain an ergonomic color representation of the data that can be easily recognized by a human with normal sight. A variety of mapping schemes can be used to achieve this task, and extensive interactive trials have to be performed to determine an optimum mapping for displaying a given set of data
A lot of pseudo-color mapping schemes are in practice. In medical images, it is important to preserve the relative intensity information between different regions. Hence applying these schemes directly to medical images may result in loss of diagnostically useful information[11]. In order to preserve the relative intensity between regions of gray image, a pseudo-color scheme is used. As shown in Fig. (1), the main diagonal of RGB-cube from Black to white represents the ascending gray values (intensities) of medical image. The gray levels are assigned R,G, and B value by a transformation curve in color space. The curve is equidistantly sampled to create as many points as the number of input gray levels in input image. The transformation curve follows a spiral like path along the diagonal of RGB-cube. This curve generates color values while maintaining constant brightness. In continuous three dimensional domain, parametric equation for a spiral like curve along the z-axis with parameter t is given by[11], [12]. ̅( ) ( ( ) ( ) ( ) ) ( ( ) ( ) ( ) ( ) ( ) ) ( )
Where φ stands for phase that define the direction and ω that is the frequency, defines the number of raotation of spiral around z axis. Function r(t) define the form of spiral and z(t) shows its progression. Using Eq. (3) as a tool for pseudo-coloring we have to map the z-axis along main diagonal of RGB color cube by using matrix M.
ISSN: 2231-5381
http://www.ijettjournal.org
Page 2802Here M, the rotation matrix is expressed in the following form
(
( ) ( ) ( ) ( )
)(5)
Where β determines the rotation angle and ax, ay and az the
cosines of solid angles between the rotation axis g and the coordinate axis x, y and z respectively.
√ and √
√ (6)
Applying eq.(6) into eq.(5) , the resulting expressin for M is
√ (
√ √ √ √
) ( )
after putting the value of M in eq. (3) we get the effective parametric equation given by[11],[6].
( ) √ (
√ √ √ √
) ( ( ) ( ) ( ) ( ) ( )
) ( )
Where 0 ≤ t ≤ 1. Color axis normalisation to 1 is done for simplification and RGB cube is scaled to 8 bits. With eq. starting color is define in terms of phase φ and color changing dynamics are controlled in form of frequency ω, r(t) is the distant between the spiral curve and main diagonal. The parametric functions r(t) and z(t) must keep the spiral compatible with RGB cube.
The distant function can be evaluated in two ways, piecewise linear function r1(t) and continuous function r2(t). Expression
for the same are as follows :
( ) √ {
( )
And
( ) √ ( ) (10)
z(t) is assumed linear and expressed as
( ) √ (11) The variation in parameters ω and φ produce many pseudocolor spectra.
Medical images can be pseudocolored from this approach very effectively. The effectiveness of this technique is further improved by applying the spiral compositely, means if anybody is interested to a percept particular portion of the image more accurately then for this requirement hybrid pseudocoloring with preserved brightness technique may be very helpful. The parametric spiral formed by eq.(8) is given by [6],[11].
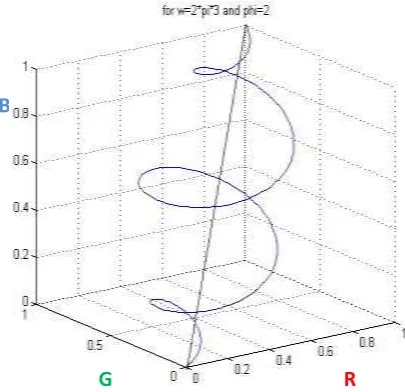
Fig. 2. Blue colour spiral produced by parametric equation with ω = 6π and φ = 2 traversing along the main diagonal of three diamentional RGB color cube shows preserved brightness.
IV.EXPERIMENTAL RESULTS
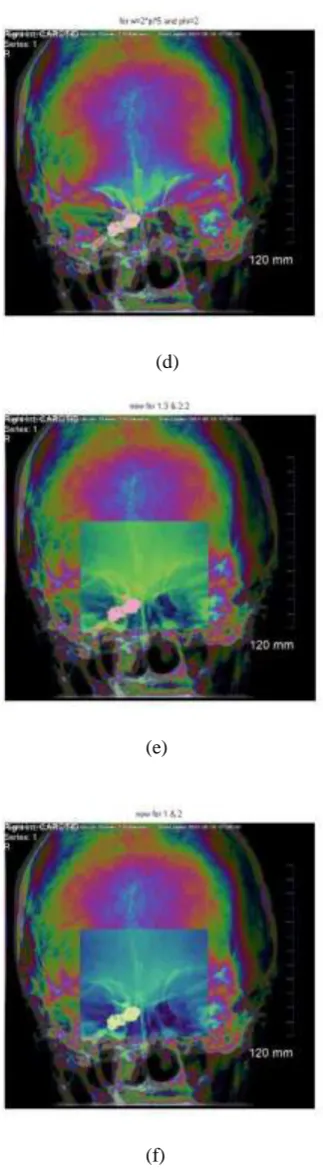
With the help of the proposed algorithms and the principle, we process Vestibular Schwannoma Image and MRI medical images, respectively. Fig. 2 is a Vestibular Schwannoma. image displays an ovoid filling defect inside the high signal intensity of the left IAC. The disease areas are detected in the bright areas. But they are blurry in original gray image because the entire image is very dark and the contrast of the image is very low, so these often cause misdiagnosis. Fig. 3 is another MRI image of occluding coil present in the right cavernous sinus is used and pseudocolored by using the expression of preserved brightness with composite color spectra also. The disease areas can easily be detected in pseudocolored images. We select a particular window in the gray image and apply the pseudocoloring process with two different color spectra, the particular window is pseudocolored with the color spectra other than the applied for remaining image and there is a number of spectra can be produced by altering the parameters used. The pseudocolored images ensures the preserved brightness level and with the availability of parameters ω and φ the same image and selected window can be pseudocolored with a large number of color spectra which can provide sufficient information for diagnosing the image in more effective manner.
R G
ISSN: 2231-5381
http://www.ijettjournal.org
Page 2803(a) (b)
(c) (d)
(e) (f)
Fig. 3. Vestibular Schwannoma. image displays an ovoid filling defect inside the high signal intensity of the left IAC (a) original image (b)pseudocolored with π and (c) pseudocolored with πand (d) pseudocolored with πand ecomposite pseudocoloring selected window is pseudocolored with πand and remaining images is pseudocolored with πand fcomposite pseudocoloring selected window is pseudocolored with πand and remaining images is pseudocolored with πand
.
(a)
(b)
ISSN: 2231-5381
http://www.ijettjournal.org
Page 2804(d)
(e)
(f)
Fig. 4 MRI image of occluding coil present in the right cavernous (a) original image (b) pseudocolored with π and (c) pseudocolored with πand (d) pseudocolored with πand ecomposite pseudocoloring selected window is pseudocolored with πand and remaining images is pseudocolored with πand
fcomposite pseudocoloring selected window is pseudocolored with πand and remaining images is pseudocolored with πand
We have also calculate some performance evaluation parameters like PSNR and MSE. For calculating these we convert the pseudocolored image into gray image and called it as recovered image. Peak Signal to Noise Ratio (PSNR) is calculated between the original image and the recovered image. It is measured to show the perceptual quality of the recovered image. Larger the PSNR value, more similar is recovered image to the original image. This image quality metric is outlined in decibels as:
PSNR = ( ) (12)
If the PSNR value is above 30dB then the perceptual quality is acceptable.
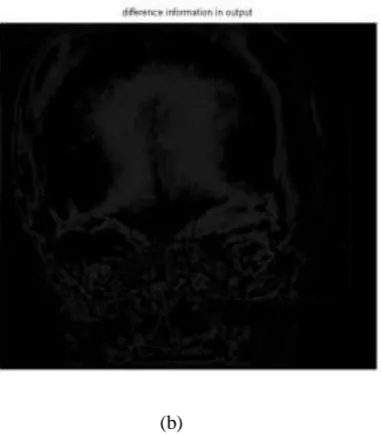
After subtracting the recovered image from original gray image we find the absolute difference image and calculate its maximum value and minimum value.
ISSN: 2231-5381
http://www.ijettjournal.org
Page 2805(b)
Fig. 5 (a)Recovered gray image of Fig,4(d) , (b) Image of absolute difference between original(Fig.4 (a)) and recorved gray image(a) with maximum value of 26 and MSE 5.6057..
We compute the effect of variation in parameters ω and φ on the recovered image and with the help of absolute difference we calculate the required evaluation parameters. We repeate these steps for the listed pseudocolored images in Table 1 which give the details of these parameters for different values of ω and φ.
TABLE.1. Effect of parameter ( ω and φ ) variation on evaluation parameters
Image ω φ Maxi. value pixel in difference
image
Average error per pixel
MSE PSNR (dB)
Fig.4 (d)
10π 2 26 5.605 63.3971 30.1101
Fig.4 (c)
6π 5 26 2.8734 35.4675 32.6325
Fig.4 (b)
6π 2 25 7.3713 81.0804 29.0416
Fig.3 (b)
6π 2 25 1.9418 17.6772 35.6567
V. CONCLUSION AND DISCUSSION
The composite spiral method for pseudocoloring ensures the pixel intensity preservation. In medical images generally largest information of disease perceived with respect to intensity level. After going through the experimental results,
it can be seen that the proposed scheme significantly provide sufficient information for diagnosing the image in more effective manner. By changing these parameters we get various pseudocolored images of same monochrome image. Hence the doctor can diagnose more accurately.
Further enhancement may be achieved by by considering the physiological color sensitivity of human vision system. The ARgYb color system introduced by Naiman[16] can be
applied through the spiral conversion.
REFERENCES
[1] R.C. Gonzalez and R.E. Woods, Digital Image Processing, New Delhi: Asea Pearson , 2002.
[2] Dai Jianbiao and Zhou Shaoxiang, ―Computer-aided pseudocolor coding of gray images: complementary color-coding technique,‖ Proc. SPIE. Electronic Imaging and Multimedia Systems. vol. 2889, pp. 181–191, September 1996. .
[3] Maoyong Cao and Daoyin Yu, ―Pseudo-color coding of high gray resolution image,‖ Optical Technique. BeiJing, vol. 28, pp. 19–21, March 2002.
[4] Maoyong Cao and Dao yin Yu, ―Pseudocolor coding of gray image based on perceptual color space,‖ Optical Technique. Beijing, vol. 28, pp. 79–80+83, July 2002..
[5] Daiying Zhang, Shaofang Pang, and Yuening Chen, ―Low-contrast image enhancement based on wavelet and pseudocolor processing,‖ Optical Technique. Beijing, vol. 30, pp. 104-106, May 2004
[6] Ashutosh Datar and Shilpa Datar ― Pseudocoloring of medical images using parametric equation with preserved brightness‖ Proceedings of NCBME2007, October 5-6, 2007
[7] B. Chanda and D.D. Majumder, Digital Image Processing and Analysis, New Delhi: PH India, p54, 2002.
[8] V. Karthikeyan, K. Duraiswamy, and P. Kamalakkannan, ―Conversion of gray-scale image to color image with and without texture synthesis‖, Intl. j. of Comp. Sc. And Network Security,vol.7, no.4, pp 11-16. April 2007.
[9] W.K. Pratt, Digital Image Processing, New York: Wiley, 2003. [10] B.R. Abidi, Y. Zheng, A.V. Gribok, and M.A. Abidi,‖ Improving
weapon detection in single energy X-ray images through pseudocoloring‖, IEEE Trans. Systems, Man and Cybernetics, vol. 36, no. 6, pp784-796, Nov. 2006..
[11] T.M. Lehmann, A. Kaser, and R. Repges, ―A simple parametric equation for pseudocoloring grey scale images keeping their original brightness progression.‖, Image and Vision computing, vol.15, pp251- 257, 1997. [12] J. McNames, ― An effective color scale for simultaneous color and
grayscale publications‖, IEEE Signal processing mag.,pp 82-87 Jan 2006.
[13] N. Saidin, U.K. Ngah, and M.Y. Mashor, ‖Ovarian ultrasound image enhancement by pseudocoloring‖.
[14] L. Jinxiu, L. Junli, and W. Ping, ―Pseudocolor coding of medical images based on gradient‖, pp 932-935, 2007.
[15] B. Chanda and D.D. Majumder, Digital Image Processing and Analysis, New Delhi: PH India, p54, 2002
[16] A. Naiman, color spaces and color contrast, The Visual Computer, 1(1985)194-201.