N e w D e v e lo p m e n ts
for
M osaic C C D s
A Thesis Submitted for the Degree
of
Doctor of Philosophy of the University of London
by
Wonyong Han
UCL
Optical Science Laboratory
D epartm ent of Physics and Astronomy
University College
ProQuest Number: 10105672
All rights reserved
INFORMATION TO ALL USERS
The quality of this reproduction is dependent upon the quality of the copy submitted.
In the unlikely event that the author did not send a complete manuscript and there are missing pages, these will be noted. Also, if material had to be removed,
a note will indicate the deletion.
uest.
ProQuest 10105672
Published by ProQuest LLC(2016). Copyright of the Dissertation is held by the Author.
All rights reserved.
This work is protected against unauthorized copying under Title 17, United States Code. Microform Edition © ProQuest LLC.
ProQuest LLC
789 East Eisenhower Parkway P.O. Box 1346
N ew D ev elo p m en ts for M osaic C C D s
A b stract
The imaging areaa of currently available optical detectors are relatively small to
cope with large image areas, such as telescope focal planes. One possibility to ob
tain large detection areas is to assemble mosaics of Charge Coupled Devices (CCDs),
and drive them simultaneously. Parallel driving of many CCDs together rules out
the possibility of individual tuning; however, such optim isation is very im portant,
when the ultim ate low light level performance is required, particularly for new, or
mixed devices. In this work, a new concept has been developed for an entirely novel
approach, where the drive waveforms are multiplexed and interleaved. This sim ulta
neously reduces the number of leadout connections and perm its individual optimi
sation efficiently. The controller has been designed to include one EPLD (Erasable
Programmable Logic Device) produced by a CAD software package, where most of
the digital circuits are integrated, to minimise the component count and improve
the efficiency of the system greatly. The system software has an open architecture
to perm it convenient modification by the user, to fit their specific purposes. The
design of controller allows great fiexibifity of system param eters by the software,
specifically for the compatibility to deal with any number of mixed CCDs, and in
any format, within the practical limit. The system has been integrated to test its
performance, and the result is discussed for the system noise, the linearity and the
cross-talk between the CCDs. The system developed in this work can be applicable,
not only for astronomical observation with a telescope, but also in other related
fields for low light level detection systems, such as spectroscopic application, remote
C o n ten ts
A b stra ct 2
1 In tro d u ctio n 12
1.1 Objectives and B a c k g r o u n d ...12
1.2 Instrum entation for Optical A stro n o m y ... 14
1.2.1 Photom etric In stru m e n ts... 15
1.2.2 Spectrometers and S p e c tro g ra p h s ... 18
1.2.3 Other I n s t r u m e n ts ... 21
1.3 Optical S e n s o r s ...22
1.3.1 Photographic E m u lsio n ...22
1.3.2 Photomultiplier T u b e ...23
1.3.3 Charge Coupled D evice...24
1.4 Astronomical Apphcations of C C D ...26
1.4.1 Direct I m a g i n g ... 26
1.4.2 Spectroscopic A p p H c a tio n ... 29
1.4.3 Other Astronomical A ppH cation...30
1.5 Purpose of This Project ...32
1.5.1 Performance Limitations of C C D ... 32
1.5.2 Possible Approach : M o s a i c ... 33
2 T h e M osaic C C D Im agin g S y stem 36
2.1 In tro d u c tio n ... 36
2.2 Principle and Characteristics of C C D ...37
2.2.1 Structure and P rin cip le...37
2.2.2 Charge T ra n sfe r...38
2.2.3 Frame Transfer and Slow Scan O p e ra tio n ... 39
2.2.4 Operational Param eters of C C D s ... 41
2.3 Available S e n s o r s ...45
2.4 Advantages and Problems of Mosaic C C D ... 52
2.4.1 A d v a n ta g e s ... 52
2.4.2 Problems ...54
2.5 Astronomical C a s e s ...62
2.6 O ther Mosaic CCD W o rk ... 64
2.6.1 Four Shooter CCD Camera ... 64
2.6.2 ESO Mosaic CCD C a m e r a ...65
2.6.3 Keck Spectrographs Mosaic CCD C a m e r a ...67
2.6.4 TK 2048x2048 CCD Mosaic by J. Tyson G r o u p ...68
2.7 Design C o n s id e ra tio n s ... 69
2.7.1 Requirements of Mosaic CCD S y s te m ... 70
2.7.2 Design Goals of This W o rk ... 73
3 P r o to ty p e H ardw are D esign and C on stru ction 78 3.1 In tro d u c tio n ... 78
3.2 Controller Design Approach with EPLD ... 81
3.3 Controller Board D e s i g n ... 85
3.3.1 Overview ... 85
3.3.2 EPLD Controller D e s ig n ... 87
3.3.4 The W irewrapped Controller B o a r d ...93
3.4 Delay Counting Controller Board D e s i g n ...97
3.4.1 Overview and C o n c e p t ...98
3.4.2 Delay Counting Controller D e s ig n ...100
3.4.3 Delay Counter Design ...101
3.4.4 Design Modifications of Version 1 EPLD C o n tr o lle r ...103
3.4.5 Subdesign Integration and P ro g ra m m in g ... 105
3.4.6 W irewrapped Delay Counting Controller B o a r d ... 107
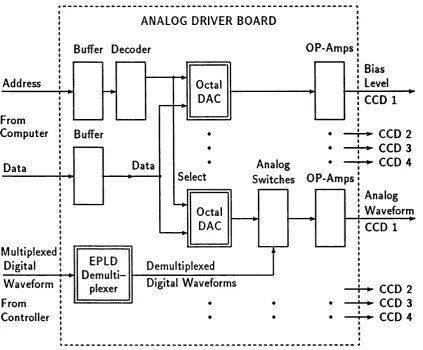
3.5 Analog Driver Board D e s ig n ...110
3.5.1 Overview and Design C o n c e p t...110
3.5.2 Octal D A C s ...112
3.5.3 Circuit D esig n ... 113
3.5.4 D ata and Address C o n tr o l...116
3.5.5 Waveform Demultiplexing for C C D s... 117
3.5.6 Power Supply S w itc h in g ... 118
3.5.7 W irewrapped Circuit B o a r d ...120
3.5.8 Functional Test and C a h b ra tio n ...121
3.6 Headboard and Copper Block D e s ig n ... 123
3.6.1 H ead b o ard ... 123
3.6.2 Constant Current S o u rc e ... 125
3.6.3 Copper Block D e s ig n ... 125
4 Softw are D ev elo p m en ts 128 4.1 In tro d u c tio n ... 128
4.2 Software R e q u irem e n ts...129
4.3 DAC C o n t r o l ...132
4.4 Controller In itialisatio n ...134
4.5 The B i t m a p ...136
4.5.1 Programming C o n c e p t ... 136
4.5.2 Bitmap D e sc rip tio n ... 139
4.5.3 Bitmap G e n e r a tio n ... 141
4.6 Operational M o d e s ... 142
4.6.1 O verscan...143
4.6.2 P u r g i n g ...144
4.6.3 Pixel P r e b in n i n g ... 144
4.6.4 Mixing Different Format C C D s ... 145
4.6.5 Readout of Subset Image A r e a ...146
4.7 System Control Commands ... 147
4.8 Delay Counting Controller S o ftw a re ... 149
5 S y stem In tegration 151 5.1 In tro d u c tio n ... 151
5.2 CCD Sensors ... 154
5.3 Cryostat and Vacuum P u m p ... 155
5.4 System Rack and Power S u p p l y ... 157
5.5 Video P ro c e sso r... 159
5.5.1 KPNO Design-based Video P ro c e ss o r...159
5.5.2 New Video P ro c e s s o r... 162
5.6 Digitiser B o a r d ... 165
5.7 D ata A c q u is itio n ... 168
6.2.1 Optimisation P ro c e s s ...172
6.2.2 Controller and Digital C i r c u i t ... 174
6.2.3 Drive W aveform ... 177
6.2.4 Bias Levels ...180
6.2.5 Video Processor Circuit ... 183
6.2.6 Power Supply and Ground A r ra n g e m e n t... 186
6.3 System P e r fo r m a n c e ...190
6.3.1 System N o i s e ...190
6.3.2 L in ea rity ...196
6.3.3 Cross Talk M easu rem en t...197
6.4 Future W o rk ...202
6.4.1 Circuit Board A rran g em en ts... 203
6.4.2 Controller U p g r a d e ... 204
6.4.3 Video Processor O p tim is a tio n ...206
6.4.4 D ata Handling ...207
6.4.5 Mosaic Focal P l a n e ... 208
6.4.6 Noise Optimisation Process ...210
7 C on clu sion 213 A ck n o w led g em en ts 217 B ib lio g ra p h y 218 G lossary 229 A p p e n d ix 231 A E P L D C ontroller D esign 232 A .l Interface Logic B l o c k ...232
A.2 Control Logic B lo ck ... 234
A.3 Sequencer Logic B l o c k ...236
A.4 System Clocking L o g i c ... 239
B E P L D C A D Softw are 241 B .l S o ftw a re ...241
B .1.1 Design E n t r y ...241
B .l.2 Compilation and S im u la tio n ...242
B .l.3 Software U ti l i t i e s ... 243
B.2 Design Sequence and T e r m s ... 244
C N o ise M easu rem en t M eth o d 247 C .l Mean Variance T e s t s ... 247
C.2 System G a in ... 249
L ist o f T ables
2.1 The standard C C D ... 46
2.2 Charge Coupled Devices I ... 47
2.3 Charge Coupled Devices I I ... 48
2.4 Charge Coupled Devices I I I ... 49
2.5 Charge Coupled Devices I V ... 50
4.1 An example of DAC s e t t i n g ...133
4.2 The Bitmap s tr u c tu r e ... 139
4.3 An example of the B i t m a p ... 140
5.1 Specification and test results of cryostat M N 1 8 1 5 ...156
5.2 Power supply a rra n g e m e n t... 158
6.1 Operating voltage levels for EEV CCD in this w o r k ...179
L ist o f F igu res
1.1 An astronomical CCD imaging s y s t e m ...17
1.2 Schematic structure of a charge coupled d e v ic e ...25
1.3 Q uantum efficiency of various s e n s o r s ... 26
2.1 The technique of charge c o u p li n g... 38
2.2 Schematic of a 4x 5 pixel C C D ... 40
2.3 CCD drive p u l s e s ...41
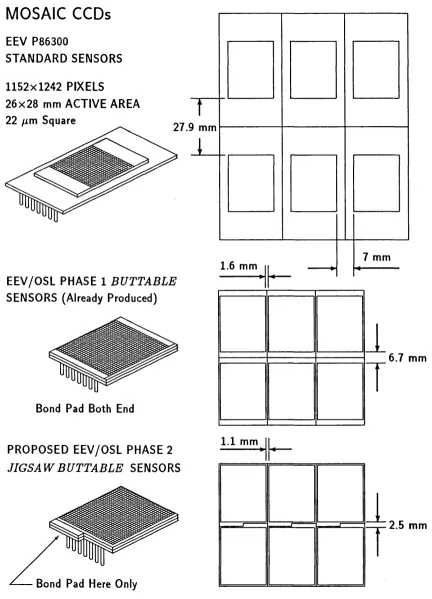
2.4 Buttahle CCDs of E E V /O S L ... 56
2.5 The optical arrangements of focal reducer le n s e s ...58
2.6 Mosaic geometry of ESO buttahle C C D s ...67
3.1 Hardware structure of a mosaic CCD imaging s y s t e m ... 79
3.2 Schematics of the EPLD CAD software s y s te m ... 84
3.3 The controller design c o n c e p t ... 87
3.4 The block diagram of the EPLD controller circuit d e s i g n ...88
3.5 The block diagram of the Sequencer Logic Block d e s ig n ... 89
3.6 Pin arrangements of the programmed EPLD C o n tro lle r... 92
3.7 Configuration of the Controller b o a r d ...96
3.8 The Delay Counting Controller design c o n c e p t...101
3.9 Comparison of system clocking for two controller d e s ig n s ... 102
3.11 Pin arrangements of the programmed EPLD Delay Controller . . . . 107
3.12 Configuration of the Delay Controller b o a r d ... 109
3.13 Block diagram of Analog Driver board design c o n c e p t... I l l 3.14 The circuit design of an analog clock drive w a v e f o r m ... 114
3.15 The circuit design for a bias l e v e l ...115
3.16 The block diagram of EPLD Demultiplexer d e s ig n ...118
3.17 The component arrangement of Analog Driver b o a r d ... 120
3.18 Headboard c ir c u it... 124
3.19 Oblique view of copper b lo c k ...126
4.1 The block diagram of the software s t r u c t u r e ...131
4.2 The timing diagram of multiplexing c o n c e p t ...138
5.1 Schematic of the mosaic CCD system integrated in this w o r k ...153
5.2 EEV P86235 CCD pin a rra n g e m e n t... 154
5.3 Circuit diagram of the old video p r o c e s s o r ... 160
5.4 Timing arrangement of Correlated Double S am p lin g ... 161
5.5 Circuit diagram of the new video p ro c e sso r... 162
5.6 The design of the video processor decoder ... 164
5.7 Digitisation timing of m u ltip le x in g ... 166
5.8 The design of the ADC Demultiplexer ...167
6.1 Summary of system o p tim is a tio n ... 189
6.2 Least squares fit of the mean variance t e s t ... 194
6.3 The system linearity of this w o r k ...197
6.4 The experiment idea for cross t a l k ...198
6.5 Assembled prototype of the mosaic CCD a r r a y ... 209
7.1 The system photograph with two CCD im a g e s ... 216
C h a p ter 1
In tro d u ctio n
1.1
O b jectives and B ackground
During the last decade, lots of remarkable astronomical observations has been made
by the developments of the Charge Coupled Devices (CCD). These devices opened a new horizon in observation to unveil the secrets of the universe. However they have
one fundam ental restriction, th at is, small sensing areas compared to conventional
sensors. Currently there axe increasing demands for larger sensing areas to cover
wide focal planes. In line with this, an effort has been devoted to develop larger area
CCDs by many manufacturers in compHance with the requirements. Meanwhile, as
an alternative, assembling a mosaic of CCDs affords another possibility to obtain
larger sensing areas, together with their efficient driving techniques.
The m ultiple CCDs can be implemented by simple parallel driving of all devices,
however this lacks the possibility of individual tuning, with the problem of potential
cross talk effect. Such optimisation of each CCD is very im portant, particularly when
the ultim ate low level performance is required. O ther methods are im perative to
deal with m ultiple CCDs in any format, allowing individual optimisation efficiently.
An entirely new approach has been explored in this work by implementing the
multiplexing concept of driving waveforms for m ultiple CCDs. The data of each pixel from each CCD can be sequentially digitised within a given pixel readout time.
A mosaic CCD imaging system is developed here on the basis of this approach to
Astronomy is a field of natural science which is the study of the properties and
relation of the stars and universe. The purpose of this study is to understand the
basic principles of nature and to develop a philosophy of hum an beings’ existence.
For this purpose, observation is the only m ethod to collect information from the
universe, and many kinds of observational facihties have been developed since the
beginning of the astronomical observations. More than two thousand years ago, such
observation had already been made by Chinese, Egyptian and Greek astronomers
using some tools. In Medieval ages, Tycho Brahe developed precise instrum ents to
measure the accurate position of celestial objects. A great advance in astronomical
observation was made by Gahleo GaHlei in 1610 [53], when he turned his telescope
to the night sky for the first time in history.
Since then, observational techniques have been improved both in quality and quan
tity by many inspiring pioneers throughout the centuries. At last, orbital observatory
Hubble Space Telescope, named after great astronomer Hubble, is operating in orbit
around the E arth recently th at overcomes the atmospheric lim itation of observation.
Indeed the developments are marvellous. It is now possible to detect a single photon
coming from an object th at is billions of light years away from the E arth, in many
different wavelength regions with extremely sensitive instrum ents. Analysis of these
results obtained by observations and their scientific interpretation allows not only
theoretical study upon how the universe was created, evolves and where the address
of mankind in the universe, but also helps philosophical speculation for the relation
of hum an beings’ existence and nature.
Astronomical study is somewhat different with other fields of science, such as physics
or chemistry, in a sense of verification of related theories. In most other fields of
science, such theoretical studies can be verified by experiments, whereas it is not
possible to dem onstrate theoretical work by experiments in astronomy. The only
possible way is the observation of associated celestial objects, where experiments
have already been made by the nature. All we can do is to collect some information
from the universe for analysis using rehable instrum ents. In the light of this, it
is not an overemphasis in astronomy to stress the im portance of observation, and
efficiency of equipments with high rehabihty. Such a very event happening in the
universe at the precise moment of observation {e.g, supernovas explosion), may not be observed again, if we fail to catch it at th at moment.
Conventionally such observations in astronomy were made in the optical wavelength
band, though now it is rapidly extending its limits to the many other windows,
from radio wavelength to 7-ray bands according to the advance of related science and technology. However there is no doubt th at the optical observation is still a
m ajor asset in astronomy both at ground level and from space, because many astro-
physically im portant spectral features happen to the spectral region. Q uantitative
analysis of observational results in modern astronomy was made possible by the
use of the photographic emulsion as an optical sensor from the mid 19th century.
Through the 20th century, many more sensitive devices were developed to detect faint light signals from the space, such as photomultiplier tube. Among the sensors
used for observation, the CCD is one of the revolutionary techniques developed in
recent decades, which can measure the faint image of objects by transforming it into
electronic image signal with high stability. As a result, a large num ber of successful
observations have been made during recent years by this technique. Some of its
great advantages compared with conventional sensors are high quantum efficiency
and large dynamic range.
This work is mainly devoted to improve efficiency of such CCD observational tech
nique in terms of its sensing area. A brief review of instrum entation and sensors,
including CCD with its appfications for astronomy is described in this chapter aa
an introductory remark. Finally the purpose and scope of this work are presented.
1.2
In stru m en ta tio n for O ptical A stro n o m y
Modern astronomical observation has extended to all wavelength bands from gamma
rays to radio bands, and optical observation is a relatively small part of the whole
electromagnetic spectrum. Recently there is a strong tendency to observation being
made in several wavelengths together for the same objects to understand their basic
properties more thoroughly. However, many im portant discoveries have been made
in the optical band because human eyes are sensitive in this band. It is almost
impossible to mention all instrum ents in all wavelengths which may be relevant in
this work, thus let us confine the discussions to only the optical band. The general
telescopes, sensors and equipment sited at one focus of the telescope to produce some
information by processing the light beam in its broad meaning. Detailed description
of the newly developed telescopes can be found elsewhere [86], [28], and a brief review of sensors is presented in next section. Only those equipments used at the
focus of a telescope, are referred to as an instrument in this section.
1.2.1
P h o to m e tr ic In stru m en ts
Photom etry is one of the main methods of observation to measure the intensity, or
the direction of radiation from objects using an optical sensor such as the photo
multiplier tube (PM tube) or CCD. Measurements of output energy of an object
at several wavelengths give valuable information, for example, stellar structure or
dimension. The colour of stars determined by measurements at two different spec
tral regions leads to information of objects’ tem peratures, or sometimes these are
used as a probe of interstellar dust. Photom etric observation is often necessary to determine the distance and size of a star. The HR diagram has been developed
to understand stellar evolution baaed on photom etry and spectroscopy. The light
curves of variable stars or eclipsing binary stars obtained by photom etry provide im
portant data about the structure and character of stars. Likewise, photom etry has
been one of the most im portant observational techniques in astronomy, especially
at several wavelengths together.
1.2.1.1 P h o to g ra p h ic P h o to m e te r
Photographic cameras have long been used to record astronomical images, and they
are still the only device which can deal with the large focal planes of wide field
telescopes. It was apphed to astronomy for the first time at Harvard University
in the 1850s [54]. However, it has not been outdated by advances of electronic
sensors because of its good spatial resolution together with enormous information
storage capacity (up to several Gigabytes), and its ability to accumulate light over
long period of time to detect objects fainter than those visible to eye. The main
disadvantage is low quantum efficiency (less than 4 %) and nonlinearity of response.
Processing of a photograph is a complex procedure and there are many possibilities
for introduction of errors. It is not possible to expose a calibration on the same part of the plate as the astronomical exposure.
The density and sizes of the image seemed to be directly related to the brightness
of the star, actual image structure has an intensity distribution which approaches
a Gaussian p attern according to the exposed light. Photographic plates can be
reduced by microdensitometer or microphotometer for quantitative analysis of the
results. The magnitudes determined by photographic plate are not the same as those
determined by the eye. In practice, the photographic plate is more sensitive to blue
wavelength, and magnitudes determined by this m ethod is called photographic mag
nitudes. Thus, careful consideration is necessary when comparing its results with
observations obtained by other instrum ents, based on a large num ber of standard
stars observations.
1.2.1.2 P h o to e le c tr ic P h o to m e te r
Since the invention of the PM tube in 1940s, photoelectric photom etry has become
a powerful tool for astronomy especially for stellar photometry. The photoelectric
photom eter system can be designed in various ways for specific purposes, however
the basis of the photom eter is the same in most cases. After being collected by
a telescope, the light beam passes through an offset guider, diaphragm, filter, and
finally reaches to the PM tube, where the light beam generates an electric current
in proportion to the quantity of incident photons. The linearity between input
photon and output current is excellent compared with photographic photometer.
This output current haa to be amplified either by DC electronics or pulse counting
electronics to measure the result. Often the result is w ritten on a chart recorder or
computer memory through a proper interface for perm anent record to be analysed.
The spectral response of photoelectric photom eter is quite different with th a t of a
photographic system. The standard UB V system was defined using the well known
1P21 PM tube and 3 broad band filters, th at give visual (V), blue (B) and ultravio let (U) magnitudes [63]. This is still used as basic photom etric system to standardise the observational result of one observatory with one photom eter, if it is a photo
m etric observation regardless of what kind of instrum ent employed. According to
selected wavelengths. One of the disadvantages of the photoelectric photom eter is
mainly appHcable for point source observation such as stellar photometry, not for
image observation like galaxies. An example of such photoelectric photom eter has
been described by Han and Kim [51].
1.2 .1 .3 E lectron ic C am eras
Many types of cameras can be included in this group based on various different
sensors, for example, sohd state sensors (CCD), reticon (sihcon diode arrays), mi-
crochannel plate (MCP), etc. However, CCD based electronic camera is most widely used in recent years for astronomical purposes with a telescope. Thus it is worth
mentioning the CCD camera briefly here, and discussion of the others of them can
Light
I t I
TelescopeCZD
Filter Wheel
P ream p
CZD
S h u tte r
CCD
T
LN.
Electronics (Controller)
Filter Box
S h u tte r Box
Cryostat
Copper Block with
T em p e ratu re Servo
C om puter
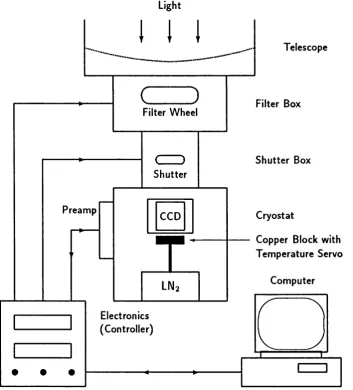
Figure 1.1: Schematic diagram of an astronomical CCD imaging system.
be found elsewhere [72], [129].
CCD cameras have been actively apphed for astronomical purposes since 1976 [86], and it is not an exaggeration to say th at we can not imagine modern optical astron
omy without them. They are equipped at most m ajor observatories in the world with
any form of apphcation for observation. Main apphcations axe for direct imaging at
the prime or Cassegrain foci of the telescope, and as a detector for spectrographs.
Some im portant advantages compared with TV type cameras and photograph are,
high sensitivity with precision and stability for quantitative measurements, wider
wavelength coverage and convenient compatibility with computers for immediate
d ata analysis.
Highly stable and low noise electronic circuitry is necessary to operate CCD, which
is often contained in a vacuum cryostat to keep a very low tem perature [e.g. ^150 K) for dark current reduction. Electronic shutters with milh-second precision have to
be used for exposure in front of the cryostat window, for accurate photom etry of
bright standard sources which require only a few seconds exposure. After exposure,
by properly optimised electronics, the voltage signal from the CCD of an exposed
image is converted to digital data, th at can be stored into computer memory. W ith
the data, many modern image analysis techniques axe available for astronomical
interpretation. A lim itation of a CCD camera is relatively small sensing area, and
the work of this thesis is an effort to overcome such lim itation. Figure 1.1 is a block diagram of a typical astronomical CCD imaging system.
1.2.2
S p ectro m eters and S p ectrograp h s
Spectroscopic observations give some fundam ental physical information on chemical
composition, tem perature, densities, magnetic fields, rotation and radial velocities
of objects. Spectrometers axe used to measure the brightness of one or more element
of spectrum from one or more elements of an object observed with a telescope. They
basically consist of a dispersive element, imaging element and a photon detector.
Generally the spectrograph is a spectrometer with image detector which is able to
measure more than one spectral element simultaneously [104].
principles, th at is interference and refraction. The instrum ents based on diffraction
gratings or interferometers are related with the former ones, whereas the latter
produces prism baaed spectroscopes. After being dispersed by either grating or
prism, the spectrum has to be recorded on imaging devices like photographic plate, or
CCD sensor for analysis. Conventional photographic plates have almost completely
been replaced by CCD sensors in most observatories. The following param eters
are useful to define a spectrometer [104] : spectral resolution (R), luminosity of
a spectrom eter (L), luminosity resolution product (L*R) and detective quantum
efficiency (DQE). Particularly, L R can be considered as a figure of m erit, when comparing different spectrometers. For many particular spectrometers this product
is a fixed constant, therefore the spectral resolution can be increased only at the
expense of luminosity. Spectrometers can be classified to several groups, according
to the spectral resolution as follows.
• Low resolution faint object spectrograph.
• Interm ediate dispersion spectrograph.
• High resolution spectrograph.
• Imaging spectrometers.
1.2.2.1 G ratin g S p ectro m eter
In recent decades, the prism has been widely replaced by the blazed diffraction
grating which can achieve a L R product 50 times higher than the prism [104]. All the
grooves of such a grating are cut with the same inclination angle, resulting in a blaze
angle at which groove diffraction efficiency may reach 80 % for the corresponding wavelengths. Grating spectrometers are among the most frequently used auxiliary
instrum ents in optical astronomy.
W henever possible, grating spectrometers are attached to the Cassegrain focus of
a telescope to avoid light loss from unwanted reflections and polarisation. They
are designed for highest mechanical and therm al stability in order to minimise spec
trum shift during exposure time. Large grating spectrometers are installed in special
rooms, tem perature controlled, at the Coude focus, or equivalent space such as Nas
m yth in alt-azim uth telescopes. Classical spectrographs employ low-order gratings
and only one order is measured at one time. Recently high order echelle spectrom
eters employing high order gratings of large blaze angle have been developed, such
as UCLES (University College London Echelle Spectrograph) [127]. Many spectral
orders, separated by means of a cross dispersing element, can be measured sim ulta
neously using a two dimensional detector.
1 .2 .2 .2 F ab ry-P erot S p ectro m eters
These instrum ents achieve the very high L*R product obtained by étalon, an inter-
ferometric cavity consisting a pair of plane parallel reflecting layers. All-dielectric
m ultilayer reflection coatings considerably improve the efficiency of the étalon, which
can reach 100 times the L R product of a low order grating [104]. High spectral
resolution is achieved by high order interference, which leads to small inter-order
separation, so th at narrow filers are needed to isolate the useful orders.
Fabry-Perot spectrographs employ image detectors and are most effectively used
in high resolution spectroscopy of extensive emission line sources for only a small
num ber of spectral but a large number of spatial elements. Fabry-Perot monochro
m ators allow scanning through a certain spectral interval, for example, by changing
the pressure of the gas in gas-spaced étalon. W hereas single étalon scanners can
examine only reasonably narrow emission line features, the multi-etalon scanners
are designed to scan small region of continuum light source.
1.2 .2 .3 Fourier Transform S p ectro m eters
The two beam interferometric Fourier transform spectrom eter has found most useful
appfications in high resolution spectroscopy. The spectrum is derived from the
interferogram obtained by scanning the path difference in a two beam interference.
The L 'R product achieved with these instrum ents is comparable to th at of Fabry-
Perot spectrom eters [104]. Fourier transform spectroscopy is not restricted to fine
sources, since its multiplex advantage results in a high spectral simultaneity gain
comparable w ith grating spectrographs. But the interferom eter is scanned time
sequentially, so we lose the multiplex advantage. Interferom etric instrum ents are
1.2.3
O th er In stru m en ts
Although the photom etric and spectroscopic instrum ents have been playing a m ajor
role in optical observation, there are many other types of instrum ents for specific
research purposes. It is not intended here to introduce all features of such facihties,
but only a few examples axe given.
• P o la r im e te r : In electro-magnetic radiation, light consists of vibrations at
right angles to the direction of propagation. The vibration can be at any angle
around the direction of motion. The polarisation occurs when the vibrations
have greater amplitudes in a preferred direction (linearly polarised), or when
the plane of vibration rotates systematically in the direction of m otion (circu
larly polarised). Polarisation measurements give information of the presence
of magnetic field, and the polarimeter is a device for such purposes [90].
• S p e c k le C a m e ra s : Using a large telescope, a series of highly magnified
images of a star can be taken with very short exposures. This freezes the
effect of atmospheric turbulence and shows th at the instantaneous image of a
star observed through the atmosphere consists of a large num ber of speckles.
Each speckle is an image of a star resolved to the theoretical limit for the
size of the telescope used. W ith this technique, information is obtained about
the separation and position of a double star, or the diam eter and intensity
distribution across the surface of a star [90], [86].
• A s tr o m e tr y : The measurement of a s ta r’s position in the sky is another field
of astronomy th at has two main methods. The first is to measure absolute
position of stars using a transit telescope, while the other is to determ ine the
relative position of one star with respect to another. Transit telescopes (also
called meridian telescope) provide the basic measurements of stellar positions
for the calibration of other astrom etric method.
A part from the instrum ents mentioned above, there are a num ber of observational
facihties for other specific apphcations, such as CCD transit survey telescope, or
high speed CCD photometers th at are described in next section. Further details can
be found elsewhere [86], [72], [90].
1.3
O p tical Sensors
One of the most useful optical sensors is the hum an eye, although it is now rarely
used for prim ary detection. However a blink comparator is still used to detect the variable magnitude or position of an object on the photographic plates. In this case,
the afterimage of the hum an eye is very useful. The photographic emulsion has been used as a photon sensor in astronomy for more than 100 years, and the PM tube has also contributed greatly since 1950s. Some excellent electronic sensors including
CCD have been developed in recent decades and they are replacing conventional
detectors very rapidly. In this section, a brief review and comparison of sensors are
presented. Among many electronic sensors, only the CCD is briefly described as a
representative of electronic sensors.
1.3.1 P h o to g ra p h ic E m u lsion
W hen a photographic emulsion is exposed to light some photons are absorbed by the
silver halide crystals (grain), and the absorbed photons produce stable silver specks
according to the quantity of exposed photons. The silver halogen is in the form
of tiny crystals, and these are supported in a sohd transparent medium, the whole
structure is called the photographic emulsion. The size of silver halide crystals, or
‘grains’ is governed by two requirements. The first is resolution or the ability of the
film to reproduced fine detail. It is affected by both the grain size and by scattering
of the light within the emulsion. The second is th at of the speed of emulsion, and
this is essentially the inverse of a measure of time to reach a given image density
under some standard illumination [72].
Grain sizes range from 50 nm for a very high resolution film, though 800 nm for a
normal slow roll film to 1100 nm for a fast roll film. A normal emulsion is sensitive to
short wavelengths to the blue, violet and near ultraviolet part of the spectrum. Most
astronomical emulsions were low contrast, but rather grainy until 1973 [104], since
then great advances have been made in terms of limiting m agnitude and SN ratio
due to the development of high-contrast, slow fine-grain emulsions, such as Illa-J.
However, to achieve a reasonable speed, emulsions must be hypersensitized before
and M W P-2. After processing, the plates must be protected thoroughly from dust and gases which influence the image silver. There are many useful references for
photographic technique where further descriptions are available [72], [129], [104].
1.3.2
P h o to m u ltip lier T ub e
The PM tube has been one of the most im portant optical sensors in astronomy since
1950s, which transforms the light into electric current. The basic m aterial is specific
m etal and is supphed power of roughly 1000 volt, with respect to the ground. The final signal pulse may contain milhons of electrons for each incoming photon. After
th at the current is amplified and measured by proper electronics. The response of
the PM tube depends on various factors such as spectral property of a light source,
power supply, noise, and the cooling system.
1.3.2.1 P rin cip le and P r o p e rty
The principle of the PM tube is based on Einstein’s well known theory of the ‘pho
toelectric effect’ ; If an incident photon with a certain wavelength colhdes with a
specific m aterial, this photon is absorbed by the m aterial and an electron may be
em itted. In this case, the energy of the electron is a function of the energy of the
photon, while the number of electrons depends on the intensity of the incident radi
ation. The heart of the PM tube is the m etal surface, called the photocathode th at releases the photoelectrons. These are attracted to another m etal surface (dynode)
by an electrostatic potential. This process is repeated for several stages to amplify
the signal, and finally they are collected at a final m etal surface (anode), from which a current flows to the external electronics.
Because the surface of the photocathode is at a large negative high voltage with
respect to the ground, it is not constructed by a simple m ethod but rath er by a
combination of metals such as cesium antimonide (Sb-Cs) [54]. These metals are
chosen to give the desired spectral response and light sensitivity, and have typical
quantum efficiency of about 10 %. The most widely used PM tubes for astronomical purposes are RCA 1P21, EMI 6256 and EMI 9789, etc. The tube selection depends on spectral response, noise performance and quantum efficiency, according to the
observer’s research purposes.
1 .3 .2.2 N o ise a n d C o o lin g
W hen using PM tubes for astronomical purposes, inevitably there are some addi
tional noise sources as well as the true signal from the object. This is only because
of their properties related to photoelectric effect, which includes therm al noise, field
magnetic and secondary emission noise [54]. Among these, the most im portant and
inevitable one is therm al noise which is mainly produced by the operational tem
perature of the PM tube. The only solution to this problem is to lower its operating
tem perature. In practice, to lower the tem perature, dry ice is commonly used. Anti-
fogging methods and low tem perature sensitive m aterial for PM tube housing should
be arranged to prevent any loss of light. Further details for PM tube noise can be
found in elsewhere [50], [54].
1.3.3
C harge C ou p led D ev ic e
The CCD was invented by a group of scientists at the Bell Laboratory of America in
1969 [86]. The first version had a form at of only one line of eight pixels. A few years later, the CCD array has been upgraded to 100x160, 400x400, 500x500 pixel arrays
by Texas Instrum ents. It was firstly apphed to astronomy in 1976 by scientists at
the Lunar and Planetary Laboratory of the University of Arizona. They obtained
the images of Saturn and Jupiter w ith a special filter m ounted on a telescope [86]. Since then, during 1980s, CCD based instrum ents have become an essential equip
m ent item at most m ajor observatories in the world. It is essentially a sihcon
integrated circuit of m etal oxide semiconductor (MOS) type, the basic detection
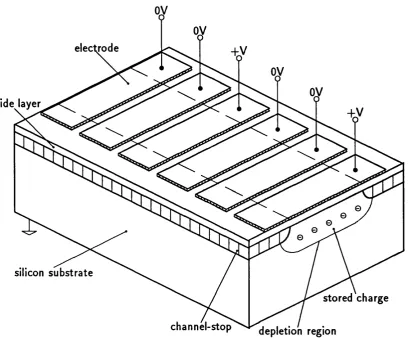
mechanism is related to the photoelectric effect. The schematic structure is shown
in Figure 1.2. A more detailed description of the principle and structure is presented in the next chapter, and some advantages over other electronic and photographic
detectors are briefly summarised here.
• H ig h s e n s itiv ity : The quantum efficiency of a CCD is much higher than most
other sensors. In the case of peak quantum efficiency, it is often more than
ov
e le c tr o d e
+V
oy
oy
o xide layer+V
silicon s u b s t r a t e
s to r e d c h a r g e
c h a n n e l- s to p d e p le tio n region
Figure 1.2: Schematic structure of charge coupled device. Courtesy M. Clayton.
ones’. Figure 1.3 presents the quantum efficiency of a CCD sensor relative to
the other sensors.
• L a rg e d y n a m ic ra n g e ; Very faint objects can be observed even when a much
brighter one is also in the field. The dynamic range of a typical CCD is of
the order of 10'* 10®, which means more than ten thousands times brighter objects can be measured together in a frame with the faintest one.
• W id e s p e c tr a l re s p o n s e ; It is sensitive over a wide range of optical wave
lengths from ultraviolet to near infrared. This is especially suitable to use as a
sensor for spectroscopic instrum ents. Figure 1.3 also shows spectral response
of the CCD compared with the other the sensors.
• S ta b le g e o m e tr y a n d e a sy h a n d lin g : The CCD is small, compact and very
stable, packing and cooling are less difficult. There is no danger of ruin by
over exposure as with PM tube or photographic plates.
Q.E
100
CCD (thinned)
10
PM tube
photograph
1
eyes
0.1
200 300 400 500 600 700 800 900 1000 1100
w a v e le n g th / nm
Figure 1.3: Q uantum efficiency of various sensors [86].
1.4
A stron om ical A p p lication s o f C C D
CCD cameras have been widely applied to astronomy during the last ten years. Their
main appHcation areas for optical observations are direct imaging for photometry,
detector of spectroscopy, and as a detector for Photon Counting Systems, as well
as for autoguiders of telescopes including scanning mode for transit sky survey. It
is almost impossible to describe all of these in detail in here, thus a brief review of
each apphcation is presented with some examples, and more details can be found
elsewhere [68], [86].
1.4.1 D irect Im agin g
One of the main apphcations of a CCD camera is direct imaging photom etry of
many kinds of object. It was commonly accepted th at the photom etric accuracy with
sohd state sensors such as CCDs, was less than 1 per cent in the early 1980s [105]. However, A. Walker [120] showed th at considerably b etter accuracy can be achieved approaching 0.1 per cent using a CCD camera built at University College London by D. Walker et al. [128].
1.4.1.1 S te lla r P h o to m e tr y
S ta n d a r d s t a r o b s e rv a tio n makes it possible to compare the photom etric ac
curacy of CCD camera observations with those obtained by conventional methods,
as well as to convert observational results to a standard photom etric system, such
as U B Vsystem. A lot of well established bright standard star catalogues axe avail able in several spectral ranges ( UBV, UBVRI, or Stromgren filter), obtained by PM tube based observations. Standard star observation with CCD camera has shown
a photom etric precision approaching 0.1 per cent on bright stars using B, V, R, I
filters, and difference between the standard system and the CCD natural system was
obtained for m agnitude as a function of colour indices [120]. Some of the dispersion
in observation result from the standard magnitudes themselves, from scintillation
noise, the changing extinction coefficient of the atmosphere, photon statistics and
readout noise of the CCD.
V a ria b le s t a r o b s e rv a tio n is another suitable apphcation of CCD camera. Some
light curves of Cepheid variables in the external galaxy were obtained. The analysis
of period, luminosity and colour relation of well observed light curves, can be a good
indicator for the distance of galaxies [121]. The quality of CCD based observation
is better than th at obtained by conventional methods, and light curves of visual
m agnitude fainter than 16th with high accuracy could not be easily obtained by PM
tube or photographic based observation.
RR Lyrae variables, another good distance indicator of nearby external galaxies,
were also observed for more high accuracy analysis [9]. As well as those types
mentioned above, all other types of variable stars, such as eclipsing binaries [132],
BL Lac objects [134], and many other types of variables have been actively observed
with CCD cameras by many investigators all over the world, to take advantage of
CCD camera over conventional instrum ents. Particular interest is given to the above
groups of stars. This is because there has hardly been enough observational data
for those objects until recently, which are fainter thau 15th visual magnitude.
O p e n c lu s te r o b s e rv a tio n can also tahe great advantage of CCD as two dimen
sional imaging detector. High accuracy photom etry has been a difficult work by
conventional techniques for all member stars, or finding some variable stars among
the member stars of such open clusters. As an example, Crinklaw and Talbert [30]
made a. B, V observation with a CCD camera of 800x800 pixel array format for the old open cluster NGC 7142 field. They discussed the presence of a single short
period variable star and evidence of small scale variable absorption across the face
of the cluster from the colour magnitude diagram.
1 .4 .1.2 S u rfa c e P h o to m e tr y
Surface photom etry with a vacuum tube based photom eter is also a very difficult
work. The photographic observation does not provide comparable data accuracy and
stability than those of electronic sensors. Again, the advantages of CCD cameras
as two dimensional imaging device have led to them becoming dominant. CCD
photom etry of elliptical galaxies and spiral galaxies shows much enhanced detail of
the objects, than data obtained by conventional techniques.
Spark et al. [107] apphed CCD camera attached to a 1.5 m telescope for 31 elliptical galaxies, and showed th at it is particularly effective in locating dust-lanes in ellip
tical galaxies. Another suitable example of CCD observation is the measurement
of an intense object surrounded by much fainter extended m atter. The discrimina
tion of a bright quasar from an underlying galaxy is a similar example [47]. Such
measurements of a bright object simultaneously with a diffuse region are not practi
cally possible by photographic methods. Those observations benefit from the large
dynamic range of CCD.
1 .4 .1 .3 H ig h S p e e d P h o to m e tr y
The time resolution of normal CCD observation is limited by the readout time to
several seconds. Higher time resolution is possible if the data is prebinned into super
The advantage of the CCD in this case is th at comparison stars can be measured
simultaneously with the program star, thus, better data quality can be achieved.
Such observation is very difficult with normal single channel photometry. This
technique can be applied to fast varying object like cataclysmic variables [57], or
pulsars suffering rapid changes in brightness on short time scales.
A part from the above mentioned examples, highly resolved CCD observations have
been made in planetary observation. Pluto and its moon Charon were observed by
Jones et al. [64], and accurate separation between two bodies was measured. As for the imaging applications of CCD, many other examples are available in most
periodical publications in astronomy.
1.4.2
S p ectro sco p ic A p p lica tio n
The CCD is also widely used as a detector for spectroscopic instrum ents. Only a
few examples are given according to the spectral resolutions of the spectrograph.
• Low R e s o lu tio n S p e c tro s c o p y ; Spectrographs for faint object observation
are based on CCD cameras capable of imaging a spectrum of a faint object
with relatively low resolution of the spectral detail so as not to spread out
the available light too much. The less the spectrum is dispersed, the more
light will be on any given pixel of the CCD and thus more accurate and rapid
m easurement can be made [86]. Faint Object Spectrograph (FOS) of the 2.5 m Isaac Newton Telescope (INT) is such an example. The instrum ent uses the
CCD in an cryogenically cooled Schmidt camera with a prism and transm is
sion grating (grism) [12]. This is a very efficient low dispersion spectrograph which records a spectrum utilising whole wavelength range of the CCD [68]. Such instrum ent is particulary suitable for the objects like quasars which have
prominent emission lines in their spectra th at stand out above the underlying
and much fainter continuum spectrum. As an example, a redshift study for
a sample of galaxies has been carried out by Lawrence et al. [73] using FOS w ith the 2.5 m INT.
• I n te r m e d ia te D is p e rs io n S p e c tro sc o p y : Such observation has been made
with CCD sensor of the INT using cassegrain spectrograph by Diaz, Pagel
and Terlevich [31]. They used the 235 mm camera and 4001 mm~^ grating (linear dispersion of 104 Â m m ” ^) with a CCD camera, and the slit width was
1.4 arcsec, giving a resolution of 5 Â. Red spectrum of the nuclear region of
elliptical galaxy NGC 1052 waa examined by this observation.
• H ig h D is p e rs io n S p e c tro s c o p y ; A study was carried out with an echelle
CCD spectrograph by McKeith et al. [85] for point sources and extended ob ject. These observations illustrate the performance capabilities of the combi
nation of an echelle spectrograph and a CCD camera for programmes in high
resolution interstellar and stellar spectroscopy, as well as for spectral imaging
of extended objects in the visible and near infrared regions. Another example
of high dispersion spectroscopic apphcation was dem onstrated more recently
by Hunten et al. [59]. An echelle spectrograph with a CCD camera of 800x800 pixel array format was introduced by them for planetary astronomy. This com
bination gives remarkably high sensitivity enough to detect brighter airglow
emissions in a few minutes. A part from these, UCL Echelle Spectrograph
(UCLES) on the Anglo Australian Telescope (AAT), U trecht Echelle Spectro
graph (UES) on the William Herschel Telescope (W HT) are using CCDs as
their detector. It is true th at the high performance of such instrum ent requires
a good detector as well as an efficient spectrograph.
1.4.3 O th er A stro n o m ica l A p p lica tio n
1.4.3.1 Im a g e P h o to n C o u n tin g S y ste m
The CCD is available as an alternative to other TV cameras or detectors for Image
Photon Counting System (IPCS). Here the highly intensified image (gain ~ 10?) is received by a fast scanning TV camera which continuously records the photon scin
tillations from a faint input image and passes the video signal to a digital processing
unit. This unit registers the central positions of the photon events in each frame
and accumulates the counts in corresponding locations in a large digital (computer)
memory, in which the image can be processed. The IPCS can discriminate against
dark current and ion events. More descriptions can be found elsewhere [86], [28].
dispersion, since CCD readout noise is particularly serious at extremely low signal
level. But with improving CCD performance the ‘window of opportunity’ for pho
ton counting is constantly narrowing. Main gain with IPCS compared w ith CCDs
is fast time response observation. In these instrum ents, the TV camera can be re
placed with a CCD sensor. University College London IPCS developed by Fordham,
Bone and Jorden [44] is an example of such apphcation. They dem onstrated high
resolution and good detection efficiency in counting incoming photons of the IPCS.
1.4 .3 .2 A u to g u id er
Telescope autoguider system could be another suitable application. It is a fundamen
tal requirement for optim um use of a whole range of remote controlled instrum ents
th a t the ability to look at the fields and guider the telescope with a remotely op
erated camera. Highly sensitive TV cameras have been commonly used for guiding
large telescopes. Recently the improvement of available CCDs, with very low dark
current, low readout noise and good sensitivity over wide spectral response has made
possible a CCD camera as a useful alternative for telescope guiding.
An excellent example of such apphcation is a CCD camera for field acquisition and
guiding for the Lick Observatory 1 m and 3 m telescopes, developed by Robinson and Osbone [102] using a virtual phase, thermoelectrically cooled CCD. They have
dem onstrated with two cameras at two telescopes th at CCD sensors can more than
m atch the performance of vacuum tube sensors for telescope guiding and pointing,
in spite of one potential problem due to possible deficiencies in charge transfer. The
advantage of geometrical stability, low cost, wide dynamic range and fast recovery
from overexposure is enough to ensure th at CCDs wiU be preferred &s detector for future telescope field acquisition and guiding equipment.
1 .4.3.3 Scanning M od e
An interesting apphcation of CCD is scanning mode operation. In this case, the
projected image onto the CCD is moved along the vertical charge transfer direction
with the same speed of its clocking rate. Apparently the CCD itself is operating in
normal mode, however with this readout arrangement, the pixel to pixel sensitivity
variation can be minimised. This is because image charge from previous pixels is
added up to the next one, and thus more photons will be collected of the projected
image by keeping up with relative position of current image, and finally, it will be
readout without any contribution of vertical direction pixel variation. If this situa
tion is apphed to a stationary telescope without tracking the object, the image on
the CCD will be drifted by sidereal rate. Instead of tracking the object image, the
CCD vertical clocking rate can be synchronised at the same rate in the same direc
tion, so th at image can be scanned at the same speed. This idea was implemented
for The CCD Transit Instrum ent (CTI) of University Arizona [84].
1.5
P u rp o se o f T his P ro ject
1.5.1
P erform an ce L im itation s o f C C D
As weU as excellent advantages of CCD sensors previously mentioned, it has some
performance limitations for astronomical purposes. The readout noise of commonly
available devices is in the order of 5 to 10 electrons with peak quantum efficiency of
in a range of 30 ~ 80 % [28], [68]. These param eters are now being improved rapidly by m any manufacturers, thus it is reasonable to expect much improved new devices.
The dynamic range of 10^ ~ 10® of most currently available CCD is sufficient for a wide range of astronomical purposes, except for those of only extremely low level
signals. The time resolution of a normal CCD observation is limited by readout time,
and this is typically of the order a few tens of seconds depending on its clocking
rate. However, higher speed operation is possible, up to order of a few seconds [108]
for astronomical purposes. It may be better to use vacuum tube based instrum ents
rather than CCD for much higher time resolution, for example, up to a few milli
seconds order with real time analysis such as for occultation observation. This is
rather specific purpose in astronomy.
The most significant lim itation of the CCD sensor is its small sensing area. The
most common pixel format (which can be called as ‘standard form at’) of current
plane. There is currently a demand for large area sensors in astronomy for both
direct imaging and spectroscopic apphcations. Some examples of large focal planes
are shown as follows [124].
• T h e U K -S ch m id t T elescop e : this can illuminate a field of approximately 350x350 m m square. It is clearly impossible to cover this area entirely with any current available CCD even the largest one.
• T h e A n glo A u stralian T elescop e (A A T ) : wide field upgrade will illumi nate a field of 2 degrees, giving area of 440x440 m m square. Again this is too large an area to cover with current ‘standard form at’ CCDs.
• T h e U K 8 m T elesco p e : the current design with an / / 7 corrector will give good images over 45 arcm in field, corresponding 730x730 m m square. This is several thousand times the area of a ‘standard form at’ CCD’s.
• S p ectrograp h s : the proposed Short Camera of Utrecht and UCL Echelle Spec trographs could illuminate a field up to 60x60 m m square.
It is true for some apphcations with modern sensors th at only a very small portion of
available information collected by a telescope, is utihsed. The potential advantage
in collecting photons over a wide field may be better than the limited potential for
improvement of quantum efficiency or readout noise in terms of overall efficiency of
observational instrum ents. However, it seems very unlikely to be possible to cope
with a such large focal plane with currently available CCD sensing area.
1.5.2
P o ssib le A p p roach : M osaic
There are two possible approaches to overcome the restriction of small CCD sensing
area. The first one is using large form at sensors (thus larger area), such as Tektronix 2048 X 2048 pixel format device th at gives 49 x 49 m m square, or recently developed
4096 X 4096 pixel format (but pixel size is 7.5 f i m ) by Ford Aerospace (now Loral
Fairchild). Currently, several CCD manufacturers plan to develop, or are producing
such large format sensors. Actuahy these larger devices could have a m ajor impact
on astronomy. However, these devices have already shown some problems, not only
because of technological difficulties in semiconductor manufacturing process and its
high cost related to yield, but also performance limitations of reduced charge tran s
fer efficiency and much longer readout time. Although those devices are available
without any m ajor obstacles, the problem may still remain, in dealing with such
large focal planes mentioned in the above examples.
Another approach is to assemble mosaics of small format CCDs at the large focal plane. Small format CCDs are now widely available. Many of these small CCDs can
be tiled together to conform to the large focal plane, and this could be more flexible
and rehable approach. This is because the m ajor performance lim itations in using
the larger sensors can be avoided, and the mosaic array can be of any geometry
and could even conform to a curved focal surface. More advantages of this approach
compared to large format CCDs will be described in detail in Chapter 2. In practice,
some researchers [86], [68] have already estim ated th at the next step to improve the efficiency of CCD imaging systems would be the mosaic technique. However, as well
as many advantages, there are some problems to be overcome.
A considerable portion of the photons could be lost by the gaps between the sensing
areas, when they are tiled together. This gap has to be reduced to minimise the
loss of photons. Recently some devices were developed which can be hutted together to minimise the gaps between the devices by some manufacturers [124], [76]. O ther
effort has been made to mount several CCD dice on one substrate [89]. However, this
approach has a difficulty of expansible sensing area due to size and therm al expansion
restrictions on substrate. Together with buttable CCD package, the optical designs,
such as using multi-faced pyramid mirror or mosaic of focal reducer lenses for specific
instrum ental requirements can be implemented to overcome this lim itation [124].
Another im portant problem in mosaic CCD arises from its associated electronics to
control many CCDs together. It is impractical to have individual electronics for each
CCD, since this may require excessive electronics depending on the num ber of CCDs
employed, thus only limited number of devices could practically be implemented.
Parallel driving of many CCDs together is another prospect, however, this rules out the possibility of individual tuning of each CCD, with the potential problem of
cross talk. Such optimisation is very im portant when the ultim ate low light level
Therefore, it is necessary to consider other electronic approaches to control a number
of CCDs simultaneously in a manner which is indefinitely expansible with any number o f mixed CCDs and in any form at within the practical limit. A new concept has been developed for an entirely novel approach where drive waveforms are multiplexed and interleaved for each CCD at the Optical Science Laboratory (OSL) of UCL by D. Walker [124], A. Fish [43] and M. Clayton [28]. It is possible to implement
this concept by defining the multiplexed drive waveforms as a digital bit pattern
(hereafter Bitmap, its definition is in Section 3.3.1).
The aims of this work are to design and construct a prototype of such electronics
and develop this concept further to be able to realise it in actual circuitry, and
verify its performance through optimisation and experiments. Much effort will be
paid to improve its system performance, such as system noise and cross talk between
the CCDs. More detailed descriptions of the system design configuration and other
related research performed by many investigators will be presented in Chapter 2. The contributions and collaborations of other members within the group in the
whole range of the project will be marked where appropriate. The author’s m ajor
role in the whole project is briefly summarised as follows.
• Designing mosaic CCD headboard circuit for the test of electronic circuitry.
• CAD design for the controller digital circuit by using Erasable Programming
Logic Devices (EPLD).
• Designing and wire-wrapping of prototype Controller, Interface, and Analog
Driver circuit boards.
• Developing system software to control the hardware.
e Integration of system components and their functional tests.
• Optimisation and experiments to improve its system performance.
![Figure 1.3: Quantum efficiency of various sensors [86].](https://thumb-us.123doks.com/thumbv2/123dok_us/9160384.1454152/27.595.116.434.111.403/figure-quantum-efficiency-of-various-sensors.webp)
![Figure 2.1: The technique of charge coupling [17]. Courtesy of M. Clayton.](https://thumb-us.123doks.com/thumbv2/123dok_us/9160384.1454152/39.595.118.422.81.409/figure-technique-charge-coupling-courtesy-m-clayton.webp)
![Figure 2.3: CCD Drive pulses [17]. Courtesy of M. Clayton.](https://thumb-us.123doks.com/thumbv2/123dok_us/9160384.1454152/42.595.77.466.81.333/figure-ccd-drive-pulses-courtesy-m-clayton.webp)
![Table 2.1; The standard CCD, 1990 and 1995, quoted from Jorden [66].](https://thumb-us.123doks.com/thumbv2/123dok_us/9160384.1454152/47.595.63.478.523.734/table-standard-ccd-quoted-jorden.webp)
![Figure 3.2: Schematics of the EPLD CAD software system [1],](https://thumb-us.123doks.com/thumbv2/123dok_us/9160384.1454152/85.595.92.463.104.702/figure-schematics-epld-cad-software.webp)