300 | P a g e
OPTIMIZATION STRATEGIES TO IMPROVE PLOT
TIME OF A VERTICAL PLOTTER
Sreeraj S.
1, Athul Baby
2, Arun G. Aniyan
3Ginu Thomas
4,Renjith S. R.
5 1,2,3,4Department of Computer Science and Engineering, College of Engineering Adoor, (India)
5
Assistant Professor, Dept. of Computer Science and Engineering, College of Engineering Adoor, (India)
ABSTRACT
Vertical plotters, although being a slow and raster based device, are highly versatile drawing machines capable of
extending their use in wide variety of fields. An artistic recreation, rather than an exact duplication, of digital
images on canvas using elementary hardware components and complex algorithms act paradoxical to the way
normal printers work. Yet their immense scalability and cost-effectiveness provide advantage over printers in
certain areas. This paper introduces a programmatic method to reduce the average plotting time of a vertical plotter
by optimizing the input image. The optimizations are carried out over three phases by analyzingthe input image,
using three different algorithms, to render out the important pixels and create an intermediate input file in software
vector graphics format. The SVG image is recreated using a generic V-plotter algorithm and case studies on
different results were analyzed to reach a conclusion that the proposedtechnique reduces the plot time by up-to five
times.
Keywords: Drawing Machine, Lin-Kernighan Heuristics, Stippling, TSP Solving, Vertical Plotter.
I INTRODUCTION
Machines that can draw has been an interesting topic of researchfor many, around the world. There have been
manysuch machines from the early X-Y plotter [1] to the latest Line-Us [2] drawing robot arm which differ from one
another in their actual purpose. Most drawing machines are created with artistic intent rather than on a performance
perspective. A machine which can understand real-life objects, interpret them and recreatethem successfully, is the
gold standard for intelligent drawing machines. Many researchers have made interesting contributions to Image
analysis, processing, representation, visual learnings in AI etc. which drives the most advanced drawing machines.
One of most versatile drawing machine is vertical plotter or v-plotter [3], a vector graphics printing device which
operates by moving a pen over the surface of paper to create drawings.A suspended pen plots on a vertical (or
slightly angled) drawing surface by means of two motors attached to a timing belt (see fig.1).An algorithm
determines the necessary control signals to be provided to motors so as to move the pen to its respective position.
There are many open-source v-plotters, with varying degrees of documentation, created by artists and hobbyists like
301 | P a g e
on different algorithms, providing outputs which vary in aspects such as resolution, drawing time etc.V-Plotters are
generally used to create artistic, high resolution drawings which spans over large areas. The easy scalability of the
drawing areais a distinguishing feature of vertical plotters. Yet these machines fail to create a significant impact; due
to its very slow operation. Our research emphasis is on creating an optimal algorithm to substantially reducethe
drawing time. The two major design concerns to be addressed here is:
1. Vertical arrangement and suspended pen system make gravity play its role in increasing effective load on the
motors and hinders fast pen movements.
2. Since a vector device can plot only lines and minimum curves, rasterization is achieved through repeated line
strokes. Repeated movements and large drawing area also contributes to slow movements.
Fig.1 Vertical Plotter
Since the mechanics cannot be largely altered, we need toenhance the software to improve plotting time. This paper
introduces a novel method to improve the plotting time by systematic analysis and optimization of machine
algorithm. Three different phases of optimizations are proposed where in the first phase, the input image is stippled
using Lloyd's algorithm[7] and a vector graphics output is generated. In the second phase, the vector file is processed
using theTSP Solver algorithm to obtain an optimized vector path. The core software written in processing generates
the necessary stepper commands and in the final phase, a greedy algorithm[8] is used to reorder drawing plan and
remove duplicate glyphs. The final commands are serially transmitted to the microcontroller for execution.
Experimental results suggests that the optimization measures when applied, reduces the plotting time by 7 times.
Further into the paper, the research relevance, machine design, algorithm implementation and conclusions derived
are discussed.
II RELEVANCE
Although verticalplotters are very slow, low resolution printers, the potentially unlimited scalability and
numerous variations in the output make them a very interesting method to create drawings that require flexibility.
302 | P a g e
resolution of output from graphics printers generally varied between 72 dpi and 100 dpi. But, even HP's earliest
digital pen plotters could produce a line resolution equivalent to 1000 dots per inch [9].
Vertical plotters have a wide variety of applications, since they are capable of printing large scale images and can be
used with many different types of media. Typical uses include architectural drawings, maps, large signs or POP
advertisements in shops and supermarkets, art gallery prints or large photographs etc. Media options include: vinyl,
canvas, fabric, card, paper, film, adhesive paper, coated paper, billboard paper etc and the media can either be sheet
fed or roll fed.
III DESIGN
The machine workson a simple mechanics involving a pen suspended by two pulleys, using a GT2 timing belt, on
either sides of the drawing area (see fig.2). The pulleys are connected to bipolar stepper motors of 200 steps/rev
which on rotation, moves the pen along the canvas.
Fig.2 V-Plotter Mechanics
By precise rotations of the motor, pen can be moved to a desired position. The degree of rotation needed for
movement is calculated by an algorithm if and when input by machine variables such as machine height, machine
width and stepper specifications. The following simulation model gives the physical proportions, the device has to
maintain, between the drawing area and machine size.
303 | P a g e
The green portion denotes the preferred drawing area. The two stepper motors, connected to an Arduino using
A4988 Stepper Motor Driver circuit, are mounted on upper corners of the drawing surface, denoted by „+‟ markers
in figure 4 [10]. Collectively these can be defined as the machine hardware.
The software side include an Image optimization module and a processing sketch acting as the core software. The
Image optimization module employs stippling and TSP solving algorithms to convert the input image to an
optimized vector path. The core software converts the input image to G-codes, maps the relative positions and
generates the commands for stepper movements. The generated commands are processed using a greedy algorithm
to obtain the reordered command queue. These commands are then serially transmitted to the Arduino for execution.
Control flow diagram (See Fig 5) depicts the interaction between user computer and hardware clearly.
Fig.4 Control Flow Diagram for The Machine
IV IMPLEMENTATION
Like most Art forms, A V-plotter doesn‟t need to render scenes in a photorealistic manner. Artists abstract and
modify images to convey more information. In the same sense, Vertical plotters generate Non-Photorealistic
drawings which are abstract renderings of the raw image.
A machine needs to understand an input image better to have them optimized. An image is defined in pixels and
resolutionwhich provides the software with insights such as drawing area size, probable drawing time etc. If a
machine needs to compromise on image quality for drawing time, it must make a choice to filter out trivial pixels
from plotting. The proposed algorithms aid in eliminating frivolous pixels from plotter trajectory.
To achieve rasterization, vertical plotters createvector paths from raster images by grayscaling, posturizingframes
and performing a vector trace on every colour layer. Often these paths are unordered and inefficient. One of the
perennial problems that we come across in a variety of contexts, including CNC artwork and other X-Y Plotters, is
the difficulty of creating good-quality vector artwork representing halftones. The primary objective of the
optimization strategies proposed is to create a weighted, ordered and efficient vector path. The different phases are
304 | P a g e
4.1
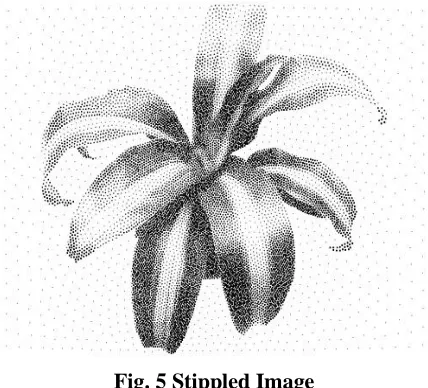
Phase I: Stippling
Here, a weightedcentroidalVoronoi diagram is generated from the raw image and is stippled through an iterative
relaxation process.Stippling is the production of continuous graduations of light and shade through the use of small,
discrete dots or strokes.
AcentroidalVoronoi diagram is formed by generators which lie in the centroid of its voronoi region. In a weighted
CVD, each centroid is weighted by a density function ρ(x,y) of a grayscale image f(x,y) where x,y∈ [0,1] and 0 ≤ f(x,y) ≤ 1 is the range from a black pixel to a white pixel.Initial distributions calculation begins as a crude set of
points generated by rejection samplingLloyd‟s iterative algorithm is used to generate weighted CVDs.
Algorithm: Lloyd‟s method
while generating points xi not converged to centroids do
Compute the Voronoi diagram of xi
Compute the centroids Ci
Move each generating point xi to its centroid Ci
end while
Fig. 5 Stippled Image
Now the image converted to a vector path by connecting all of the dots in a stipple diagram. Vector paths are very
efficient as they create an end-to-end path with a definite start point and endpoint. As paths are continuous without
breaks, pen lift function can be eliminated. The algorithm uses “nearest neighbor” path selection[11], which create
305 | P a g e
Fig.6 Connected Stipples to Form Path
4.2
Phase II: TSP Solving
To improve the path efficiency, a TSP or travelling salesman solver calculates an optimal route that visits each
stipple exactly once. Travelling salesman problem is a classical algorithm providing the shortest possible path that
visits each and every node exactly once and then returns to the starting point. It has been applied in fields like gene
mapping, protein function prediction, vehicle routing etc.TSP solving and stippling is employed in Bruce
Sharpiro‟s„Eggbot‟[12]
and other CNC Drawing machines.
The algorithm approximates a solution to the two-dimensional Euclidean Traveling Salesperson Problem, using the
Lin-Kernighan heuristic[13]. It uses the cutting-plane method, iteratively solving linear programming relaxations of
the TSP. Three data sets are used here; edge set files defined by „end1 end2 weight‟ represents the end nodes and
weight of an edge, node positions denoted by „x1 y1‟are used to calculate the distance between these coordinates
and cycle files represented by „p_1 p_2 p_3 .... p_n‟ to form the path.
A „Cheapest-insertion‟ strategy is used by QSopt LP solver[14]to create an initial tour including all nodes. The 2356
(Lin and Kernighan 1973) heuristic uses variable k edge exchanges to improve the initial tour and the optimized path
is stored as asvg. The most efficient path for the configuration is achieved.
306 | P a g e
The core software is used to create the corresponding stepper commands and are store in a queue. The command
queue is stored in a text file for processing in the next stage.
4.3
Phase III: Path Optimization
The shortest path created by the TSP Solver may yet have unwanted or duplicate nodes. A greedy algorithm written
in python is used to remove these redundant glyphs and optimize the drawing plan. Greedy algorithm is a heuristic
method of making the locally optimal choice at each iteration to achieve global optimum. By removing a node, if a
Pen lift or pen down operation can be eliminated, then a faster plotting time can be achieved. A Selection function
and a Feasibility function checks whether a node needs to be removed to generate a shorter path. The reordered
stepper commands are sent serially over to the Arduino for execution.
V CONCLUSION
The proposed technique was implemented and different test cases were performed to analyze its efficiency. Results
show up to a 5 times reduction in plotting time than normal plotting. The below images show a simulation of plotter
movements for a normal image and the optimized image. It is clearly visible that the optimization technique reduces
the redundant paths.
Fig.8 Unordered Machine Path Fig. 9 Optimized Machine Path
One of the major disadvantage of the technique is that it requires a lot of time and computational power to process
the approximation heuristics. The increase in number of stipples will increase the number of iterations exponentially.
In future, the technique can be built as an API running on a cloud machine with great computational capabilities,
which will enable fast processing of input images. Coupled with fast processing capabilities and the proposed
optimization algorithms, vertical plotters can replace many other drawing machines in the future.
REFERENCES
[1] Dr. M Shivakumar, “Robotic 2D Plotter”, International Journal of Engineering and Innovative Technology
307 | P a g e
[2] ChifumiNishioka, AnsgarScherp, KlaasDellschaft, “Comparing Tweet Classifications by Authors Hashtags,
Machine Learning, and Human Annotators”, 2015 IEEE/WIC/ACM International Conference on Web Intelligent Agent Technology (WI-IAT).
[3] Makerblock.com, “A Study of Drawing Robot Pen Holders and Design Considerations”
(Online),Available:http://makerblock.com/2013/03/a-study-of-drawing-robot-pen-holders-and-design-considerations/.
[4] Interfacing and Programming Manual, HP7470A Graphics Plotter.
[5] C W Park, J JBarale, “Analog Field Plotter- Description and Use ”, IEEE Journals and Magazines, Volume 80,
Issue 9
[6] Wikipedia webpage, (online), Available: https://en.wikipedia.org/wiki/Concorde_TSP_Solver#cite_note-1
[7] Ivan EvgenierIvanov, “Speed Optimisation and Trajectory Control for Large-Scale Textile Plotter”, 2015
International Conference on Development of E- Systems Engineering. (DeSE).
[8] Ma Guangzhi, Lu Yanshang, Song Eumin, Zhang Wei, “Introducing gene Clusters into a P2B Based TSP
Solving Algorithm”, 2009 WRI World Congress on Computer Science and Information Engineering, Year
2009, Volume 4.
[9] Wikipedia webpage, (online), Available:https://en.wikipedia.org/wiki/Plotter
[10]Ngoc Quy Le; Jae WookJeon, “An open-loop stepper motor driver based on FPGA”, 2007 International
Conference on Control, Automation and Systems,Year: 2007.
[11]Yongping Du; Xiaoyan Du; Liang Huang, “Improve the Collaborative Filtering Recommender System
Performance by Trust Network Construction”,Chinese Journal of Electronics,Year: 2016, Volume: 25, Issue: 3
[12]Yingying Yu; Yan Chen; TaoyingLi,“A New Design of Genetic Algorithm for Solving TSP”, 2011 Fourth
International Joint Conference on Computational Sciences and Optimization,Year: 2011
[13]Andrew M. Sutton, Frank Neumann, Samadhi Nallaperuma,“Parameterized Runtime Analyses of
Evolutionary Algorithms for the