Analysis of Plasma Distribution near the Extraction Region in
Negative Ion Sources with Surface and Volume Produced Negative
Ions
∗
)
Azusa FUKANO and Akiyoshi HATAYAMA
1)Monozukuri Department, Tokyo Metropolitan College of Industrial Technology, Higashi-Oi, Shinagawa, Tokyo 140-0011, Japan
1)Faculty of Science and Technology, Keio University, Hiyoshi, Kohoku-ku, Yokohama, Kanagawa 223-8522, Japan
(Received 18 December 2018/Accepted 9 April 2019)
Plasma distributions near the extraction region in a hydrogen negative ion source are investigated analytically. Where surface produced hydrogen negative ions and volume produced hydrogen negative ions are considered in addition to electrons and hydrogen positive ions. The plasma-sheath equation is derived analytically and the distributions of the electric potential and the plasma density near the extraction region are obtained by solving the plasma-sheath equation. It is shown that the region consisting of the positive ions and the negative ions more than the electrons is formed near the extraction region for a case of large production rate of the negative ions. Dependence of the plasma density on the temperature of the negative ions is also shown.
c
2019 The Japan Society of Plasma Science and Nuclear Fusion Research
Keywords: negative ion source, volume produced negative ion, surface produced negative ion, plasma-sheath equation, electric potential, plasma density
DOI: 10.1585/pfr.14.3403096
1. Introduction
Neutral beam injection (NBI) using a hydrogen neg-ative ion source is one of the most promising method of heating plasma confined magnetically. In the hydro-gen negative ion source, it is important to understand the plasma characteristics near the extraction region in order to extract a large amount of hydrogen negative ions. The emission of electrons from a cathode into the sheath in plasma containing positive ions, electrons and negative ions has been analyzed by Amemiyaet al.[1]. For the case of the emission of negative ions from the cathode into the sheath, transport of surface produced negative ions from a cathode has been analyzed by McAdams and Bacal [2]. Their results are in good agreement with the 1D3 V PIC code [3]. Formation of a plasma well has been also shown by one-dimensional analytical model of the sheath in the negative ion source [4]. The plasma well and the particle density in the negative ion source have been studied and confirmed also by 2D PIC model simulations [5,6]. On the other hand, an experiment in the NIFS-R&D ion source has suggested that a “double ion plasma layer” which is a region consisting of mainly hydrogen positive ions (H+) and negative ions (H−) exists near a plasma grid (PG) sur-face [7]. The distribution of the plasma density near the wall is related to the electric potential distribution. Emmert et al.have investigated formation of the potential by using
author’s e-mail: [email protected]
∗)This article is based on the presentation at the 27th International Toki Conference (ITC27) & the 13th Asia Pacific Plasma Theory Conference (APPTC2018).
a plasma-sheath equation for plasma consisting of positive ions and electrons [8]. The distribution of the plasma den-sity near the extraction region in a surface produced nega-tive ion source has been studied analytically and it has been shown that as the production rate of the surface produced H−ions increases the double ion plasma layer is formed near the PG surface [9]. However the effect of the volume produced H−ions has not been considered.
In this paper, we will study the distributions of the electric potential and the plasma density near the extrac-tion region in the hydrogen negative ion sources, where surface produced H−ions and volume produced H−ions are considered in addition to electrons and H+ions. The plasma-sheath equation is derived analytically and the dis-tributions of the electric potential and the plasma density are obtained. Effect of the production rate and the tem-perature of the H−ions on the plasma distribution near the extraction region are shown.
2. Analysis of Electric Potential
2.1
Analytical model and basic equations
The geometry of the extraction region in the model is shown in Fig. 1. It is assumed that in the hydrogen nega-tive ion source the surface produced H−ions are produced on the PG surface and launched to the interior of the ion source and the volume produced H−ions and the H+ions are produced whole in the ion source. The problem is treated as one-dimensional model inx-direction, which is the direction of beam extraction. In the analysis, the PG is
c
Fig. 1 Geometry of the extraction region of the model.
Fig. 2 Geometry of the potential in the analytical model.
considered to be the walls on both sides in order to main-tain a conservation of particles. It is assumed that the elec-tric potentialφ(x) is symmetric aboutx=0 and decreases toward the walls and is zero atx =0 as shown in Fig. 2. The walls atx=±Lare assumed to be perfectly absorbing and electrically floating. The total energyEiof the H+ion,
Ev of the volume produced H−ion, andEsof the surface
produced H−ion in thex-direction are Ei=
1 2Miv
2
i +qφ(x), (1)
Ev=
1 2Mvv
2
v−qφ(x), (2)
Es=
1 2Msv
2
s−qφ(x), (3)
whereMi,Mv, andMsare the masses,υi,υv, andυsare the
velocities,qand -qare the charges of the H+ion and the H− ion, respectively. The subscripts “i”, “v”, and “s” denote value belonging to the H+ ion, the volume produced H− ion, and the surface produced H−ion, respectively through-out this paper. The kinetic equations for the H+ion and the H−ion in the phase space (x,Ei), (x,Ev), and (x,Es) are
described by σvi(x,Ei)
∂fi(x,Ei, σ)
∂x =Si(x,Ei), (4) σvv(x,Ev)∂
fv(x,Ev, σ)
∂x =Sv(x,Ev), (5) σvs(x,Es)∂
fs(x,Es, σ)
∂x =Ss(x,Es), (6) where σ=±1 is the direction of the particle motion, fi(x,Ei, σ), fv(x, Ev, σ), and fs(x,Es, σ) are the
distribu-tion funcdistribu-tions, andSi(x,Ei),Sv(x,Ev), andSs(x,Es) are
the source functions. We assume a symmetry aboutx=0 for the source functions. Furthermore, we assume that par-ticles are not reflected at the walls, then the boundary
con-ditions of the distribution functions are fi(−L,Ei,+1) =
fi(L,Ei,−1) =0, fv(−L,Ev,+1) = fv(L,Ev,−1) =0, and
fs(−L,Es,+1)= fs(L,Es,−1)=0.
2.2
Plasma-sheath equation
From Eqs. (1), (2), and (3), the ion velocities are given by υi=[(2/Mi){Ei−qφ(x)}]1/2,υv=[(2/Mv){Ev+qφ(x)}]1/2,
andυs = [(2/Ms){Es +qφ(x)}]1/2. The energy space of
the particle is divided to some regions, which is based on the condition thatυi,υv, andυsmust be real number, that
is,Ei−qφ(x)≥ 0,Ev+qφ(x) ≥0, andEs+qφ(x) ≥0,
respectively. The particle motion depends on its energy. The distribution functions fi(x,Ei, σ), fv(x,Ev, σ), and
fs(x,Es, σ) forσ=±1 are obtained by integrating Eqs. (4),
(5), and (6) for particle trajectory with the boundary con-ditions. The ion densities are obtained by taking the sum of the distribution functions aboutσ = ±1 for each energy region and integrating them for Ei, Ev, and Es,
respectively, as ni(x)=
σ
dEi
fi(x,Ei, σ) vi(x,Ei)
, (7)
nv(x)=
σ
dEv
fv(x,Ev, σ) vv(x,Ev) ,
(8)
ns(x)=
σ
dEs
fs(x,Es, σ) vs(x,Es)
, (9)
where
σ
fi(x,Ei, σ)= ⎧⎪⎪ ⎪⎪⎪⎪⎪ ⎪⎪⎪⎪⎪ ⎪⎨ ⎪⎪⎪⎪⎪ ⎪⎪⎪⎪⎪ ⎪⎪⎪⎩ 2 L 0
Si(xi,Ei) vi(xi,Ei)
dxi, (0<Ei<∞)
2 L
xit
Si(xi,Ei) vi(xi,Ei)
dxi, (Emin<Ei<0)
,
(10)
σ
fv(x,Ev, σ)= ⎧⎪⎪⎪ ⎪⎪⎪⎪⎪ ⎪⎪⎪⎪⎪ ⎪⎪⎪⎪⎪ ⎪⎪⎪⎪⎨ ⎪⎪⎪⎪⎪ ⎪⎪⎪⎪⎪ ⎪⎪⎪⎪⎪ ⎪⎪⎪⎪⎪ ⎪⎪⎩ 2 L 0
Sv(xv,Ev) vv(xv,Ev)
dxv,
(−qφmin <Ev<∞)
2 xvt1
0
Sv(xv,Ev) vv(xv,Ev)
dxv,
(Emin−<Ev<−qφmin)
2 L
xvt2
Sv(xv,Ev) vv(xv,Ev)
dxv,
(−qφ(±L)<Ev<−qφmin) ,
(11)
σ
fs(x,Es, σ)= ⎧⎪⎪ ⎪⎪⎪⎪⎪ ⎪⎪⎪⎪⎪ ⎪⎨ ⎪⎪⎪⎪⎪ ⎪⎪⎪⎪⎪ ⎪⎪⎪⎩ 2 L 0
Ss(xs,Es) vs(xs,Es)
dxs, (−qφmin<Es<∞)
2 L
xst
Ss(xs,Es) vs(xs,Es)
dxs, (Emin−<Es<−qφmin)
,
surface produced H− ions, respectively, xvt1 and xvt2 are
the turning points of the volume produced H−ions forxv<
xminandxv >xmin, respectively, andxminis the position of
the minimum potential,Emin =qφ(x) andEmin−=−qφ(x).
By interchanging the order of integrations of Eqs. (7), (8), and (9), the ion densities are obtained as
ni(x)=2 L
0
dxi ∞
qϕ(xi)
dEi
1 υi(x,Ei)
Si(xi,Ei) υi(xi,Ei),
(13) nv(x)=2
L
0
dxv ∞
Ev0
dEv
1 υv(x,Ev)
Sv(xv,Ev) υv(xv,Ev) ,
(14) ns(x)=2
L
0
dxs ∞
−qφmin
dEs
1 υs(x,Es)
Ss(xs,Es) υs(xs,Es)
+2 L
xmin
dxs −qφmin
−qφ(x)
dEs
1 vs(x,Es)
Ss(xs,Es) υs(xs,Es),
(15) whereEv0 = max{−qφ(x),−qφ(xv)}. As the source
func-tion we use the expression same as the Emmertet al. [8] Si(x,Ei)=
Si0hi(x)
2kTi
exp
−Ei−qφ(x)
kTi ,
(16)
Sv(x,Ev)=
Sv0hv(x)
2kTv
exp
−Ev+qφ(x)
kTv ,
(17)
Ss(x,Es)=
Ss0hs(x)
2kTs
exp
−Es+qφ(x)
kTs ,
(18) where k is the Boltzmann’s constant, Ti, Tv, andTs are
the temperatures, hi(x), hv(x), and hs(x) are the source
strengths, and Si0, Sv0, and Ss0 are the average source
strengths. The averages aboutxofhi(x),hv(x), andhs(x)
are normalized to 1. By substituting Eqs. (16), (17), and (18) to Eqs. (13), (14), and (15) and integrating them for Ei,Ev, andEs, we obtain
ni(x)=
Miπ
2kTi 1/2
Si0 L
0
dxiIi(x,xi)hi(xi), (19)
nv(x)=
Mvπ
2kTv 1/2
Sv0 L
0
dxvIv(x,xv)hv(xv), (20)
ns(x)=
Msπ
2kTs 1/2
Ss0Is(x,L)hs(L), (21)
wherehs(xs)=hs(L) due to the surface produced H−ions
are produced only on the wall surface, and
Ii(x,xi)= ⎧⎪⎪⎪ ⎪⎪⎪⎪⎪ ⎪⎪⎪⎪⎪ ⎪⎪⎪⎪⎪ ⎪⎪⎨ ⎪⎪⎪⎪⎪ ⎪⎪⎪⎪⎪ ⎪⎪⎪⎪⎪ ⎪⎪⎪⎪⎪ ⎩ exp
qφ(xi)−qφ(x) kTi ·erfc ⎡ ⎢⎢⎢⎢⎢ ⎣
qφ(xi)−qφ(x) kTi
1/2⎤ ⎥⎥⎥⎥⎥ ⎦, qφ(xi)>qφ(x), exp
qφ(xi)−qφ(x) kTi
,
qφ(xi)<qφ(x), (22)
Iv(x,xv)= ⎧⎪⎪ ⎪⎪⎪⎪⎪ ⎪⎪⎪⎪⎪ ⎪⎪⎪⎪⎪ ⎪⎪⎨ ⎪⎪⎪⎪⎪ ⎪⎪⎪⎪⎪ ⎪⎪⎪⎪⎪ ⎪⎪⎪⎪⎩ exp −
qφ(xv)+qφ(x) kTv ·erfc ⎡ ⎢⎢⎢⎢⎢ ⎣
−qφ(xv)+qφ(x)
kTv
1/2⎤ ⎥⎥⎥⎥⎥ ⎦, qφ(xv)<qφ(x), exp
−
qφ(xv)+qφ(x)
kTv ,
qφ(xv)>qφ(x), (23)
Is(x,L)= ⎧⎪⎪⎪ ⎪⎪⎪⎪⎪ ⎪⎪⎪⎪⎪ ⎪⎪⎪⎪⎪ ⎪⎨ ⎪⎪⎪⎪⎪ ⎪⎪⎪⎪⎪ ⎪⎪⎪⎪⎪ ⎪⎪⎪⎪⎩ exp
−qφ(L)+qφ(x) kTs ·erfc ⎡ ⎢⎢⎢⎢⎢ ⎣
−qφmin+qφ(x)
kTs
1/2⎤ ⎥⎥⎥⎥⎥ ⎦, x<xmin
exp
−qφ(L)+qφ(x) kTs
,
x>xmin,
(24) where erfc(x) is the complementary error function. For the electron density, we use a Boltzmann distribution
ne(x)=n0exp[eφ(x)/kTe], (25)
for simplicity, wheren0is the electron density atx=0,−e
is the electron charge, andTeis the electron temperature.
Substituting Eqs. (19), (20), (21) and (25) into Poisson’s equation, the plasma-sheath equation is derived
d2φ(x)
dx2 =
n0e ε0
exp
eφ(x) kTe
−Si0q ε0
Miπ
2kTi 1/2
·
L
0
dxiIi(x,xi)hi(xi)
+Sv0q ε0
Mvπ
2kTv 1/2 L
0
dxvIv(x,xv)hv(xv)
+Ss0q ε0
Msπ
2kTs 1/2
Is(x,L)hs(L).
(26) The average source strengthsSi0,Sv0andSs0are
de-termined by the equilibrium of the fluxes of the plasma particles at the wall, that is, jew+ jiw + jvw − jsw = 0
and by defining the production rate of the volume pro-duced H− ion to be βv =Sv0/Si0 and that of the
sur-face produced H− ion to be βs=Ss0/Si0. Where jew,
jiw, jvw, and jsw are the current densities at the wall,
and jew =−en0[kTe/(2πme)]1/2exp[eφw/(kTe)] from je =
(1/4)neeυe,υe = [8kTe/(πme)]1/2 and Eq. (25), jiw =
qSi0Lfrom∇ · ji=qS(x), jvw =−qSv0L, jsw =−qSs0L,
andφwis the wall potential.
Si0=
en0
qL(1+βs−βv)
kTe
2πme 1/2
exp
eφw
kTe
, (27)
Sv0= βv
en0
qL(1+βs−βv)
kTe
2πme 1/2
exp
eφw
kTe
Ss0= βs
en0
qL(1+βs−βv)
kTe
2πme 1/2
exp
eφw
kTe
. (29)
3. Numerical Solutions
Since Eq. (26) cannot be solved analytically, it is solved numerically. We introduce the normalized vari-ables such asη = (q/kTe)(φw−φ), s = x/L,s = x/L,
sv =xv/L,ss=xs/L,τi=Te/Ti,τv=Te/Tv,τs =Te/Ts,
andZ =q/e, whereZ =1 for the hydrogen plasma. The boundary conditions are dη/ds|s=0 =0 andη(s =1) =0.
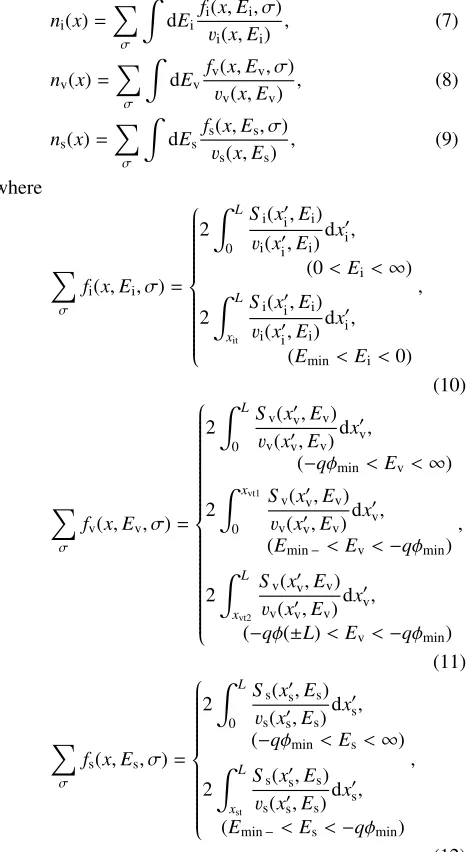
The profile of the normalized electric potentialΦ(s)=−η for various values of the production amount of the volume produced H−ion to the H+ion is shown in Fig. 3, where τ=2,τs =5,τv =2.5,βs =0.4, andλD/L =5×10⁻²,
whereλD is the Debye length. We will use the value of λD/L=5×10−2in all results of this paper. Although the
ef-fect of the volume produced H−ion is not large, as the pro-duction rateβv increases, the electric potential difference
between the PG and the inside decreases. It seems that this is because the electrons toward the PG surface decrease due to the volume produced H−ions, as a result, the poten-tial drop decreases. The profile of the normalized electric potential for various values of the production amount of the surface produced H−ion to the H+ion is shown in Fig. 4, whereβv = 0.2 and the values ofτ,τs, andτv are same
with Fig. 3. The electric potential is qualitatively almost the same as that without the volume produced H−ions [9], that is, as the production rateβsincreases a negative peak
is appeared near the PG surface, although the electric po-tential is a little low due to the volume produced H−ions.
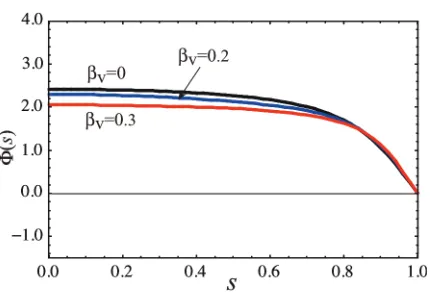
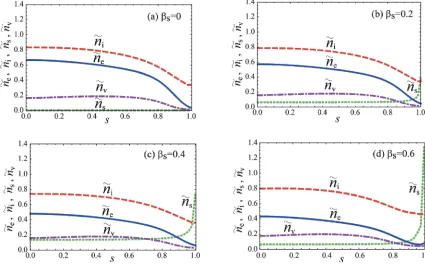
The density distributions of the plasma particles are derived from Eqs. (19), (20), (21), (25) and the electric po-tential. The profile of the plasma density normalized by a sum of the H+ ion density and the H− ion density at s = 0, that is, ni(0)+nv(0)+ns(0), for cases ofβv = 0,
0.1, 0.2, and 0.3 is shown in Fig. 5, where other parameters are same with Fig. 3. It is shown that the plasma density strongly depends on the production rate of the volume pro-duced H−ion. As the value ofβvincreases, the density of
other particles decreases, especially the electron density. As a result, the region consisting of the H+ ions and the H− ions more than the electrons appears near the extrac-tion region. The profile of the normalized plasma density for cases ofβs = 0, 0.2, 0.4, and 0.6 is shown in Fig. 6,
where other parameters are same with Fig. 4. The effect of the production rate of the surface produced H−ions on the particle density is qualitatively almost the same with that without the volume produced H− ions [9], that is, as the value ofβsincreases the double ion plasma layer is formed
near the PG surface, although the electron density is low in whole of the extraction region due to the volume produced H− ions, which is also found from comparison between Fig. 5 (a) and Fig. 6 (c).
The effects of the temperature of the volume produced H−ion and the surface produced H−ion on the electric po-tential distribution and the density distribution of other
par-Fig. 3 Profile of the normalized electric potential for various values ofβvwithτ=2,τv=2.5,τs=5,βs=0.4.
Fig. 4 Profile of the normalized electric potential for various values ofβswithτ=2,τv=2.5,τs=5,βv=0.2.
ticles are small. In the case of the temperature of the vol-ume produced H−ion is low, that is,τvis large, the density
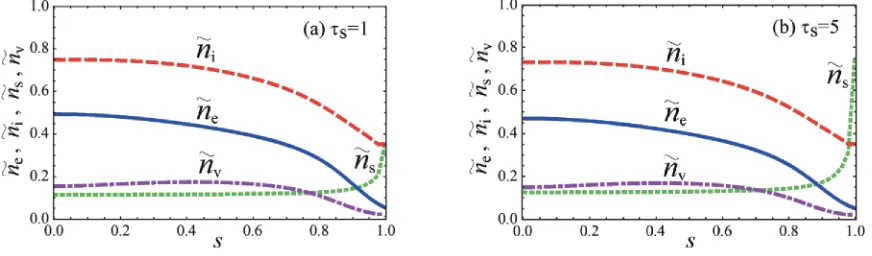
of the volume produced H−ion near the extraction region becomes large except for near the PG surface as shown in Fig. 7. It seems that this is because the low energy volume produced H−ions are moved to interior of the ion source by the sheath potential. In the case of the temperature of the surface produced H−ion is low, that is,τsis large, the
density of the surface produced H−ion near the PG surface becomes large as shown in Fig. 8. It seems that this is be-cause the low energy surface produced H−ions produced on PG surface are difficult to move and stay near the PG surface, as a result the density of the surface produced H− ion becomes large near the PG surface.
4. Conclusions
Fig. 5 Profile of the normalized plasma densitiy for various values ofβv, withτ=2,τv=2.5,τs=5,βs=0.4.
Fig. 6 Profile of the normalized plasma density for various values ofβs, withτ=2,τv=2.5,τs=5,βv=0.2.
the electron density is particularly decreased and the region where the H+ions and H− ions exist more than the elec-trons appears near the extraction region. The effect of the surface produced H−ions on the distributions of the elec-tric potential and the plasma density is qualitatively almost same as the result for the case that the volume produced H−
Fig. 7 Profile of the normalized plasma density for cases of (a)τv=1 and (b)τv=5, withτ=2,τs=5,βv=0.2,βs=0.4.
Fig. 8 Profile of the normalized plasma densities for case of (a)τs=1 and (b)τs=5, withτ=2,τv=2.5,βs=0.4,βv=0.2.
[1] H. Amemiya, B.M. Annaratone and J.E. Allen, J. Plasma Phys.60, 81 (1998).
[2] R. McAdams and M. Bacal, Plasma Source Sci. Technol.19, 042001 (2010).
[3] D. Wunderich, R. Gutser and U. Fantz, Plasma Source Sci. Technol.18, 045031 (2009).
[4] R. McAdams, A.J.T. Holmes, D.B. King and E. Surrey, Plasma Source Sci. Technol.20, 035023 (2011).
[5] F. Taccogna, P. Minelli, S. Longo, M. Capitelli and R.
Schneider, Phys. Plasmas17, 063502 (2010). [6] A. Hatayama, Rev. Sci. Instrum.79, 02B901 (2008). [7] K. Tsumori, H. Nakano, M. Kisaki, K. Ikeda, K. Nagaokaet
al., Rev. Sci. Instrum.83, 02B116 (2012).
[8] G.A. Emmert, R.M. Wieland, A.T. Mense and J.N. David-son, Phys. Fluids23, 803 (1980).