AbSTrACT
This study aimed to prove the influence of internal auditors on audit delay and also to prove the moderate effect of audit complexity and firm size on the influence of internal auditors on audit delay. This research was conducted on all public companies listed in the Indonesia Stock Exchange during 2013 until 2015. The study found that the audit delay of public companies ranges from 6 days to 179 days. The results showed that internal auditors, audit complexity, and firm size proved to have an effect on audit delay. The results also show that only firm size has a moderating effect on the influence of internal auditors on audit delay.
Keywords: Audit delay, audit complexity, firm size, internal auditor
MOdERaTiON EffECT Of fiRM SiZE aNd
audiT COMPlEXiTy ON ThE iNfluENCE Of
iNTERNal audiTOR ON audiT dElay
rediyanto Putra, Sumadi and berlina Yudha Pratiwi
Public Sector Accounting Department, Politeknik Negeri Jember, East Java, Indonesia
E-mail: [email protected]
ArTIClE InFO
Article History:
202
Asia-Pacific Management Accounting Journal, Volume 13 Issue 2
iNTROduCTiON
Submission of financial statements to public companies is an obligation that must be done because of agency relationship. Financial statements are a measurement, assessment, and simultaneous form of supervision over the performance of agents in maximizing the welfare of the principals (Jamaan, 2008). Financial statements have become a form of management assertion reports to minimize agency problems that may arise. An agency problem will arise when the manager (agent) is not optimal in creating corporate profits but just maximizing the interests and personal satisfaction (rahma and Sembiring, 2014).
The company’s financial statements should be audited first to provide a high level of trust to the principal. An audit turns financial statements into a form of supervision that aims to minimize agency problems and add value to the company (Mills, 1990). Audit of financial statements is also an obligation for public companies and has been regulated in BAPEPAM LK Decree No. 134 / BL / 2006 (Number X.K.6). This regulation provides that financial statements should meet existing accounting standards and be audited by public accountants.
Moderation Effect of Firm Size and Audit Complexity
Asia-Pacific Management Accounting Journal, Volume 13 Issue 2
2
INTrODUCTION
Submission of financial statements to public companies is an obligation that must be done because of agency relationship. Financial statements are a measurement, assessment, and simultaneous form of supervision over the performance of agents in maximizing the welfare of the principals (Jamaan, 2008). Financial statements have become a form of management assertion reports to minimize agency problems that may arise. An agency problem will arise when the manager (agent) is not optimal in creating corporate profits but just maximizing the interests and personal satisfaction (Rahma and Sembiring, 2014).
The company's financial statements should be audited first to provide a high level of trust to the principal. An audit turns financial statements into a form of supervision that aims to minimize agency problems and add value to the company (Mills, 1990). Audit of financial statements is also an obligation for public companies and has been regulated in BAPEPAM LK Decree No. 134 / BL / 2006 (Number X.K.6). This regulation provides that financial statements should meet existing accounting standards and be audited by public accountants.
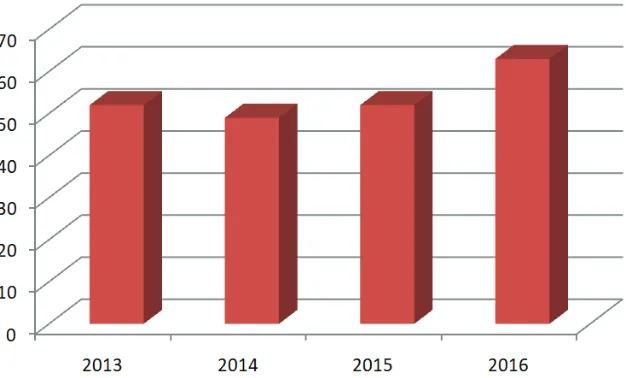
The obligation to submit the audited financial statements is a problem for the company. Companies must be able to present reliable and timely financial statements, although essentially the timing of the submission of the financial statements is determined from the time it takes for an independent auditor to audit. This eventually leads to a phenomenon called audit delay. The delay audit is the time span required by the independent auditor to complete the auditing process from 31 December to the date contained in the independent auditor's report (Rachmawati, 2008). The audit delay phenomenon can be a problem in the event of a time span that is too long and exceeds the time specified in the
prescribed rules. Figure 1 below shows the number of public companies in Indonesia that are
late in submitting financial reports during 2013 to 2016.
Figure 1: Number of Audit Delay in Indonesia
Source: Nabhani (2013), Hasniawati (2014), Nabhani (2015), Melani (2016) Source: Nabhani (2013), Hasniawati (2014), Nabhani (2015), Melani (2016) figure 1: Number of audit delay in indonesia
Figure 1 above shows that the number of companies experiencing delays in the delivery of financial statements is quite large. Therefore, the phenomenon of audit delay in Indonesia is necessary and interesting to be investigated more deeply.
204
Asia-Pacific Management Accounting Journal, Volume 13 Issue 2
research from rachmawati (2008); Apadore and noor (2013) are different in that the internal auditor does not affect an audit delay. The inconsistent results from previous studies prove that the influence of internal auditors on audit delay still needs to be tested again.
This study aims to test the influence of internal auditors on audit delay. This study will add moderation variables to answer the inconsistencies of previous research results. Solihin and Ratmono (2011) state that the moderation variable is able to change the strength or direction of the relationship between two variables. The moderation variables to be used in this study are the complexity of the audit and firm size.
The audit complexity and firm size used as a moderating variable in this study are based on the contingency theory. Fisher (1998) says that the design of the company’s control system is determined from contingency variables in the organizational context. Thus, the audit process as a company’s control system also needs to pay attention to the organizational context. The use of audit complexity and firm size as a moderating variable is also because both of these variables have been shown to have an effect on audit delay. Alkhatib and Marji (2012) have successfully proven that firm size has a negative impact on audit delay. The results of Apriyanti and Santosa (2014) suggest that audit complexity has a positive effect on audit delay.
liTERaTuR REViEw aNd hyPOThESES
dEVElOPEMENT
Moderation Effect of Firm Size and Audit Complexity
auditors’ members and experience influences the timeliness. Based on the explanation, this study hypothesis that:
H1: Internal auditors have an effect on audit delay
The influence of internal auditors on audit delay is basically also determined by the contingency variables owned by the company. This is because the internal auditor is a unit formed to perform internal control. Fisher (1998) says that the design of the company’s control system is determined from the contingency variables in the organizational context. Audit complexity and firm size are contingency variables that can determine the effect of internal auditors on audit delay. The audit complexity of a company is determined by the number of subsidiaries owned. Ahmad and Abidin (2008) explained that the number of subsidiaries impacts on the more complex audit tasks of its operations. Company size also has a negative impact on the influence of internal auditors on audit delay. Kurniawan (2011) states that firm size becomes the determinant of operational complexity, variability and intensity of corporate transactions. Thus, companies with a large number of subsidiaries and company size will make the internal auditor’s task more difficult in conducting the evaluation process of operational activities and detecting deviations in its entirety. This will ultimately lead to the influence of internal auditors in shortening audit delay time. This is because companies with larger sizes and large audit complexity will have more complicated control systems, which will increase the difficulty of internal auditor duties. Putra (2017) states that high audit complexity will make the evaluation process and controls performed by internal auditors become more difficult. Based on the explanation, the first hypothesis of this research is as follows:
H1: Internal auditors have an effect on audit delay H2: Audit complexity has an effect on audit delay H3: Company size has an effect on audit delay
H4: Audit complexity moderates the influence of internal auditors on audit delay
206
Asia-Pacific Management Accounting Journal, Volume 13 Issue 2
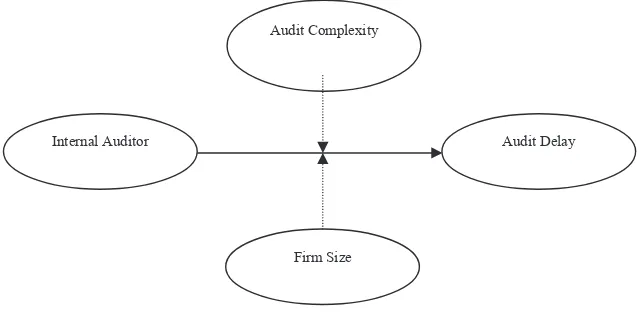
figure 2: Research Model
METhOdOlOgy
This is a basic research. Jogiyanto (2011: 7) states that basic research begins by conducting hypothesis testing, deeper review, and conclusions. The population of this study is a public company listed on the Indonesia Stock Exchange (IDX), while the sample in this study is determined by the purposive sampling technique. The criteria used to determine the sample in this study are as follows:
1. Public companies listed on the Indonesia Stock Exchange from 2013 to 2015.
2. Annual reports and financial statements of public companies are available for access
3. The Company presents all the necessary data for this study
This research data obtained from the website of the Indonesia Stock Exchange is www.idx.co.id.The operational definition of variables in this study is presented briefly in Table 1 below.
Moderation Effect of Firm Size and Audit Complexity
Figure 2: research Model METHODOLOGY
This is a basic research. Jogiyanto (2011: 7) states that basic research begins by conducting hypothesis testing, deeper review, and conclusions. The population of this study is a public company listed on the Indonesia Stock Exchange (IDX), while the sample in this study is determined by the purposive sampling technique. The criteria used to determine the sample in this study are as follows:
1. Public companies listed on the Indonesia Stock Exchange from 2013 to 2015.
2. Annual reports and financial statements of public companies are available for access 3. The Company presents all the necessary data for this study
This research data obtained from the website of the Indonesia Stock Exchange is www.idx.co.id.The operational definition of variables in this study is presented briefly in Table 1 below.
Variable Operational Definition
Audit Delay (AD) The difference between the date of the closing year of the financial report to the date indicated in the independent audit report.
Internal Auditor (AI) The number of internal audit members of a company Audit Complexity (KA) The number of subsidiaries owned by a public company
Firm Size (UP) The natural logarithm value of the total assets of the company.
Source: Data processed
The statistical test that will be done in this research is the descriptive statistic test and the Moderating Regression Analysis (MRA) test. The form of regression model equation in this research is as follows:
Internal Auditor
Audit Complexity
Firm Size
Moderation Effect of Firm Size and Audit Complexity
Table 1: Operational Definition of Variables
Variable Operational Definition
Audit Delay (AD) The difference between the date of the closing year of the
financial report to the date indicated in the independent
audit report.
Internal Auditor (AI) The number of internal audit members of a company Audit Complexity (KA) The number of subsidiaries owned by a public company
Firm Size (UP) The natural logarithm value of the total assets of the
company.
Source: Data processed
The statistical test that will be done in this research is the descriptive statistic test and the Moderating Regression Analysis (MRA) test. The form of regression model equation in this research is as follows:
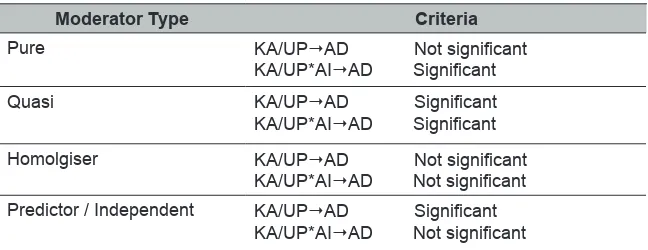
The hypothesis testing was in accordance with the rules of Baron and Kenny. According to the rules, the hypothesis will be accepted if the p-value ≤ 0.05. referring to Sugiono (2004), the types of moderation variables were classified based on the following conditions:
Table 2: Classification of Moderate Variables
Moderator Type Criteria
Pure KA/UPAD Not significant
KA/UP*AIAD Significant
Quasi KA/UPAD Significant
KA/UP*AIAD Significant
Homolgiser KA/UPAD Not significant
KA/UP*AIAD Not significant
Predictor / Independent KA/UPAD Significant
208
Asia-Pacific Management Accounting Journal, Volume 13 Issue 2
RESulT
description of Research Sample
The number of end companies used in this study were 130 firms. The companies were studied for three periods, from 2013 to 2015, so that the number of observations made in this research is 390 cases. The non-financial industry sector in this research is the most dominant industry sector with 100 companies and the rest are financial services companies. The selection process of the research sample is shown in Table 3 below:
Table 3: Selection Process of Research Samples
description
Companies in BEI until 2016 539
Companies not listed on BEI during 2013-2015 (80)
Companies whose data cannot be accessed (57)
Companies that do not provide complete research data (266)
Companies with outlier data (6)
Companies that can become sample of research 130
Source: Data processed
The first test was a descriptive statistical test. The results of this study indicate that the audit delay range that occurred in 390 observations made ranges from 6 days to 179 days. This indicates that there are still audit delays that exceed the time set by existing regulations. The following Table 4 presents the results of the descriptive statistics test.
Table 4: descriptive Statistic
Variable Total (N) N. Min N. Max Average Standard
Deviation
AD 390 6 179 70,78 22,826
AI 390 1 194 19,96 35,576
KA 390 0 33 5,02 5,886
UP 390 4,595 13,721 8,75 1,828
Moderation Effect of Firm Size and Audit Complexity
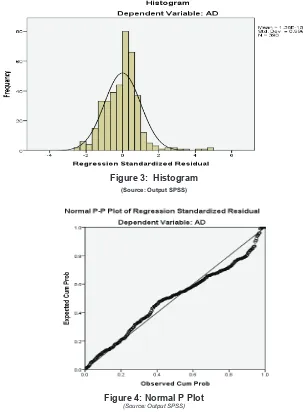
The second test conducted after the descriptive statistics is the classical assumption test. The first classical assumption test is the normality test. This test aims to determine the level of normality of the distribution of the research data. The normality test in this study was done by the histogram test and normal test p plot. Figure 3 and Figure 4 below show the results of the normality test.
figure 3: histogram
(Source: Output SPSS)
210
Asia-Pacific Management Accounting Journal, Volume 13 Issue 2
Figure 3 shows that the lines on the histogram graph tend to the right, so this indicates that the data is normally distributed. Figure 4 also shows that the existing point d P-Plot approaches the midline, so this also indicates that the data is normally distributed.
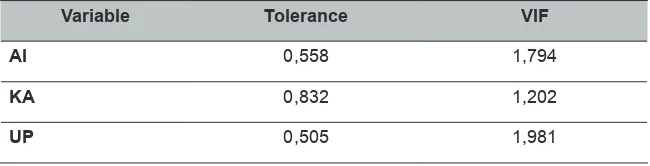
The next classical assumption test is multicollinearity test. The basis of the multicollinearity test is the value of the Variance Inflation Factor (VIF). Table 5 below shows the VIF value of this study:
Table 5: Multicollinearity Testing
Variable Tolerance Vif
ai 0,558 1,794
Ka 0,832 1,202
uP 0,505 1,981
Source: Output SPSS
Table 5 above shows that the regression model in this study has passed the multicollinearity test. This is evidenced when the VIF value of the three independent variables of research is less than 10. Therefore, multicollinearity symptoms did not occur.
The third test of the classical assumption is the heteroscedasticity test. Figure 5 below shows an image of the scatter plot in this study. The picture shows that there are no symptoms of heteroskedasticity because scatter plots produced are irregular and do not form a model.
Moderation Effect of Firm Size and Audit Complexity
The last test conducted from the classical assumption test in this study was the autocorrelation test. The basis of this autocorrelation test is the Durbin-Watson value. The Durbin-Watson value of the autocorrelation test in this study should be between the dl (Durbin Lower) and du (Durbin Upper) values. This study used 3 independent variables (K = 3) and n = 390, so the dl value is 1.6861 and du is 1.8522. The result of the autocorrelation test in this study is shown by a Durbin Watson value of 1.813. Thus, the dw value in this study lies between dl and du. This shows that in this study there is no autocorrelation.
hypothesis Testing
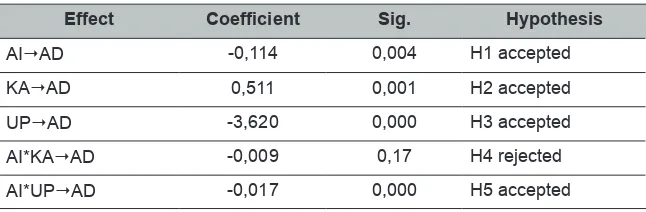
The last test after the classical assumption test is hypothesis testing. The results of hypothesis testing in this study are shown in Table 6 below:
Table 6: hypothesis Testing
Effect Coefficient Sig. hypothesis
AIAD -0,114 0,004 H1 accepted
KAAD 0,511 0,001 H2 accepted
UPAD -3,620 0,000 H3 accepted
AI*KAAD -0,009 0,17 H4 rejected
AI*UPAD -0,017 0,000 H5 accepted
Source: Output SPSS
The hypotheses accepted in this research are H1, H2, H3, and H5. The hypothesis rejected in this study is H4. Based on the result of hypothesis testing, the final equation is:
212
Asia-Pacific Management Accounting Journal, Volume 13 Issue 2
Table 7: f Testing
T Sig information
27,276 0,000 Significant
Source: Output SPSS
diSCuSSiON
The results of indicate that internal auditors proved to have a negative effect on audit delay. This is evidenced by the coefficient value of -0.057 and a significant value of 0.002. The results imply that the greater the number of members of the company’s internal auditors, the shorter the audit delay time that occurred. The results proved that internal auditors could reduce the problem of irregularities in the financial statements as a result of the existence of agency problems and improved the quality of corporate financial statements. The results supportthe results of research by Suharni et al (2013), but the results study did not support the results of research from Rachmawati (2008) and Apadore and Noor (2013).
The results also showed that audit complexity and firm size had an effect on audit delay. Audit complexity proved to have a positive effect on audit delay as evidenced by the coefficient value of 0.255 and significant at 0.0005, while firm size proved to have a negative effect with coefficient of -1.81 and significant at 0.000. The results proved that audit complexity and firm size were contingency variables that affected the audit delay time frame. This implies that firms with large sizes would tend to have short audit delay ranges, whereas firms with many subsidiaries would tend to have long audit delay times. The results of this study support the results of research from Alkhatib and Marji (2012); Apriyanti and Santosa (2014).
Recent research found that moderation effects were only found in firm size variables. This was evidenced by the coefficient value of -0.017 and significant at 0.000. This result implies that the moderating effect of firm size was negative which means that the larger the size of the firm the smaller the influence of the internal auditor on audit delay. This was because companies with larger sizes had greater operational complexity, variability, and transaction intensity, thus increasing the difficulty of internal auditor duties (Kurniawan, 2011). The moderation effects of firm size were also
Moderation Effect of Firm Size and Audit Complexity
quasi-because firm size had a direct influence on audit delay and also has a significant moderating effect as well.
CONCluSiON
The results showed that internal auditors, audit complexity, and firm size proved to affect audit delay. However, the moderation effect of this study was only evident from firm size alone, while audit complexity was not shown to have a moderating effect. The implication of this research was the need to improve the quality of internal auditors in public companies listed on the Indonesia Stock Exchange. Limitations of this study need to be considered to be the basis for research development in subsequent research. The limitations of this study include data on the number of members of internal auditors was still very difficult to find on the company’s annual report. Future research can combine secondary data with data obtained directly from the company to overcome this problem. In addition, due to outlier data limited data was used to run the analysis. Further research is expected to minimize the existence of outlier data in research with the use of the STATA software.
REfERENCES
Alkhatib, K & Marji, Q. (2012). Audit reports timeliness: Empirical evidence from Jordan. Procedia - Social and Behavioral Sciences, 62,
1342 – 1349.
Apadore, K & Noor, M.M. (2013). Determinants of audit report lag and corporate governance in Malaysia. International Journal of Business and Management, 8(15), 151-163.
Apriyanti & Santosa, S. (2014). Pengaruh atribut perusahaan dan faktor audit terhadap keterlambatan audit pada perusahaan yang terdaftar di Bursa Efek Malaysia. Jurnal Akuntansi dan Keuangan, 16,(2), 74-87.
214
Asia-Pacific Management Accounting Journal, Volume 13 Issue 2
tentang Pembentukan dan Pedoman Penyusunan Piagam Unit Audit Internal.
Fisher, G. J. (1998). Contingency theory, management control system and firm outcomes: Past results and future directions. Behavioural Research in Accounting, 10, 47-64.
Hajiha, Z & rafiee, A. (2011). The impact of internal audit quality on audit delays. Middle-East Journal of Scientific Research, 10(3), 389-397.
Hasniawati, A. P. (2014). 49 Emiten yang Kena Sanksi BEI. Accessed at http://investasi.kontan.co.id/news/ini-dia-49-emiten-yang-kena-sanksi-bei.
Jamaan. (2008). Pengaruh Mekanisme Corporate Governance dan Kualitas Kantor Akuntan Publik terhadap Integritas Informasi Laporan Keuangan. Universitas Diponegoro: Semarang.
Jogiyanto, HM. (2011). Konsep dan Aplikasi Structural Equation Modeling Berbasis Varian dalam Penelitian Bisnis. UPP STIM YKPn: Yogyakarta.
Keputusan Ketua Badan Pengawas Pasar Modal dan Lembaga Keuangan Nomor Kep-06/BL/2006 Tentang Kewajiban Penyampaian Laporan Keuangan Berkala.
Kurniawan, D. (2011). Faktor-Faktor yang Mempengaruhi Audit Delay (Studi Empiris pada Perusahaan Manufaktur yang Terdaftar di Bursa Efek Indonesia). Master’s Thesis. Universitas Brawijaya Fakultas Ekonomi dan Bisnis Program Magister Akuntansi.
Melani, A. (2016). Belum Sampaikan Laporan Tahunan, BEI Beri Sanksi ke 63 Emiten. Accessed at http://bisnis.liputan6.com/read/2532990/ belum-sampaikan-laporan-tahunan-bei-beri-sanksi-ke-63-emiten.
Moderation Effect of Firm Size and Audit Complexity
Nabhani, A. (2013). BEI Rilis 52 Emiten Telat Laporan Keuangan 2012. Accessed at http://www.neraca.co.id/article/27070/bei-rilis-52-emiten-telat-laporan-keuangan.
Neraca, H. E. (2015). Payah, 52 Emiten Telat Laporkan Keuangan.
Accessed at http://www. neraca. co. id/article/52481/payah-52-emiten-telatlaporkan-keuangan.
Putra, R. (2017). Determinan audit delay perusahaan yang terdaftar di bursa efek Indonesia (Master’s thesis, Universitas Brawijaya). Retrieved from http://repository.ub.ac.id/id/eprint/1277.
rahmah, n. A., & Sembiring, F. M. (2014). Suatu Tinjauan Teori Keagenan: Asimetri Informasi dalam Praktik Manajemen Laba. Proceedings SNEB, 1-6.
rachmawati, S. (2008). Pengaruh Faktor Internal dan Eksternal Perusahaan Terhadap Audit Delay dan Timeliness. Jurnal Akuntansi dan Keuangan,
10(1), 1-10.
Solihin, M & Ratmono, D. (2013). Analisis SEM-PLS dengan WarpPLS 3.0 untuk Hubungan Nonlinier dalam Penelitian Sosial dan Bisnis.
Penerbit Andi: Yogyakarta.
Sugiono. (2004). Konsep, identifikasi, alat analisis dan masalah penggunaan variabel moderator. Jurnal Studi Manajemen dan Organisasi, 1(2), 61-70.