http://www.sciencepublishinggroup.com/j/ajce doi: 10.11648/j.ajce.20170504.12
ISSN: 2330-8729 (Print); ISSN: 2330-8737 (Online)
Structural Evaluation of the Effect of Pulverized Palm
Kernel Shell (PPKS) on Cement-Modified Lateritic Soil
Sample
Olutaiwo Adewale
1, *, Ajisafe Segun
1, Adanikin Ariyo
21
Department of Civil and Environmental Engineering, University of Lagos, Akoka, Nigeria 2Department of Civil and Environmental Engineering, Elizade University, Ilara-Mokin, Nigeria
Email address:
[email protected] (O. Adewale) *Corresponding author
To cite this article:
Olutaiwo Adewale, Ajisafe Segun, Adanikin Ariyo. Structural Evaluation of the Effect of Pulverized Palm Kernel Shell (PPKS) on Cement-Modified Lateritic Soil Sample. American Journal of Civil Engineering. Vol. 5, No. 4, 2017, pp. 205-211. doi: 10.11648/j.ajce.20170504.12
Received: April 20, 2017; Accepted: May 2, 2017; Published: June 19, 2017
Abstract:
There have been global efforts to reduce environmental pollution of agricultural and industrial waste products by utilizing such wastes as stabilizing agents to improve soils for various uses, especially road construction. In this research, lateritic soil sample obtained from a borrow pit was tested with varying percentages of Pulverized Palm Kernel Shell (PPKS). The soil was classified as A-6 (AASHTO classification) using standard soil laboratory tests. Laboratory tests such as Atterberg Limits, Compaction, Unconfined Compressive Strength (UCS) and California Bearing Ratio (CBR) were conducted on the soil + PPKS mix only and also on soil + PPKS + 3% Ordinary Portland Cement (OPC) mix. The liquid limit (LL) and plasticity index (PI) values decreased steadily with increase in PPKS while the plastic limit (PL) value increased with up to 4% PPKS addition after which the values started decreasing. The shrinkage limit (SL) value increased with a peak value at 8% PPKS addition after which the values began to decrease. The Optimum Moisture Content (OMC) results on PPKS addition increased from 16% to 19.5% while the Maximum Dry Density (MDD) decreased by 45.18% from 1.669g/m3 to 0.915g/m3. Addition of PPKS decreased the Unsoaked CBR by 10.79% from 68.60 to 61.20% while the Soaked CBR increased by 74.12% from 18.05% to 69.75%. UCS values for the lateritic soil and PPKS for the uncured sample, at 7 days and 14 days had peak values of 85.03, 96.46 and 100.44 respectively. From the study, it can be concluded that the properties of the Lateritic soil improved when stabilized with Cement and pulverized palm kernel shell compared to when it was stabilized with pulverized palm kernel shell alone.Keywords:
Pulverized Palm Kernel Shell, Ordinary Portland Cement, Stabilization, CBR1. Introduction
Domestic and industrial wastes are generated every day and in large quantities and the safe disposal of these waste materials are increasingly becoming a major concern around the world [1, 2, 3]. Palm Kernel Shell (PKS) is regarded as a waste from oil processing [4, 5]. It has been shown that approximately 15 to 18 tonnes of fresh fruit bunches are produced per hectare per year and PKS comprises about 64% of the bunch mass [6, 7]. It is observed that in developing countries, Nigeria inclusive, waste PKS is either burnt to supply energy at palm oil mills or left in piles to compost.
These waste products, if properly treated, could be
2. Study Methodology
The palm kernel shells (PKS) used in this study were collected from Oje village, Ibadan, Oyo state, Nigeria with coordinates 7.3775°N, 3.9470°E. The lateritic soil was obtained from KM 48 Lagos-Ibadan expressway, Redemption camp, Ogun State, Nigeria. The soil samples were taken at depth of 2m from the ground surface. The cement used was Ordinary Portland Cement (OPC) obtained from Lafarge/West Africa Portland Cement Company, Ewekoro in Ogun State, with properties in accordance with BS 12 (1991).
The laboratory tests carried out on the natural soil include Particle size distribution (Sieve analysis), Natural moisture content, Atterberg limits, Compaction and California Bearing Ratio (CBR). The geotechnical properties of the soil were determined in accordance with B.S 1377 while the stabilization tests were performed in accordance with B.S 1924. Specimens for California Bearing Ratio (CBR) tests were prepared at the Optimum Moisture Contents (OMC) and Maximum Dry Densities (MDD).
Chemical Composition of Materials Used
The chemical compositions of the materials used in this study are shown in Table 1.
Table 1. Chemical Composition of Laterite, Cement and PPKS.
LATERITE CEMENT PPKS
Mineral Composition Percentage Composition (%)
Mineral Composition
Percentage Composition (%)
Mineral Composition
Percentage Composition (%)
SiO2 64.27 SiO2 24.01 SiO2 55.32
Al2O3 16.41 Al2O3 26.22 Al2O3 10.74
Fe2O3 7.04 Fe2O3 0.017 Fe2O3 8.11
TiO2 1.06 TiO2 ND SO3 4.05
CaO 0.23 CaO 41.82 CaO 6.43
K2O 4.07 K2O 0.049 K2O 4.64
MgO 1.55 MgO 0.7 MgO 3.93
T2O5 0.17 T2O5 ND SiO₂ + Fe₂O₃ + Al₂O₃ 74.14
3. Results and Discussion
The results of the preliminary tests on the soil sample only are shown in Table 2.
Table 2. Results of Preliminary Tests on Soil.
RESULTS OF PRELIMINARY TESTS ON SOIL
NATURAL MOISTURE CONTENT (%) 10.09
SPECIFIC GRAVITY 2.51
LIQUID LIMIT (%) 37.25
PLASTIC LIMIT (%) 22.20
PLASTICITY INDEX (%) 15.05
AASHTO CLASSIFICATION A-6
UNIFIED CLASSIFICATION. SYS CL
SOIL TYPE SILTY
COLOUR REDDISH BROWN
GROUP INDEX 4.581706557
According to AASHTO Classification, the laterite is of the A-6 grading based on the LL and PI.
3.1. Atterberg Limits
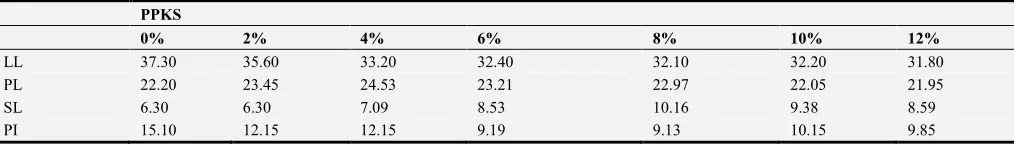
Atterberg Limit tests were conducted to determine the Liquid Limit (LL), Plastic Limit (PL), Shrinkage Limit (SL) and Plasticity Index (PI) of (i) soil + PPKS and (ii) soil + PPKS + 3% OPC. The results are presented in Tables 3 and 4.
Table 3. Atterberg Limits Of Lateritic Soil + PPKS (0% - 12%).
PPKS
0% 2% 4% 6% 8% 10% 12%
LL 37.30 35.60 33.20 32.40 32.10 32.20 31.80
PL 22.20 23.45 24.53 23.21 22.97 22.05 21.95
SL 6.30 6.30 7.09 8.53 10.16 9.38 8.59
Table 4. Atterberg Limits of Lateritic Soil + PPKS + 3% OPC.
PPKS
0% 2% 4% 6% 8% 10% 12%
LL 34.71 36.53 35.20 34.7 33.41 33 32.6
PL 24.30 24.48 23.20 22.82 20.54 20.09 18.04
SL 7.75 7.75 7.81 6.25 7.03 7.03 9.30
PI 10.41 12.05 12.00 11.88 12.91 12.91 14.56
3.1.1. Liquid Limit (LL) Test
The effects of PPKS on the LL of the soil sample are presented in Fig. 1. With increase in PPKS content, there was
a decrease in LL from 37.3% (at 0% PPKS) to 31.80% (at 12 % PPKS) and also decrease for the PPKS + 3% Cement from 34.71% to 32.6%.
Figure 1. Graph of Liquid Limit Results of Soil + PPKS (and 3% OPC).
In the study carried out by [9], he stated that the nature of mineral present in a soil type determines its cation exchange capacity and hence, the effect that the addition of soil stabilizers will have on the Atterberg Limits. Thus, this validates the findings of [10] that the predominance of kaolinite with its low cation exchange capacity in the lateritic soils of Southwest
Nigeria result in the Liquid Limit values obtained.
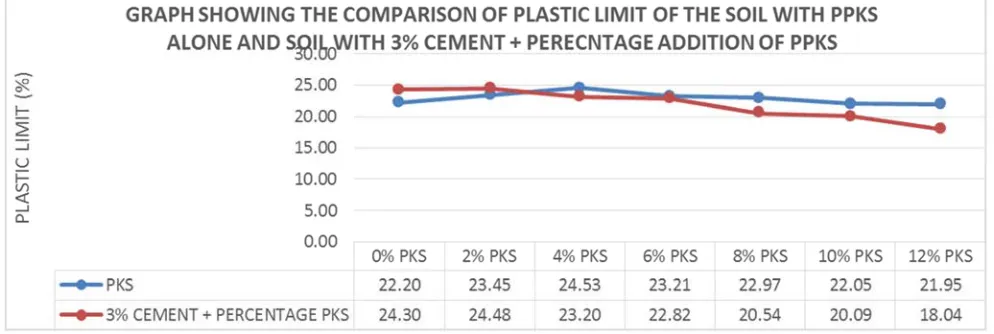
3.1.2. Plastic Limit (PL) Test
As shown in Fig 2, there was reduction in the PL from 22.20% to 21.95%. For the PPKS+ 3% OPC soil admixture, the reduction was from 24.30% to 18.04%.
Figure 2. Graphs of Plastic Limit Results of Soil + PPKS (and 3% OPC).
This is because of the fact that, as the quantity of PPKS and OPC in the mix increased, the amount of soil to be flocculated decreased and also the finer particles of PPKS may be incorporated in the voids of flocculated soil. This leads to the decrease in the water held in the pores, thus leading to the decrease of the plastic limit.
3.1.3. Shrinkage Limit (SL) Test
PPKS + Cement is 7.75% and the value increased to 9.30% at 10% PPKS + Cement.
Figure 3. Graphs of Shrinkage Limit Results of Soil + PPKS (and 3% OPC).
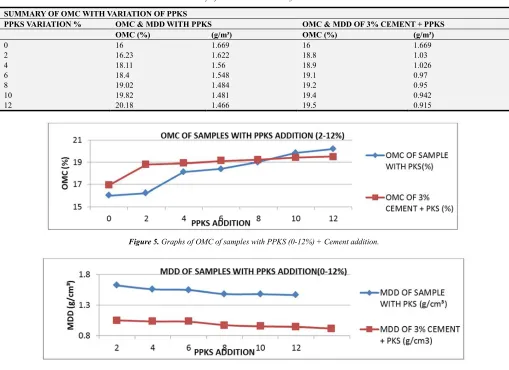
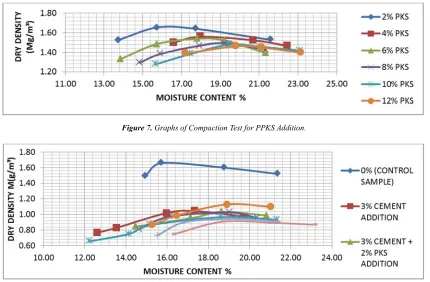
3.2. Compaction Test
The summary of compaction test results is shown in Table 5 and presented graphically in Figures 5 to 8. The natural Optimum Moisture Content (OMC) of the sample was 16.00% with a Maximum Dry Density (MDD) of 1.669 g/cm³. In the
Soil + PPKS sample, the OMC had a peak value of 20.18% at 12% PPKS addition and peak MDD at 0% PPKS (1.669 g/cm³). For the Soil + PPKS + 3% Cement, the value of the OMC was highest at 12% PPKS addition (19.5%) while the MDD was highest at 0% (1.669 g/cm³) respectively.
Table 5. Summary of OMC with Variation of PPKS and Cement.
SUMMARY OF OMC WITH VARIATION OF PPKS
PPKS VARIATION % OMC & MDD WITH PPKS OMC & MDD OF 3% CEMENT + PPKS
OMC (%) (g/m³) OMC (%) (g/m³)
0 16 1.669 16 1.669
2 16.23 1.622 18.8 1.03
4 18.11 1.56 18.9 1.026
6 18.4 1.548 19.1 0.97
8 19.02 1.484 19.2 0.95
10 19.82 1.481 19.4 0.942
12 20.18 1.466 19.5 0.915
Figure 5. Graphs of OMC of samples with PPKS (0-12%) + Cement addition.
Figure 7. Graphs of Compaction Test for PPKS Addition.
Figure 8. Compaction Test Results for Soil with PPKS and 3% Cement Addition.
These results align with findings of [11] on laterite with corn cob ash, [12] on laterite with bamboo leaf ash and [13] with laterite and rice husk ash, where the OMC increased and the MDD decreased as the binder content increased. This behavior is explained for PPKS and lateritic soils in terms of flocculation and agglomeration of the soils forming larger particles with subsequent increase in air voids leading to reduced MDD and increasing OMC. The increase in OMC is also probably due to the additional water held within the flocculent soil structure due to excess water absorbed as a result of the porous property of PPKS.
3.3. California Bearing Ratio (CBR)
The results of soaked and un-soaked California Bearing Ratio (CBR) for lateritic soil treated with PPKS and PPKS +
Cement are shown in Figures 9 and 10 with peak values of 68.60 and 24.95 at 0% and 4% for the unsoaked and soaked soil + PPKS only. The soil+PPKS+3% cement samples had maximum values of 83.20 and 137.25 at 4% for the unsoaked and soaked samples respectively.
These results rhyme with the findings of [14] using laterite and sugarcane straw ash, [15] using coconut husk ash on lateritic soil. The increase in values of CBR may be because of the gradual formation of cementitious compounds in the reaction between the PPKS and some amounts of Calcium hydroxide present in the soil while the decrease in the CBR values may be due to the excess PPKS which was not mobilized in the reaction as the presence of naturally occurring Calcium hydroxide in the soil may be small.
Figure 10. Soaked and Un-Soaked CBR of Soil with PPKS +3% Cement.
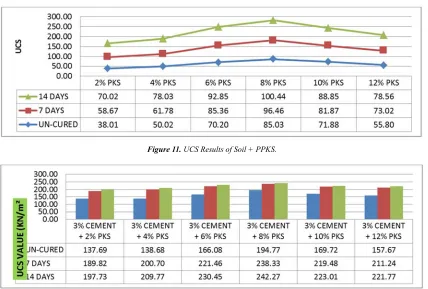
3.4. Unconfined Compressive Strength (UCS)
Variations of the UCS with increase in PPKS from 2 to 12% are as shown in Figures 11 and 12. The values of the UCS for the soil + PPKS admixture for all the samples increased, reaching peak values at 8% PPKS after which they declined. Increasing PPKS above 8% made the soil-admixture behave as low strength filler, effectively
weakening the soil PPKS mixture. This led to reduction in UCS, thus conforming to the findings of [16]. Increase in strength (up to 8% PPKS) was probably due to the coupled effects of flocculation and agglomeration of PPKS together with the neo-formations such as calcium silicate hydrates (CSH) and calcium aluminate hydrates (CAH) that coat and bind the soil particles to produce strong matrices [17].
Figure 11. UCS Results of Soil + PPKS.
Figure 12. UCS Results of Soil + PPKS and 3% Cement.
4. Conclusions
The following conclusions can be made based on the tests results obtained from the Cement.
PPKS stabilized lateritic soil: The properties of the Lateritic soil improved when stabilized with Cement and
percentages of PPKS (and 3% OPC) though the values were higher for PPKS + 3% OPC. Also, there was a decrease in the MDD as the PPKS increases for soil samples with PPKS alone and PPKS + 3% OPC. The UCS values increased as the PPKS percentages increased, both for soil + PPKS only and soil + PPKS + 3% OPC.
The minimum requirements for CBR sub-grade, sub-base and base courses are 10% CBR (soaked), 30% CBR (soaked) and 80% CBR (soaked) indicating the PPKS-stabilized lateritic soil will be most suitable for sub-base while the PPKS + Cement-stabilized lateritic soil will be suitable for base courses. PPKS, when used as an alternative or as a partial replacement of cement in stabilizing lateritic soils can help reduce the cost of construction materials and help solve disposal problems associated with palm kernel shell as an agricultural waste. This acts as a source of income for palm kernel growers and also reduces CO2 emitted during disposal by burning. The results obtained from this work show that pulverized palm kernel shells can be used more profitably as an admixture with a small percentage of conventional stabilizer such as cement.
References
[1] Gardner, K. H. (2011). “Life Cycle Perspectives of Recycled Materials use in Civil Engineering.” Program and Abstracts of ASTM International Symposium on Testing and specification of Recycled Materials for Sustainable Geotechnical Construction, Baltimore, U.S.A. p. 53.
[2] Gomes, C. A., Reis, F. S. & Fortunato, E. (2011). “Case Study to Promote the use of Byproducts: The Relevance of Performance Tests.” Program and Abstracts of ASTM International Symposium on Testing and specification of Recycled Materials for Sustainable Geotechnical Construction, Baltimore, U.S.A., p. 25
[3] Hossain, Z., Solanki, P., Zaman, M., Lewis, A. S. & Hobson, K. (2011). “Influence of Recovery Processes on Properties of Binders and Aggregates Recovered from Recycled Asphalt Pavement.” Program and Abstracts of ASTM International Symposium on Testing and specification of Recycled Materials for Sustainable Geotechnical Construction, Baltimore, U.S.A., p. 13.
[4] Obeng K, Ocran KAG, & Anaba D (1997). Palm Kernel Shell as fuel for burning bricks. Building Resources Info. 2(5), 131-136
[5] Ibhadode, A. O. A, Dagwa, I. M (2008). Development of
asbestos free friction lining material from palm kernel shell.
Journal of Brazilian Society of Mechanical Sciences Engineers. 3(1), 166-173
[6] Obisesan, I. O (2004). Yield, the ultimate crop improvement. Inaugural Lecture Series No 168. Obafemi Awolowo University, Ile-Ife.
[7] Adewumi, I. K (2009). Activated Carbon for water treatment in Nigeria: Problems and prospects, In: Yanful EK (ed). Appropriate technologies for environmental protection in developing Worlds. Netherlands: Springer. 115-122.
[8] Pihl, K. A & Milvang-Jensen, O. (2009). “The Motivation Factors in the Development and Sustainment of a Well-Functioning Recycling Industry for Road and Non-road By-products in Denmark” www.uctc.net/papers/683.pdf
[9] O’Flaherty, C. A. (2002). Highways: The Location, Design, Construction and Maintenance of Pavements. Butterworth-Heinemann, Oxford, UK.
[10] Alao, D. A., (1983). Geology and Engineering Properties of Laterites from Ilorin, Nigeria. Engineering Geology Journal. 19, 111–118, Elsevier Science Publishers, Amsterdam, The Netherlands.
[11] Jimoh, Y. A & Apampa, O. A (2014). An Evaluation of the Influence of Corn Cob Ash on the Strength Parameters of Lateritic Soils. Civil and Environmental Research. 6(5), 1-10 [12] Amu, O. O. & Adetuberu, A. A. (2010). Characteristics of
bamboo leaf ash stabilization on lateritic soil in Highway Construction. International Journal of Engineering and Technology. 2(4), 212-219.
[13] Alhassan, M. (2008) Potentials of rice husk ash for soil stabilization. A. U. Journal of Technology. 246 - 250.
[14] Amu, O. O., Ogunniyi, S. A. & Oladeji, O. O (2011). Geotechnical Properties Of Lateritic Soil Stabilized With Sugarcane Straw Ash. American Journal of Scientific and Industrial Research. 2(2), 323-331.
[15] Oluremi, R. O, Adedokun, S. I & Osuolale, O. M (2012). Effects of Coconut Husk Ash on Stabilization of Poor Lateritic Soils. The Pacific Journal of Science and Technology. 13(2), 499-507
[16] Amadi, A & James, O. (2015). Lateritic Soil Stabilized with Fly Ash as a Sustainable Structural Material for Flexible Pavement Construction. International Engineering Conference (IEC). www.seetconf.futminna.edu.ng. 277-282