10.30880/ijie.2018.10.01.011
*Corresponding author: [email protected]
66
Performance Evaluation of User Independent Score
Normalization Based Quadratic Function in Multimodal
Biometric
Nordiana Mukahar
1,2*, Bakhtiar Affendi Rosdi
11Intelligent Biometric Group,
School of Electrical & Electronic Engineering, Engineering Campus, Universiti Sains Malaysia, 14300 Nibong Tebal, Pulau Pinang, MALAYSIA.
2Faculty of Electrical Engineering,
Universiti Teknologi MARA, 40450 Shah Alam, Selangor, MALAYSIA.
Received 27 October 2017; accepted 9 April 2018, available online 30 April 2018
1. Introduction
Biometric is an automatic user authentication technology, which uses human physiological and /or behavioural characteristics with several desirable properties like universality, distinctiveness, permanence and acceptability [1]. The recognition system that relies on a single trait or also known as unimodal biometric systems endures several problems that can deteriorate the performance of recognition system. Such shortcomings are noisy data, non-universality or lack of uniqueness of the biometric trait, intra-class variations, unacceptable error rates, vulnerable to spoof attacks and lack of flexibility. Multi-biometric systems or multimodal biometric systems utilize multiple traits to overcome the shortcomings or issues in unimodal biometric system. It take advantage of multiple biometric traits to improve the performance in many aspects including accuracy, noise resistance, universality, spoof attacks, and reduce performance degradation in huge database applications [2]. Research in the development of multimodal biometric systems has received considerable attention and several studies have suggested that the overall performances of biometric recognition systems can be achieved by integrating several modalities. In multimodal biometric systems, it require integration scheme to fuse information obtained from various biometric modalities. Such integration scheme can
be done at four levels: sensor level, feature level, matching score level, and decision level. Fusion at matching score level is more preferable and feasible than other levels because matching scores contain sufficient information to perform effective fusion and relatively easy to obtain [3]. In most cases, matching scores produced by classifiers from different modalities are heterogeneous, for example, different classifiers may generate different natures and scales of score output such as similarity scores, dissimilarity scores or distance scores. Besides having numerical scale, the matching scores from different classifiers may also have different statistical distributions [4-5]. The non-homogeneous of matching scores from different modalities complicates the fusion process. Normalization process is required to transform these scores into a same domain and scale before fusing them [6-7].
This paper presents a new normalization scheme that transforms each segment of score distribution using linear and quadratic functions. The impact of score normalization based on quadratic function will be examined on the performance of two types of fusion technique in the context of multimodal biometric fusion. The introduction of a new normalization parameter is to ensure that the mapping function changes the concavity at the point FAR is equal to FRR. This can avoid incorrect assumption of the system that lowers the performance. The paper is
Abstract: Normalization is an essential step in multimodal biometric system which involves various nature and scale of outputs from different modalities before employing any fusion techniques. This paper proposes score normalization technique based on mapping function to increase the separation of score at overlap region and reduce the effect of overlap region on fusion algorithm. The performance of simple rule based fusion preceded by the proposed normalization technique leads to consistently the best GAR on multimodal and face NIST databases in comparison to other competing normalization schemes. Experiments on the multimodal and face databases show about 28 % and 6 % improvement of GAR of the proposed normalization technique with max rule fusion over other competitive normalization techniques. In terms of the SVM-based fusion, it reveals that the performance of the proposed normalization technique is comparable with the two-quadrics technique provided that the kernel and parameters are carefully selected.
structured as follows: Section 2 introduces the principle of score normalization technique. Section 3 reviews baseline mapping-based normalization schemes and Section 4 presents the proposed normalization scheme. The performance of normalization scheme is evaluated using different baseline fusion strategies and several experiments have been conducted on different databases. The details on databases used in this work are provided in Section 5. Section 6 provides the experimental results which demonstrate the merits of the proposed technique including the analysis of these results. Finally, Section 7 concludes the paper.
2.
Score Normalization
Score normalization techniques can be broadly classified into two types: user dependent score normalization technique and user independent score normalization technique. The first category of score normalization is user dependent score normalization or also known as user specific score normalization approach that utilizes the parameters specific to a user to transform the score distribution for each user or template to a standard domain. In user specific score normalization procedure, a different sets of normalization parameters is used for each user [8]. A set of normalization parameters for each user is calculated off-line using the genuine and impostor score distributions which belong to that particular user during training stage. However, for certain types of user specific score normalization technique such as T-norm, the normalization parameters are calculated during on-line in verification phase [9]. Thus, the calculation process of normalization parameters for each user will cost much a computation time.
The second category of score normalization technique is a user independent score normalization technique. This score normalization technique uses global normalization parameters for all the users. Therefore, the computational time is less since it has fewer normalization parameters to calculate in comparison to user dependent score normalization technique. This make the implementation of user independent score normalization technique becomes easy and quiet straight forward. The user independent score normalization approach exploits statistical parameters estimated from score distribution of the classifier to convert the scores into same numerical scale [10]. In this case, the matching scores provided by an individual classifier can be scaled linearly by means of statistical parameters obtained from score distribution. There are also score normalization techniques which do not require statistical information to transform the scores, instead they are using mapping function of linear equation or nonlinear equation or combination of both. Examples of user independent normalization techniques are min-max, z-score, tanh [4], Two-Quadrics (QQ) and Quadric-Line-Quadric (QLQ) [11].
Despite of its simplicity and ease implementation in biometric recognition system, there exist some major drawbacks in user independent normalization technique. The first drawback is that there are several techniques in
independent normalization approach that are not robust and sensitive to the presence of outliers. For example, the min-max normalization technique depends on the extreme value of the scores and it can be affected by the presence of outliers. The presence of outliers at genuine and impostor score distributions will lead to performance degradation and reduce the recognition rate [11]. There are several techniques that are robust to the existing of outliers in score distribution such as tanh and double sigmoid, however there are many parameters need to be determined and it requires a lot of effort to determine the set of parameters that give the optimum result [6]. Several techniques which are derived from min-max normalization technique are proposed in [6][12] to solve the first issue in user independent score normalization approach. Second drawback is the large overlap region introduced by genuine and impostor scores distributions decrease the overall performance of biometric recognition system [11]. The error of individual biometric matchers stems from the overlap region of the genuine and impostor score distribution and this overlap region has an effect to fusion algorithm in multimodal biometric systems.
value and consequently, lead to a lower performance due to an incorrect assumption of the system. On the other hand, the QLQ score normalization approach only maps the score distribution outside of overlap region while maintaining the score distribution at overlap region. This technique however, does not significantly increase the separation of score distribution and the objective to solve the second problem is not achieved.
3.
Mapping Based Normalization Technique
This section briefly explains a classical normalization technique that transforms scores linearly, namely min-max and two normalization techniques that map normalized scores based on quadratic equation, that are Two-Quadrics (QQ) and Quadric-Line-Quadric (QLQ). The raw scores from multimodal biometric scores with different numerical ranges must be transformed first into a common range using min-max normalization technique before employing the QQ or QLQ normalization technique.
3.1
Numerical Domain
The simplest normalization technique known as min-max linearly transforms the raw scores of a specific matcher into a common range of interval [0, 1]. This linear transformation requires a prior knowledge of statistical information from the genuine and impostor score distributions. The min-max normalization scheme can be applied when the minimum and maximum values of a set of raw matching scores are known. The raw matching scores denoted as 𝑠 , from the set 𝑆 of raw scores. The corresponding normalized score of 𝑠 is then referred as 𝑠𝑚𝑚. The normalized score is computed as follows
𝑠𝑚𝑚=
𝑠 − min(𝑆) max(𝑆) − min(𝑆)
(1)
3.2
Two-Quadrics (QQ)
This score normalization technique is based on the quadratic function that applies mapping function to the min-max normalized scores. This mapping function requires prior knowledge about the parameters of the overlapping region which can be estimated from the score distribution. Two-Quadrics is composed of two quadric segments which transforms the concavity at the center of overlap region. Let 𝑐 denotes the center of the overlap region, 𝑤 denotes the width of overlap region, and 𝑠𝑚𝑚
denotes the min-max normalized score, the formula of QQ is
𝑠′= {
𝑠𝑚𝑚2
𝑐 ,𝑠𝑚𝑚≤ 𝑐 𝑐 + √1 − 𝑐)(𝑠𝑚𝑚− 𝑐), 𝑜𝑡ℎ𝑒𝑟𝑤𝑖𝑠𝑒
(2)
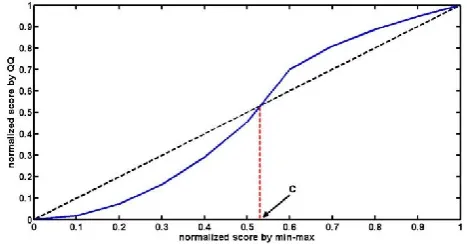
This method aims to increase the separation between the genuine and impostor scores distribution, while still mapping the scores to [0, 1] range. Fig. 1 shows the
relationship between min-max normalized scores and quadratic mapping function with the dashed line represents the min-max normalized scores. As can be seen, by introducing two quadratic function as mapping function, the scores above the center, 𝑐 are elevated further while that the scores below the center, 𝑐 are degraded. The new mapped scores will have better scores separation and small overlap region. The fix parameter 𝑐 benefits to the genuine and impostor match score distribution that does not experience serious overlap. It means that if the center 𝑐 is equal the point at which false acceptance rate (FAR) and false rejection rate (FRR), the QQ score normalization technique will maps the distribution equally and increases further the score distribution. However, this mapping function also increases high impostor scores and decreases the low genuine scores especially for a unimodal biometric system that has a large overlap region. If there exist serious overlap in score distribution at which one of the score distribution is more shifted than others, the QQ normalization technique will possibly maps the scores distribution at which false acceptance rate (FAR) and false rejection rate (FRR) are unequal. For example, if one matcher has a genuine score distribution that is more shifted to impostor value, this low genuine scores will be mapped to a lower value and consequently, lead to a lower performance due to an incorrect assumption of the system.
Fig. 1 Mapping function for Two-Quadrics (QQ) normalization.
3.3
Quadric-Line-Quadric
The second mapping-based normalization technique introduced by [11] is Quadric-Line-Quadric which also based on the quadratic function that is applied upon min-max score normalization technique. This technique employs similar principle as QQ that maps the min-max normalized score according to quadratic segment. Let 𝑐 denotes the center of the overlap region, 𝑤 denotes the width of overlap region, and 𝑠𝑚𝑚 denotes the min-max
normalized score. The formula for QLQ score normalization is as follows
{ 𝑠𝑚𝑚2
𝑐 −𝑤2,𝑥 < 𝑤
2
𝑐 +𝑤
2+ √(1 − 𝑐 − 𝑤
2) (𝑠𝑚𝑚− 𝑐 − 𝑤
2) , 𝑥 ≥ 𝑐 + 𝑤 2 𝑠𝑚𝑚,𝑜𝑡ℎ𝑒𝑟𝑤𝑖𝑠𝑒
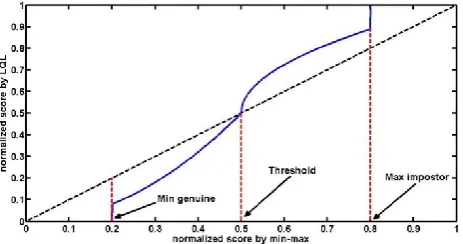
(3) The illustration of mapping function for QLQ normalization can be seen in Fig. 2. The first quadratic function maps the scores below the minimum genuine scores to a lower value, while that the second quadratic function transforms the scores above the maximum impostor scores towards a higher value. The scores at overlap region are remain unchanged while the scores at other regions are mapped with two quadratic function segments. The cause of error in an individual biometric matcher is from the overlap of the genuine and impostor score distributions [11]. This technique, however does not increase the separation of scores under overlap region and thus, the effect of this overlap on the fusion algorithm is not reduced.
Fig. 2 Mapping function for Quadric-Linear-Quadric (QLQ) normalization.
4.
The proposed Normalization Technique:
Linear-Quadric-Linear (LQL)
The original raw scores are first normalized using min-max normalization in order to transform the scores into a common domain. The min-max normalization step is necessary for a multimodal biometric systems which involve a set of scores from different traits or matchers that have various numerical ranges. The min-max normalized score distribution is then divided into four piecewise segments before applying the proposed normalization scheme and uses a threshold value instead a center of width at overlap region. The proposed normalization scheme takes advantage of linear and quadratic equations to transform scores and therefore it closely resembles the QQ normalization technique. As depicted in Fig. 3, LQL technique maps the non-overlap region of impostor scores to a constant value 0 and non-overlap region of genuine scores to a constant value 1. Let 𝑡ℎ denotes the threshold value that divides the overlap region and 𝑠𝑚𝑚 denotes the
min-max normalized score. The set of min-max normalized score is mapped to a quadratic function as follows
𝑠′=
{
0,𝑠𝑚𝑚 < 𝑚𝑖𝑛𝑔𝑒𝑛
𝑠𝑚𝑚2
𝑡ℎ ,𝑚𝑖𝑛𝑔𝑒𝑛 < 𝑠𝑚𝑚 ≤ 𝑡ℎ 𝑡ℎ + √(1 − 𝑡ℎ)(𝑠𝑚𝑚− 𝑡ℎ), 𝑡ℎ < 𝑠𝑚𝑚 ≤ 𝑚𝑎𝑥𝑖𝑚𝑝
1,𝑜𝑡ℎ𝑒𝑟𝑤𝑖𝑠𝑒
(4) The aim of the proposed normalization scheme is to reduce the effect introduced by overlap region by increasing the genuine and impostor score distributions. The separation of score distribution is measured using decidability index which uses two statistical values, mean and standard deviation of score distribution. In order to increase the separation, scores must have a greater mean of genuine scores and a lower mean of impostor scores. The quadratic function changes the concavity at the threshold value at which false acceptance rate is equal to false rejection rate. By using a threshold value as an anchored value, the number of high impostor scores is less than using a center of width in QQ normalization technique. The resulting normalized score will have a wide range of score distribution from 0 to 1 with a larger separation of genuine and impostor score distribution.
Fig. 3 Mapping function for Linear-Quadric-Linear (LQL) normalization.
5.
Databases and Experimental Design
5.1
Databases
face C matcher lie in the range [0.35, 0.95]. There are several similarity files of face C in NIST multimodal database and NIST database face that contain -1 for all scores. These odd scores are replaced with the minimum score value from the remaining files as suggested by [6].
The NIST BSSR face database consists of two face scores from the same person. There are two commercial face recognition systems used to compare the images and generate the face scores labeled as system ‘C’ and system ‘G’. The total number of subjects in this database is 3,000 with the generated genuine scores is 3,000 and 2,999 × 3,000 = 8,997,000 of impostor scores. The NIST BSSR fingerprint database contains 6,000 users in which two finger scores are collected from each user. The two finger scores are obtained by comparing a pair of images of the left index fingers and a pair of images of the right index fingers. In total, this database has generated 6,000 genuine scores and 5,999 × 6,000 = 35,994,000 impostor scores.
5.2
Experimental Design
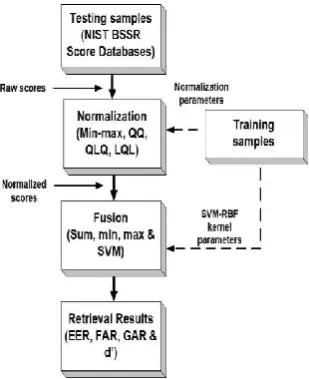
The overall procedure of experimental system to evaluate the performance of the proposed normalization scheme is illustrated in Fig. 4. The experiment setup implemented in this work is following the experimental system suggested by [6] in their work. Input scores are obtained from BSSR NIST databases which consist of three different sets. The raw scores are normalized using the baseline normalization schemes that are min-max [4], QQ, QLQ [11] and the proposed normalization technique, LQL. There are two types of fusion technique implemented in this work to integrate multimodal scores namely linear fusion and SVM-based classifier fusion techniques. The implementation of linear fusion techniques such as sum, min and max is easy and straight forward because they only use normalized scores as their input and do not require any additional fusion parameters. Following the experiment procedure conducted in [6], half of the genuine and impostor scores were randomly selected to be the training set to estimate the normalization parameter. Previous work pertaining score level fusion of multimodal biometric systems that used SVM-based classifier on NIST multimodal database [6] has revealed that RBF kernel parameter was a good option and showed good performance compared to other kernel. Following to that, SVM-based classifier with RBF kernel is employed in this work because it has a few parameters than polynomial kernels and furthermore, has a less complexity in parameter selection process [6]. The set of parameters for RBF kernel that gives the best performance is obtained by conducting a 20-fold cross validation technique. In order to search optimum parameter for SVM hyperplane which gives the best result, 100 scores are selected from genuine and impostor scores to be used in a cross validation experiment. Eventually, the performance evaluation and comparison between the proposed normalization technique with different fusion rules and baseline normalization techniques (min-max, QQ and QLQ) used in this work are presented in Section 6.
Fig. 4 Working flow of experimental design.
6.
Experimental Results
6.1
Performance Comparisons Between The
Proposed Normalization Technique
(LQL) and Competing Normalization
Techniques (min-max, QQ and QLQ
The separation of genuine and impostor score distributions of each normalization technique is examined using decidability index, 𝑑′ and it measures how well these two distributions are separated [14]. Table 1 presents the decidability index values of normalized scores from multimodal database described in Section 5.1. Scores of individual matcher are normalized using min-max, QQ, QLQ and the proposed one, LQL normalization techniques. By comparing the obtained results, it can be observed from Table 1 that 𝑑′ for each matcher attains higher value after being normalized with the proposed normalization scheme. Higher 𝑑′ value signifies a better separation between genuine and impostor matching scores and a good performance.scheme, linear-quadric-linear (LQL). Experiments were also conducted to measure the performance of SVM-rbf
based score fusion via different normalization techniques considered in this work.
Table 1: Decidability index, 𝑑′of various NIST BSSR databases under different normalization techniques NIST
Database
Trait Without
normalization
Min-max
Two-Quadrics
Quadric-Line-Quadric
Linear-
Quadric-Linear
Multimodal Left index 1.9021 1.9021 2.7466 2.0076 2.9550
Right index 2.2123 2.2123 3.3112 2.5554 3.5277
Face C 3.2937 3.2937 3.8019 3.0621 3.8212
Face G 3.3252 3.3252 3.0621 3.2061 3.5046
Fingerprint Left index 1.8411 1.8411 2.7640 1.7870 2.2701
Right index 2.0746 2.0746 3.1210 2.1264 2.8128
Face Face C 3.1351 3.1351 3.3367 2.8657 3.5713
Face G 3.1626 3.1626 2.7319 3.1611 3.4483
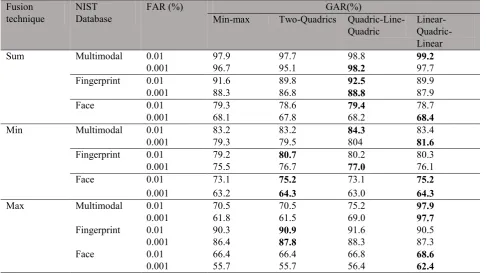
Table 2: Performance of simple fusion rules on NIST databases Fusion
technique
NIST Database
FAR (%) GAR(%)
Min-max Two-Quadrics Quadric-Line-Quadric
Linear- Quadric-Linear
Sum Multimodal 0.01 97.9 97.7 98.8 99.2
0.001 96.7 95.1 98.2 97.7
Fingerprint 0.01 91.6 89.8 92.5 89.9
0.001 88.3 86.8 88.8 87.9
Face 0.01 79.3 78.6 79.4 78.7
0.001 68.1 67.8 68.2 68.4
Min Multimodal 0.01 83.2 83.2 84.3 83.4
0.001 79.3 79.5 804 81.6
Fingerprint 0.01 79.2 80.7 80.2 80.3
0.001 75.5 76.7 77.0 76.1
Face 0.01 73.1 75.2 73.1 75.2
0.001 63.2 64.3 63.0 64.3
Max Multimodal 0.01 70.5 70.5 75.2 97.9
0.001 61.8 61.5 69.0 97.7
Fingerprint 0.01 90.3 90.9 91.6 90.5
0.001 86.4 87.8 88.3 87.3
Face 0.01 66.4 66.4 66.8 68.6
0.001 55.7 55.7 56.4 62.4
Tables 2 summarizes the performance results that are presented in terms of genuine acceptance rate (GAR) or verification rate at false accept rate (FAR) of 0.001 percent and 0.01 percent. The classical sum rule based fusion combined with LQL normalization scheme leads a significant performance improvement of GAR values at FAR of 0.001 percent for NIST face database and 0.01 percent for NIST multimodal database. It can be observed from the Table 2 for NIST fingerprint database, the best of GAR values is attained at the lowest and highest FAR by the simple sum that combine the matching scores preceded by the QLQ normalization technique. The genuine matching scores of NIST fingerprint database has a wide range of numerical values which are [0,326] for right index and [0,338] for left index. Any mapping-based normalization technique which attempts to map the
genuine scores at overlap region will degrade the performance further if ones use sum rule fusion technique to combine the matching scores. It is due to the fact that simple rule fusion properties combine matching score with equal weight for each score and the lower genuine score values resulting from QQ or LQL normalization technique will only deteriorate the performance of the system. It means that, for a matcher that has a wide overlap region of score distribution, QLQ normalization technique is a better option to implement because this technique only maps the scores of non-overlap region.
combined scores. In min rule fusion technique, the minimum value among the scores of the individual traits or matchers is assigned as combined score. On the other hand, in max rule the maximum value among the scores of the individual matchers is assumed as combined score. As can be observed from the results listed in the Table 2, the LQL normalization technique on NIST multimodal database and NIST face database consistently achieved the
best performance among all normalization techniques that were used in this work. The best performance gain was obtained by max fusion rule preceded by LQL normalization technique on NIST multimodal database. By comparison to other performance of other normalization techniques, it attained the GAR of 97.9% at FAR of 0.01% and the GAR of 97.7% at FAR of 0.001%.
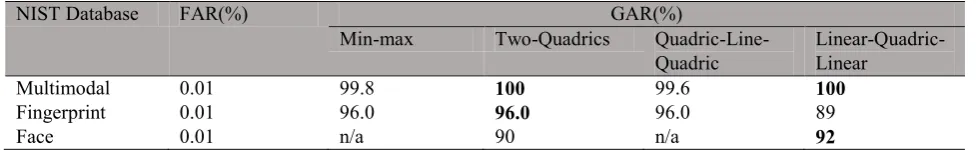
Table 3: Performance of SVM based fusion with RBF kernel on NIST databases
NIST Database FAR(%) GAR(%)
Min-max Two-Quadrics
Quadric-Line-Quadric
Linear-Quadric-Linear
Multimodal 0.01 99.8 100 99.6 100
Fingerprint 0.01 96.0 96.0 96.0 89
Face 0.01 n/a 90 n/a 92
The effect of the proposed normalization scheme on SVM based classifier fusion has been examined in this work. The original raw scores is first normalized with the proposed normalization technique and the normalized scores become the input to the SVM classifier. In this work, RBF kernel is selected to implement with SVM classifier due to its effectiveness to nonlinearly maps the feature vectors into a higher dimensional space and it can handle the case when the relational between the class labels and attributes is nonlinear [17]. In this case, the proposed normalization technique with SVM classifier is compared with min-max normalized scores, QQ normalized scores and QLQ normalized scores. The results are shown in Table 3. As can be observed, SVM based fusion preceded by LQL normalization on NIST Multimodal and NIST face input score vectors gives a better performance than the min-max normalization. Similarly, the LQL normalization results a comparable and satisfactory performance when comparing with other mapping-based normalization techniques. Table 3 suggests that normalization steps is necessary before the classification steps to further enhance the performance gain of biometric systems. The performance gain obtained by the SVM-based fusion with RBF kernel is compared with simple classical rule fusion techniques. For example, the sum rule-based fusion with LQL normalization on NIST face database achieved a GAR of 78.7% when FAR = 0.01%, whereas the SVM-based fusion with LQL normalization attained a GAR of 92% at the same FAR value. This result represents that SVM-based fusion with the proposed normalization technique can get the maximum performance improvement compared with simple classical fusion strategies. On the other hand, it is observed that the sum rule and SVM-based fusion with the proposed score normalization schemes on fingerprint database achieved low verification accuracy. It is due to the range of the right index fingerprint scores is similar to the range of the left index fingerprint scores and therefore, the contribution is less significant by up lifting low genuine scores or down lifting high impostor scores.
7.
Conclusion
This paper proposes a new normalization technique, Linear-Quadratic-Linear (LQL) which transforms matching scores based on two mapping functions: linear equation and quadratic equation. The mapping function maps the matching scores into a wide range of scores to maximize the distance in score distribution. Several experiments have been conducted to evaluate the performance of the proposed normalization technique and the experimental results on different databases reveal that the LQL normalization technique significantly improves the separation of genuine and impostor matching score distribution in comparison to other normalization techniques that employ the same principle: QQ and QLQ. The effect of the proposed normalization technique on system performance for different fixed fusion methods and SVM-based fusion method is examined. Experimental results show that the implementation of simple classical fusion strategies with the proposed normalization technique shows a comparable and better verification rate as compared to other conventional normalization schemes such as min-max, QQ and QLQ. The proposed normalization technique adopted for decreasing the overlapping region between genuine and impostor score distribution can enhance the performance of SVM in multimodal biometric systems. In this case, when implementing LQL normalization technique with SVM classifier (using RBF kernel) would result a better performance if compared to simple classical fusion rules.
References
[1] Yang, L., Yang, G., Yin, Y., and Xi, X. Exploring soft biometric trait with finger vein recognition,
Neurocomputing, Volume 135, (2014), pp. 218–228. [2] Zhu, L., and Zhang, S. Multimodal biometric
identification system based on finger geometry, knuckle print and palm print, Pattern Recognit. Lett., Volume 31, no. 12, pp. 1641–1649, Sep. 2010. [3] Ahmad, M. I., Woo W. L., and Dlay, S.
multimodal biometrics, Neurocomputing, Volume 177, (2016) pp. 49–61.
[4] Jain, A., Nandakumar, K., and Ross, A. Score normalization in multimodal biometric systems,
Pattern Recognition, Volume 38, (2005), pp. 2270– 2285.
[5] Kabir, W., Ahmad, M. O., and Swamy, M. N. S. A novel normalization technique for multimodal biometric systems, Circuits and Systems (MWSCAS), IEEE 58th International Midwest Symposium on, (2015), pp. 1-4.
[6] He, M., Shi-Jin, H., Pingzhi, F., Ray-Shine, R., Rong-Jian, C., Jui-Lin, L., Muhammad Khurram, K., and Kevin Octavius, S. Performance evaluation of score level fusion in multimodal biometric systems, Pattern Recognition, Volume 43,(2010), pp. 1789 –1800
[7] Y. N. Singh, Y. N., and P. Gupta, P. Quantitative Evaluation of Normalization Techniques of Matching Scores in Multimodal Biometric Systems, Lect. Notes Comput. Sci., Volume 4642, (2007), p. 574.
[8] N. Poh, N., A. Ross, A., W. Lee, W., and J. Kittler, J. A user-specific and selective multimodal biometric fusion strategy by ranking subjects, Pattern Recognit., Volume 46, (2013), pp. 3341–3357.
[9] Ning, H., X. Zou, X., and Hu, X. A new score normalization for text-independent speaker verification, Digit. Signal Process. (DSP), 2014 19th Int. Conf., (2014), pp. 636–639.
[10] Pirlo, G., and Impedovo, D. Adaptive Score Normalization for Output Integration in
Multiclassifier Systems, IEEE Signal Process. Lett., Volume 19, (2012), pp. 837–840.
[11] Snelick, R., Uludag, U., Mink, A., Indovina, M., and A. Jain, A. Large-scale evaluation of multimodal biometric authentication using state-of-the-art systems, IEEE Trans. Pattern Anal. Mach. Intell., Volume 27, (2005), pp. 450–455.
[12] Shariatmadar, Z. S., and Faez, K. Finger-Knuckle-Print recognition performance improvement via multi-instance fusion at the score level, Opt. - Int. J. Light Electron Opt., Volume 125, (2014), pp. 908–910. [13] National Institute of Standards and Technology, NIST
Biometric Scores Set, Available at
https://www.nist.goc/itl, [Accessed : May 2015] [14] Daugman, J. The importance of being random:
Statistical principles of iris recognition, Pattern Recognit., Volume 36, (2003), pp. 279–291.
[15] Nandakumar, K., Chen, Y., Dass, S. C., and Jain, A. K. Likelihood ratio-based biometric score fusion.,
IEEE Trans. Pattern Anal. Mach. Intell., Volume 30, (2008), pp. 342–7.
[16] Usha, K., and Ezhilarasan, M. Finger knuckle biometrics – A review, Comput. Electr. Eng., (2014). [17] Hsu, C., Chang, C., and Lin, C. A Practical Guide to Support Vector Classification, Volume 1, (2016), pp. 1–16.