Diversity and genetic stability in banana
genotypes in a breeding program using inter
simple sequence repeats (ISSR) markers
A.V.C. Silva1, A.L.S. Nascimento1, M.F. Vitória2, A.R.C. Rabbani3,
A.N.R. Soares2 and A.S. Lédo1
1Embrapa Tabuleiros Costeiros, Aracaju, SE, Brasil
2Programa de Pós-Graduação em Agricultura e Biodiversidade, Universidade Federal de Sergipe, Aracaju, SE, Brasil
3Instituto Federal da Bahia, Porto Seguro, BA, Brasil Corresponding author: A.V.C. Silva
E-mail: [email protected] Genet. Mol. Res. 16 (1): gmr16019402 Received October 4, 2016
Accepted December 5, 2016 Published February 23, 2017
DOI http://dx.doi.org/10.4238/gmr16019402
Copyright © 2017 The Authors. This is an open-access article distributed under the terms of the Creative Commons Attribution ShareAlike (CC BY-SA) 4.0 License.
Method using Arithmetic averages (UPGMA) dendrogram, it was possible to identify two main clusters and subclusters. Two genotypes (Garantida and Thap Maeo) remained isolated from the others, both in the UPGMA clustering and in the principal cordinate analysis (PCoA). Using ISSR markers, we could analyze the genetic diversity of the studied material and state that these markers were efficient at detecting sufficient polymorphism to estimate the genetic variability in banana genotypes.
Key words:Musa spp; ISSR; Breeding; AMOVA; Phylogeny
INTRODUCTION
Banana (Musa spp) is a fruit species widely cultivated and consumed worldwide, which has resulted in significant production and commercialization of the fruit (Heslop-Harrison and Schwarzacher, 2007). In Brazil, banana is a complementary food in the population’s diet, and has high nutritional value, is of low cost, and has an attractive color, taste, and smell. It has social and economic importance, providing employment and a source of income for many family farmers, and permitting the development of regions associated with its production (Lédo et al., 2008).
Several studies have aimed to improve understanding of the important genetic base characteristics in banana cultivation. However, to obtain more information for the improvement of this culture, similar progress in our understanding of the genomic structure and of the existing genetic relationships between the accessions stored in germplasm banks is needed (Crouch et al., 1999).
As a result, Embrapa was requested to implement a vast collection of banana germplasm and to develop a breeding program in order to acquire genotypes with superior agronomic characteristics. The banana breeding program began in 1982. In this, the process of genotype evaluation involves important characteristics, for which knowledge will be crucial for the recommendation of banana in a particular region (Silva et al., 2012).
Knowledge on genetic diversity is essential for efficient breeding programs (Venkatachalam et al., 2008), especially for the identification of hybrid combinations with higher heterozygosity and heterosis (Fehr, 1987). Consideration of these combinations increases the probability of recovering superior genotypes in segregating generations.
more current, ISSR and Random Amplification of Polymorphic DNA (RAPD) markers are also efficient at determining genetic variability. Studies have revealed that crossing divergent genotypes and selecting improved hybrids are key to the production of new cultivars (Ortiz and Vuylsteke, 1996). Banana cultivars are primarily derived from hybridization between wild diploid subspecies of Musa acuminata (Genoma A) and Musa balbisiana (Genoma B) and present several levels of genome ploidy in their constitution (de Jesus et al., 2013).
Within the National Network of Banana Cultivar Assessment of Brazil, which is part of the old International Network for the Improvement of Banana and Plantain (INIBAP), currently Bioversity International, trials take place in several states and ecosystems. The present study was carried out to evaluate the genetic diversity among 21 banana genotypes cultivated in the “Agreste” region of the state of Sergipe, Brazil.
MATERIAL AND METHODS
Banana genotypes were established in 2012 in the Experimental Field Jorge Prado Sobral, located in the city of Nossa Senhora das Dores, SE, Brazil (lat. 10°29'27'' S; long 37°11'34'' W, at 200 m above sea level, with annual average rainfall of 1046 mm). Young leaves of 21 genotypes were collected (Table 1) and used as the study material in the experimental field mentioned above. The leaves were identified, packed in Styrofoam plastic bags with ice, and stored at -80°C at the Molecular Biology Laboratory of Embrapa Coastal Tablelands.
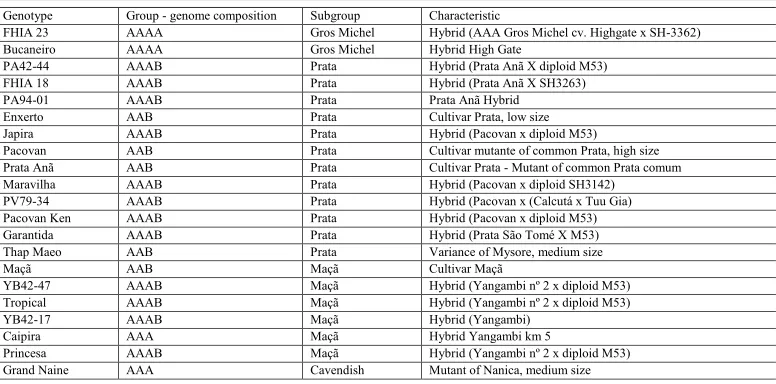
Table 1. Genotypes used to study genetic diversity, along with their respective clusters, subclusters, and characteristics.
Genotype Group - genome composition Subgroup Characteristic
FHIA 23 AAAA Gros Michel Hybrid (AAA Gros Michel cv. Highgate x SH-3362) Bucaneiro AAAA Gros Michel Hybrid High Gate
PA42-44 AAAB Prata Hybrid (Prata Anã X diploid M53) FHIA 18 AAAB Prata Hybrid (Prata Anã X SH3263) PA94-01 AAAB Prata Prata Anã Hybrid Enxerto AAB Prata Cultivar Prata, low size Japira AAAB Prata Hybrid (Pacovan x diploid M53) Pacovan AAB Prata Cultivar mutante of common Prata, high size Prata Anã AAB Prata Cultivar Prata - Mutant of common Prata comum Maravilha AAAB Prata Hybrid (Pacovan x diploid SH3142) PV79-34 AAAB Prata Hybrid (Pacovan x (Calcutá x Tuu Gia) Pacovan Ken AAAB Prata Hybrid (Pacovan x diploid M53) Garantida AAAB Prata Hybrid (Prata São Tomé X M53) Thap Maeo AAB Prata Variance of Mysore, medium size Maçã AAB Maçã Cultivar Maçã
YB42-47 AAAB Maçã Hybrid (Yangambi nº 2 x diploid M53) Tropical AAAB Maçã Hybrid (Yangambi nº 2 x diploid M53) YB42-17 AAAB Maçã Hybrid (Yangambi)
Caipira AAA Maçã Hybrid Yangambi km 5
Princesa AAAB Maçã Hybrid (Yangambi nº 2 x diploid M53) Grand Naine AAA Cavendish Mutant of Nanica, medium size
45 amplification cycles. During each cycle, samples were subjected to denaturation at 94°C for 1 min, annealing at different temperatures for 45 s, and extension at 72°C for 2 min.
Each ISSR reaction was carried out in a final volume of 20 mL containing 2 mL 20 ng/
mL DNA; 0.2 mL Taq DNA polymerase (Invitrogen); 0.6 mL MgCl2; 0.4 mL dNTP; 2 mL primer (oligonucleotides); 2mL buffer; and 12.8 mL ultrapure water.
Fragments were visualized on 2% agarose gel [1X TBE; Tris 89 mM; boric acid 89 mM; EDTA 2.5 mM; pH 8.3] in a horizontal electrophoresis system run at a constant voltage of 100 W for 90 min at 200 V and 200 mA. The banding pattern was measured using a 1 kb molecular marker (Promega, Madison, South Dakota, EUA). Gels were stained with ethidium bromide solution (0.02 mL/mL water), for approximately 60 min, and then visualized under UV light, using the Loccus L-pix HE photodocumentation device (Loccus Biotecnologia, Brazil).
Gel analysis resulted in a binary matrix according to the presence (1) or absence (0) of fluorescent bands. From the number of amplified bands, the percentage of polymorphic loci was calculated. Genetic similarity (Sij) between each pair of individuals was calculated out using the Jaccard coefficient.
From the similarity matrix, a dendrogram was generated by the unweighted pair-group method with arithmetic mean (UPGMA). Bootstrapping was carried out with 10,000 replicates using the FreeTree software (Pavlícek et al., 1999). TreeView software was also used to generate the dendrogram (Pavlícek et al., 1999). Samples were clustered considering the principal coordinates analysis (PCoA), with the aid of the Genalex v.p software (Peakall and Smouse, 2006). The Shannon index (I) (Brown and Weir, 1983) and the expected heterozygosity (HE) (Lynch and Milligan, 1994) were also estimated using the Genalex 6.3 software (Peakall and Smouse, 2006).
RESULTS AND DISCUSSION
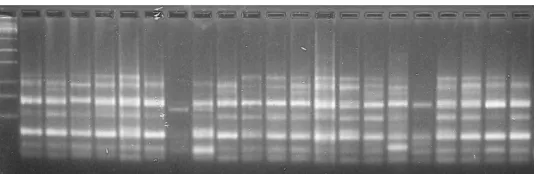
The 12 primers generated 71 fragments, of which 68 were polymorphic (97.5%). In each ISSR reaction, the total number of amplified fragments ranged from three (UBC-810 and UBC-864) to eight (UBC-817 and UBC-826), with a mean number of six bands per primer (Table 2 and Figure 1).
Table 2. Inter simple sequence repeat (ISSR) primers used in 21 banana genotypes cultivated in the state of Sergipe, Brazil, with their respective sequences, annealing temperature (AT), number of fragmented bands (NFB), polymorphism percentage (P%), Shannon Index (I), and expected heterozygosity (He).
Primer Sequence AT NFB %P I HE
807 AGA GAG AGA GAG AGA GT 50,4 5 100 0.60 0.42 810 GAG AGA GAG AGA GAG AT 50,4 3 100 0.69 0.49 811 GAG AGA GAG AGA GAG AT 53 7 100 0.34 0.21 848 CAC ACA CAC ACA CAC CRG 53 7 100 0.62 0.43 855 ACA CAC ACA CAC ACA CYT 53 7 100 0.54 0.36 817 CAC ACA CAC ACA CAC AA 50,4 8 100 0.47 0.31 834 AGA GAG AGA GAG AGY T 52,8 7 100 0.41 0.29 815 CTC TTC TCT CTC TCT CTG 47,6 6 80 0.28 0.18 835 AGA GAG AGA GAG AGA GYC 50,2 5 100 0.44 0.28 826 ACA CAC ACA CAC ACA CC 52,8 8 100 0.48 0.31 841 GAG AGA GAG AGA GAG AYC 42,5 5 100 0.55 0.38 864 ATG ATG ATG ATG ATG ATG 43,6 3 90 0.44 0.31
Figure 1. Electrophoretic profiles of inter-simple sequence repeats of 21 banana genotypes amplified in agarose gel using the primers UBC834. Embrapa Coastal Tablelands, Brazil. (P) 1 Kb; 1 - Enxerto; 2 - Japira; 3 - YB42-17; 4 - FHIA 18; 5 - FHIA 23; 6 - PA42-44; 7 - PV79-34; 8 - Maravilha; 9 - Princesa; 10 - YB42-47; 11 - Tropical; 12 - PA94-01; 13 - Grand Naine; 14 - Caipira; 15 - Maçã; 16 - Garantida; 17 - Bucaneiro; 18 - Pacovan Ken; 19 - Pacovan; 20 - Prata Anã; 21 - Thap Maeo.
Lower levels of polymorphism (33 and 34%) were found in banana Prata-Anã genotypes by Lopes et al. (2014) and Rodrigues et al. (2012), respectively, using RAPD molecular markers. In a study on Musa ssp cultivars, Ying et al. (2011) identified a high percentage of polymorphism (85.1%) using ISSR markers. The number of polymorphic loci is used to evaluate the efficiency of primers at estimating the genetic diversity among individuals of a population (Luz et al., 2015). When compared with other molecular markers, ISSRs may be more effective, revealing a high degree of polymorphism. In the present study, the efficiency of the tested primers at determining the genetic variability among banana accessions was confirmed.
The Shannon index (I) ranged from 0.34 to 0.69, with a mean of 0.49. Expected heterozygosity (HE) ranged from 0.18 to 0.49, with mean of 0.33 (Table 2). These indices revealed intermediate levels of genetic diversity. However, for some primers, such as 807, 810, and 848, the values of I and He could be considered high, showing high variability. This may be due to the occurrence of somaclonal variations in banana plants. At a higher level, when compared with other cultures, these changes probably occur due to mitotic instability (Silva et al., 2002), resulting in high genetic variability. Similar results were found by Padmesh et al. (2012) in wild populations of Musa acuminata Colla, in which values of I between 0.57 and 0.61 were observed, providing high genetic variability.
The polymorphism identified by the markers was used to construct a genetic distance matrix. Based on the Jaccard coefficient, two main clusters were identified in the UPGMA analysis (Figure 2). Most genotypes were allocated in a main cluster with several subclusters. The genotypes Pacovã, Prata-Anã, Enxerto, FHIA-18, PA94-01, Japira, Tropical YB42-47, Bucaneiro, and Grand Naine presented higher similarities, and thus, were allocated to the same subcluster. The tetraploid genotype FHIA-23 (Gros Michel) was more isolated from the other genotypes, despite being present in the main cluster. The second main cluster, which was composed of the genotypes ‘Garantida’ (tetraploid) and ‘Thap Maeo’ (triploid), both from the cluster Prata, were allocated with high similarity, and were more isolated from the other genotypes.
It was not possible to obtain perfect separation between the genotypes of each cluster, and there was high genetic similarity among genotypes of different clusters. This can be explained by the existence of many common alleles to these genotypes. Thus, individuals in the same subcluster present a high level of genetic similarity, and share a common origin (Creste et al., 2003).
Figure 2. Phylogenetic representation of Unweighted Pair Group Method using Arithmetic averages (UPGMA) clustering estimated by the genetic similarity of the Jaccard coefficient and by the bootstrap analysis (10,000x) for 21 banana genotypes cultivated in the state of Sergipe, Brazil.
The identification, conservation, and collection of genotypes belonging to Musa spp. deserve special attention in order to reduce genetic erosion and to extend the use of genotypes in further breeding programs (Venkatachalam et al., 2008).
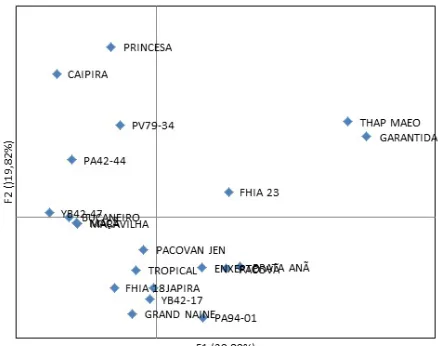
Genetic distances were also evaluated by PCoA (Figure 3). Four clusters were identified among the different genotypes studied, and the sum of the first two principal components was 48.91%. These results reinforce the efficiency of ISSR markers in detecting genetic diversity among banana genotypes. Similar to the UPGMA clustering, the genotypes Thap Maeo (AAB) and Garantida (AAAB), both of the subcluster ‘Prata’, were the most divergent and remained isolated from the other clusters.
In the Musa genus, subdivision into subclusters may be associated to small mutations within a clone (Dantas et al., 1997). Moreover, the variability within each subcluster is mainly dependent on the genotype, and on the intensity with which each clone is multiplied (Jenny et al., 1999).
Individuals in isolated clusters can be has greater divergence (Vieira et al., 2008), and can be further used in crosses to promote breeding. The use of more than one clustering method, due to differences in hierarchies, ordering, and optimization of clusters enables classifications based on the criteria of each technique, and prevents erroneous interference in the allocation of materials within a genotype subcluster (Arriel et al., 2006).
Based on ISSR markers, the similarity matrix obtained from 21 genotypes resulted in 762 values for the similarity index, of which 12 are highlighted as having major and minor similarity (Table 3). The pairs formed between the genotype of the subcluster ‘Prata’ (Enxerto - AAB x Japira - AAAB) and (PA42-44 x Garantida, both of the cluster AAAB), established the largest (0.894) and shortest (0.306) distances, respectively. Crosses influenced the levels of genetic variability by reducing the distance and by increasing the divergence among some genotypes. Resmi et al. (2011) concluded that there was higher divergence in diploids of the cluster AA than in diploids of the cluster AB.
Table 3. Genotype pairs with values of high and low similarities (s) based on the Jaccard coefficient, calculated starting from 12 ISSR markers in 21 banana genotypes.
Order Highest similarity S Lowest similarity S 1 Enxerto x Japira 0.894 PA42-44 x Garantida 0.306 2 Pacovã x Prata Anã 0.867 Maçã x Garantida 0.340 3 Tropical x Grand Naine 0.857 Maravilha x Garantida 0.340 4 Enxerto x Pacovã 0.844 PA42-44 x Thap Maeo 0.354 5 Japira x Pacovã 0.833 FHIA 23 x Thap Maeo 0.372 6 Japira x Grand Naine 0.823 YB-42-47 x Thap Maeo 0.375 7 Japira x YB42-17 0.820 Pacovan x Thap Maeo 0.380 8 YB42-47 x Tropical 0.815 Maravilha x Thap Maeo 0.385 9 PA94-01 x Grand Naine 0.812 Bucaneiro X Thap Maeo 0.388 10 Enxerto x Prata Anã 0.808 Pacovan Jen x Garantida 0.388 11 Grand Naine x Bucaneiro 0.800 Caipira x Thap Maeo 0.405 12 YB-42-47 x Bucaneiro 0.796 Princesa x Thap Maeo 0.408
The high diversity observed in diploid genotypes is attributed to their hybrid origin. However, the pattern of genetic variation in plants is complex and can be influenced by several factors, such as production system, development, seed dispersal mechanism, geographical distribution, and taxonomic status (Hamrick and Godt 1989).
The development of ISSR molecular markers in agronomically important cultures provides information on genetic diversity, which is of great value when these genetic resources are used in breeding and germplasm conservation programs. Plants with lower levels of genetic similarity, as determined by molecular markers, could be used as the parent material in breeding programs for the production of hybrids (Sousa et al., 2015).
Banana breeding can be difficult and laborious, and for a long time, it was considered impractical mainly because of factors such as vegetative propagation, the occurrence of triploidy, low fertility of clones, and time required to produce an improved cultivar, preventing fast progress in breeding (Vuylsteke, 2001).
Conflicts of interest
The authors declare no conflict of interest.
ACKNOWLEDGMENTS
We thank the Embrapa Tabuleiros Costeiros for assisting with the study.
REFERENCES
Arriel NHC, Di Mauro AO, Di Mauro SMZ, Bakke AO, et al. (2006). Multivariate techniques for the determination of genetic diversity in sesame using RAPD markers. Pesq. Agropec. Bras. 41: 801-809. http://dx.doi.org/10.1590/ S0100-204X2006000500012
Brown AHD and Weir BS (1983). Measuring genetic variability in plant populations. In: Isozymes in Plant Genetics and Breeding, Part A (Tanksley SD and Orton TJ, ed.). Elsevier Science, Amsterdam, 219-239.
Crouch JH, Crouch HK, Tenkouano A and Ortiz R (1999). VNTR-based diversity analysis of 2x and 4x full-sib Musa hybrids. Electron. J. Biotechnol. 2: 99-108. http://dx.doi.org/10.2225/vol2-issue3-fulltext-1
Creste S, Tulmann Neto A, Silva SO and Figueira A (2003). Genetic characterization of banana cultivars (Musa spp) from Brazil using microsatellite markers. Euphytica 132: 259-268. http://dx.doi.org/10.1023/A:1025047421843
Dantas JLL, Shepherd K, Silva SO and Soares-Filho WS (1997). Classificação botânica, origem, evolução e distribuição geográfica. In: A cultura da banana: aspectos técnicos, socioeconômicos e agroindustriais. Embrapa, Brasília, 27-34. de Jesus ON, Silva SdeO, Amorim EP, Ferreira CF, et al. (2013). Genetic diversity and population structure of Musa
accessions in ex situ conservation. BMC Plant Biol. 13: 41. http://dx.doi.org/10.1186/1471-2229-13-41 Doyle JJ and Doyle JL (1990). Isolation of plant DNA from fresh tissue. Focus 1: 13-15.
Fehr WR (1987). Principles of cultivar development. Macmillan, New York.
Figueiredo AS, Resende JT, Faria MV, Da-Silva PR, et al. (2016). Prediction of industrial tomato hybrids from agronomic traits and ISSR molecular markers. Genet. Mol. Res. 15: 1502-7981. http://dx.doi.org/10.4238/gmr.15027981 Hamrick JL and Godt MJW (1989). Allozyme diversity in plant species. In: Plant population genetics, breeding and
germplasm resources (Brown AHD, Clegg MT, Kahler AL and Weir BS, ed.). Sunderland: Sinauer Associates, 43-63. Heslop-Harrison JS and Schwarzacher T (2007). Domestication, genomics and the future for banana. Ann. Bot. (Lond.)
100: 1073-1084. http://dx.doi.org/10.1093/aob/mcm191
Ganopoulos I, Merkouropoulos G, Pantazis S, Tsipouridis C, et al. (2011). Assessing molecular and morpho-agronomical diversity and identification of ISSR markers associated with fruit traits in quince (Cydonia oblonga). Genet. Mol. Res. 10: 2729-2746. http://dx.doi.org/10.4238/2011.November.4.7
Jenny C, Carrel F, Tomekpe K, Perrier X, et al. (1999). Les bananiers. In: Centre de coopération internationale en recherche agronomique pour le développement. Diversité génétique des plantes tropicales. Cirad, Montpellier, 113-129. Kiran U, Moahnty K, Roy PS, Behera L, et al. (2015). Genetic diversity among banana cultivars from Odisha using RAPD
markers. Sci. Res. Rep 5: 118-124.
Lédo AS, Silva Júnior JF, Lédo CAS and Silva SO (2008). Avaliação de genótipos de bananeira na região do baixo São Francisco, Sergipe. Rev. Bras. Frutic. 30: 691-695. http://dx.doi.org/10.1590/S0100-29452008000300022
Librelon SS, Costa MR, Nietsche S and Pereira MCT (2013). Diversidade genética de clones de bananeira 'Prata-anã' (AAB) por meio de marcadores SSR. Rev. Bras. Frutic. 35: 809-817. http://dx.doi.org/10.1590/S0100-29452013000300018 Lopes OP, Maia VM, Xavier AA, Costa MR, et al. (2014). Genetic diversity, growth and production of genotypes of banana
'Prata-Anã' in area with panama disease. Rev. Bras. Frutic. 36: 924-939. http://dx.doi.org/10.1590/0100-2945-368/13 Luz GA, Gomes SO, Araujo Neto RB, Nascimento MSCB, et al. (2015). Molecular characterization of accessions
of Cratylia argentea (Camaratuba) using ISSR markers. Genet. Mol. Res. 14: 15242-15248. http://dx.doi. org/10.4238/2015.November.25.12
Lynch M and Milligan BG (1994). Analysis of population genetic structure with RAPD markers. Mol. Ecol. 3: 91-99. http://dx.doi.org/10.1111/j.1365-294X.1994.tb00109.x
Mattos LA, Amorim EP, Amorim VBO, Cohen KO, et al. (2010). Agronomical and molecular characterization of banana germplasm. Pesq. Agro. Bras. 45: 146-154. http://dx.doi.org/10.1590/S0100-204X2010000200005
Padmesh P, Mukunthakumar S, Vineesh PS, Skaria R, et al. (2012). Exploring wild genetic resources of Musa acuminata
Colla distributed in the humid forests of southern Western Ghats of peninsular India using ISSR markers. Plant Cell Rep. 31: 1591-1601. http://dx.doi.org/10.1007/s00299-012-1273-5
Pavlícek A, Hrdá S and Flegr J (1999). Free-Tree--freeware program for construction of phylogenetic trees on the basis of distance data and bootstrap/jackknife analysis of the tree robustness. Application in the RAPD analysis of genus Frenkelia. Folia Biol. (Praha) 45: 97-99.
Peakall R and Smouse PE (2006). Genalex 6: genetic analysis in Excel. Population genetic software for teaching and research. Mol. Ecol. Resour. 6: 288-295. http://dx.doi.org/10.1111/j.1471-8286.2005.01155.x
Resmi L, Kumari R, Bhat KV and Nair AS (2011). Molecular characterization of genetic diversity and structure in South Indian Musa cultivars. Int. J. Bot 7: 274-282. http://dx.doi.org/10.3923/ijb.2011.274.282
Rodrigues FE, Librelon SS, Nietsche S, Costa MR, et al. (2012). Genetic variability in clones of 'Prata Anã' bananas based on phenotypic and molecular markers. Bragantia 71: 182-189. http://dx.doi.org/10.1590/S0006-87052012000200005 Rout GR, Senapati SK, Aparajita S and Palai SK (2009). Studies on genetic identification and genetic fidelity of cultivated
banana using ISSR markers. Plant Omics 6: 250-258.
Silva SO, Flores JCO and Lima Neto FP (2002). Avaliação de variedades e híbridos de bananeira em quatro ciclos de produção. Pesq. Agro. Bras. 37: 1567-1574. http://dx.doi.org/10.1590/S0100-204X2002001100007
Silva TN, Calasans TN, Martins CR, Lédo AS, et al. (2012). Caracterização física de frutos de diferentes genótipos de bananeira em Nossa Senhora das Dores-SE. In: Anais XXII Congresso Brasileiro de Fruticultura, Bento Gonçalves. Available at [http://www.alice.cnptia.embrapa.br/bitstream/doc/943405/1/caracterizacaofisicadefrutos4zbj.pdf]. Accessed February 2, 2016.
Sousa AGR, Souza MM, Melo CAF and Sodré GA (2015). ISSR markers in wild species of Passiflora L. (Passifloraceae) as a tool for taxon selection in ornamental breeding. Genet. Mol. Res. 14: 18534-18545. http://dx.doi.org/10.4238/2015. December.23.41
Venkatachalam L, Sreedhar RV and Bhagyalakshmi N (2008). The use of genetic markers for detecting DNA polymorphism, genotype identification and phylogenetic relationships among banana cultivars. Mol. Phylogenet. Evol. 47: 974-985. http://dx.doi.org/10.1016/j.ympev.2008.03.017
Vieira EA, Fialho JF, Silva MS, Fukuda WMG, et al. (2008). Variabilidade genética do banco de germoplasma de mandioca da Embrapa Cerrados acessada por meio de descritores morfológicos. Cient. 36: 56-67.
Vuylsteke D (2001). Strategies for utilization of genetic variation in plantain improvement. Ph.D. Thesis, Katholieke Universiteit Leuven, Leuven.