Original Research Article
Nutritional status of pre-school children (1-5 years) in rural area of
Chhattisgarh state
Pradeep Sukla, Avinash Borkar*
INTRODUCTION
Pre-school children belong to 1-5 years age group are vulnerable because of their rapid growth rate. They need more attention and care for the physical and mental development. Physical growth, development and well-being are directly related to the nutritional status.1 Malnutrition is not only an important cause of childhood morbidity and mortality, but also leads to permanent impairment of physical and possibly, of mental growth of those who survive.2 It is the most widespread condition affecting the health of the child. Thus nutritional status of the child is a sensitive indicator of not only health of the child but also community health and nutrition.
The extent of nutritional problems and factors contributing to it vary from region to region. A large majority of malnourished children live in rural areas compared to urban areas. The state Chhattisgarh is having 76.76 % rural and tribal population. National Family Health Survey- 4 data reported higher prevalence of stunting (38.6%), wasting (23.15%) and underweight (37.7%) in Chhattisgarh as compared to national figures. (37.2%, 21%, 35.7%) The condition is worse in rural areas.3 Scarcity of suitable food, lack of purchasing power of the family as well as traditional beliefs and taboos about what baby should eat and infections often make rural areas more prone for malnutrition. Millennium development goals (MDGs) had set the target
ABSTRACT
Background: Pre-school children are more vulnerable as any adverse influence operating on them during this period
may result in limitation in their development (both physical and mental), some of which at least are irreversible. Nutritional problems among children cause major morbidity and mortality in India. India is home to the largest number of underweight and stunted children in the world. The aims and objectives of the study were to assess prevalence of underweight, stunting and wasting among pre-school children in rural area of Chhattisgarh state.
Methods: A community-based, cross- sectional study was conducted among 400 pre-school children in rural area
during January-May 2107. Anthropometric measurements were taken. The indicators of nutritional status of children like underweight, stunting and wasting were expressed using WHO conducted ‘Multicentric Growth Reference Study’ (MGRS) standards.
Results: Out of 400 children studied, 36% were underweight, 35.5% were stunted and 28.5% were having wasting.
More than 50% of girl children were underweight and stunted. Nutritional indicators became worse as age advances.
Conclusions: Almost one third of pre-school children were underweight and stunted. Female children were more
nutritionally deprived than males. For attainment of best possible nutrition and growth in children, targeted short-term strategies addressing underlying risk factors and more long-term poverty alleviation strategies may be needed.
Keywords: Pre-school children,Stunting, Underweight, Wasting
Department ofCommunity Medicine, Late Shri Lakhiram Agrawal Memorial Medical College, Raigarh, Chhattisgarh, India
Received: 05 March 2018
Accepted: 30 March 2018
*Correspondence:
Dr. Avinash Borkar,
E-mail: [email protected]
Copyright: © the author(s), publisher and licensee Medip Academy. This is an open-access article distributed under
the terms of the Creative Commons Attribution Non-Commercial License, which permits unrestricted non-commercial use, distribution, and reproduction in any medium, provided the original work is properly cited.
to halves undernutrition by 2015 which was not achieved while sustainable developmental goal targets to end all forms of by 2030 including stunting and wasting.1
Therefore, regular growth monitoring investigations are necessary to generate data regarding the current status of nutritional status especially of this vulnerable group. It would also have an add-on benefit in devising suitable remediating efforts, nutrition intervention programmes and cultivation of good practices, all forming a part of nutritional surveillance systems.
Objective
To assess the present status of stunting, wasting and under-nutrition in pre-school children of rural areas of Raigarh district.
To suggest suitable recommendations based on study findings.
METHODS
Study type
Observational cross-sectional study
Study population
Pre-school children between 1-5 years age group
Study setting
Community Health Centre (CHC) and Rural Health Training Centre (RHTC), Loing under Department of Community Medicine, Late Shri Lakhiram Agrawal Memorial Medical College, Raigarh (C.G.)
Study area
Rural area covered under CHC, Loing
Study period
January 2017 to May 2017
The present community based observational crosss-sectional study was carried out in the rural field practice area, Loing of Late Shri Lakhiram Agrawal Memorial Medical College Raigarh which is 15 km from the college. There are 10 Primary Health Centres comprising 37 Sub-centres and 146 villages under this RHTC. Primary Health Centr (PHC) with more prevalence of stunting, wasting and undernutrition was selected for study. This PHC consist of six Sub-centres. Out of these three subcentres were selected randomly. All the ten villages under these subcentres with combined population of 8405 were included in the study. Sample size was calculated considering 37% prevalence of underweight in Chattisgarh rural area from NFHS-4 data among less than
five year children, with 5% absolute precision and 95% confidence interval, a sample size of 359 ≈ 400 children was required.
Data was collected with pre-tested and predesigned questionnaire by house-to-house visit in selected villages until sample size was attained. It included socio-demographic parameters like age, sex, address, educational status of head of the family, socio-economic status and anthropometry which included height or length and weight of the children. Information on immunization and illnesses like respiratory diseases/diarrhea in preceding years was also collected.
Anthropometric measurements such as height and weight were recorded to the nearest 0.5kg and 0.1cm respectively by standard methods. Where children could not stand on the weighing scale, the weight of the child was measured by subtracting the mother’s weight; from mother along with baby weight taken by the digital weighing scale. For the children who could stand, the weight was measured directly. Care was taken that the child didn’t move or lean forward and took any support during the measurement. Weight was recorded in kilograms. Similarly, the length of children was measured by an infantometer and height by the stadiometer and height chart. While measuring the length of the child by infantometer, care was taken for the head to be stabilized to the stagnant part and legs held at the level of knees by the mother, while the measurement was recorded by the moving part. Height was taken by making the child stand in front of the height chart/stadiometer, heels together with buttocks, shoulders and occiput touching the wall (in case of height chart). The information and anthropometric measurements were recorded in the presence of parents (mother/father) and guardian. The compiled data were analyzed to find out the prevalence of nutritional indicators: age (under-weight), Weight-for-height (wasting) and Height-for-age (stunting) using WHO conducted ‘multicentric growth reference study (MGRS) standards.4 The study was approved by Institutional Ethical Committee. Oral informed consent was obtained from the mother/father/guardian participated in the study.
Statistical analysis
Collected data was compiled on Microsoft Office Excel Worksheet 2010 and analyzed using frequency, mean, standard deviation, simple proportion and percentages. Chi-square test was used for comparison and p<0.05 considered as statistically significant.
RESULTS
and upper lower class (125; 33.07%); followed by lower middle (80; 21.16%), upper middle (34; 8.99%) and upper (09; 2.38%) according to modified B. G. Prasad classification. Most of the children were in age group of
12-24 months (119; 29.75%) followed by 25-36 months (113; 28.25%), 49-60 months (95; 23.75%) and 37-48 months (73; 18.25%) (Table 1).
Table 1: Distribution of socio-demographic characteristics of children.
Characteristics Number Percentage (%)
Gender (N=400)
Males 242 60.50
Females 158 39.50
Age group (in months) (N=400)
12-24 119 29.75
25-36 113 28.25
37-48 73 18.25
49-60 95 23.75
Socio-economic status of family (B.G. Prasad classification) (N=378)
Upper 09 2.38
Upper middle 34 8.99
Lower middle 80 21.16
Upper lower 125 33.07
Lower 130 34.39
Table 2: Distribution of underweight, stunting and wasting according to age group.
Age group (in months)
Underweight (N=144) (%)
Stunting (N=142) (%)
Wasting (N=114) (%)
12-24 (1-2 years) 26 (18.06) 22 (15.50) 20 (17.54)
25-36 (2-3 years) 44 (30.56) 34 (23.95) 25 (21.93)
37-48 (3-4 years) 39 (27.08) 48 (33.80) 29 (25.44)
49-60 (4-5 years) 35 (24.31) 38 (26.76) 40 (35.09)
Table 3: Distribution of underweight, stunting and wasting according to gender.
Males (N=242) (%)
Females
(N=158) (%) X
2
value P value Significance
Underweight 63 (26.03) 81 (51.27) 26.42 0.00001 High
Stunting 57 (23.55) 85 (53.80) 38.19 0.00001 High
Wasting 45 (18.60) 69 (43.67) 29.50 0.00001 High
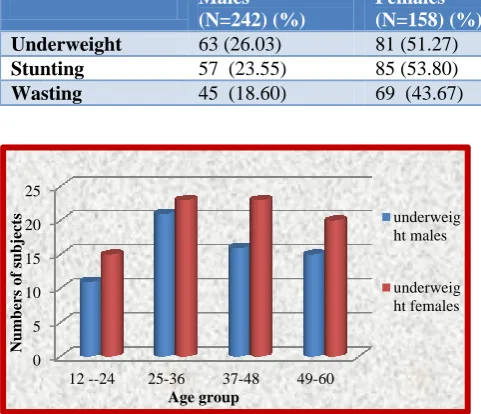
Figure 1: Distribution of underweight in male and female children according to age group.
Table 2 shows that out of 400 children studied, 144 (36%) were underweight, 142 (35.50%) were stunted and
114 (28.50%) were having wasting. Most of underweight children (44, 30.56%) were in age group of 2-3 years followed by 3-4 years (39, 27.08%) and 4-5 years (35, 24.31%) age group. Wasting was more prevalent in age group of 4-5 years (40, 35.09%) followed by 3-4 years (29, 25.44%), 2-3 years (25, 21.93%) and 1-2 years (20, 17.54%) while stunted children were more in age group of 3-4 years (48, 33.80%) followed by age group of 4-5 years (38, 26.76%), 2-3 years (34, 23.95%) and 1-2 years (22, 15.5%).
Table 3 shows prevalence of underweight 81 (51.27%), stunting 85 (53.80%) and wasting 69 (43.67%) is more among female children as compared to male children (26.42% - underweight, 23.55%- stunting, 18.60%- wasting). All the nutritional indicators (underweight, stunting and wasting) were significantly high in female children as compared to male children.
0 5 10 15 20 25
12 --24 25-36 37-48 49-60
Num
bers
o
f
subjects
Age group
underweig ht males
Figure 2: Distribution of stunting in male and female children according to age group.
Figure 3: Distribution of wasting in male and female children according to age group.
Maximum underweight girl children were in age group of 25-36 months and 37-48 months (23 each i.e. 28.40%), stunting was more in age group of 37-48 months (29 i.e. 34.12%) and wasting was more in age group of 49-60 months (25 i.e. 36.23%) while maximum underweight male children was more in age group of 25-36 months (21 i.e. 33.33%), stunting was more in age group of 37-48 months (19 i.e. 33.33%) while wasting was more in age group of 49-60 months (15 i.e. 33.33%). Thus prevalence of underweight, stunting and wasting was more above 2 years of age. Again in each age group female children were more affected by undernutrition, stunting and wasting (Figure 1-3).
DISCUSSION
India accounts for more than 3 out of every 10 stunted children in the world. More than one third of the world’s children who are wasted live in India.5 In India, the Empowered Action Group (EAG) states have highest mortality and morbidities among under-five children. The findings of the National Family Health Survey (NFHS) - 3 and NFHS- 4 shows decline in prevalence of underweight, stunting and wasting in under-five children
in Chhattisgarh state but it is still high compared to other states. Again these figures are higher in rural areas.3,6
Our study findings revealed that magnitude of underweight was 36%, stunting was 35.50% and wasting was 28.50% in this rural area. The prevalence was higher than Srinivas et al(27.16%, 20%, 10.6%) and Patil et al (22%, 20%) as these studies were done in urban areas.7,8 Our findings were comparable with the findings of Patil et al (37%, 33%) and NFHS-4 Chhattisgarh state data. However, Rao et alin their studies which included tribal preschool children found higher prevalence (61.6%, 51.6%, 32%).8,9 Higher prevalence of undernutrition, stunting and wasting among 1-5 year-old children could be attributed to suboptimal infant and young child feeding practices such as too early or delayed introduction of complementary food along with deficiency of micronutrients. Again, high prevalence of respiratory tract infections and micronutrient deficiency disorders such as anaemia and vitamin A deficiency might be playing an important role. Similarly, socio-economic status inequalities such as limited access to health services, chronic household food insecurity and the likelihood of poor environmental conditions (access to clean water, hygienic conditions, sanitation) increase the likelihood of illness.
The present study showed significant gender differentials in the prevalence of underweight status, stunting and wasting among pre-school children. We found that more than 50% of female children were underweight and stunted and 43% were having wasting. The findings were similar to the findings revealed by Somanwar et al, Purohit et al and Yadav et al who also found more nutritional deprivation among girl child.1,5,10 This is due to neglected attitude of parents and community in rural areas towards girl child. Quite often the root cause of malnutrition among girls is not so much the lack of food as the lack of access to food due to gender discrimination. This is dangerous not only for their own health but also as an undernourished girl have greater likelihood of becoming undernourished mother who in turn have a greater chance of giving birth to low birth weight babies.11
In our study, prevalence of underweight, stunting and wasting was more in age group of 3-4 years and 4-5 years which is similar to the findings of Somanwar et aland Sharma et alThis may be due to as child grows, moves outside and subjected to environment he is more prone for acquiring infectious diseases.2,12
CONCLUSION
The results of the study showed higher prevalence of undernutrtion 36%, stunting 35.5% and wasting 28.5% among pre-school children in this rural area. All nutritional indicators were worse in female children as compared to male children.
0 5 10 15 20 25 30
12--24 25-36 37-48 49-60
Num
bers
o
f
subjects
Age group
stunting males
stunting females
0 5 10 15 20 25
12--24 25-36 37-48 49-60
Num
ber
o
f
subjects
Age group
Recommendation
Improving socio-economic status of the rural population, good food security, improved maternal education, improved sanitation and provision of safe drinking water for prevention of diarrhoeal and respiratory infections will help in improving the health and nutritional status of pre-school children. Also, there is a need to strengthen all the existing nutrition intervention programmes such as supplementary feeding programme under integrated child development scheme (ICDS). Similarly, the community needs to be sensitized towards the importance of balanced diets and personal and environmental hygiene and also about ill effects of gender discrimination through health and nutrition education and behavioural change communication (BCC) to decrease the infectious diseases and improve nutritional status of children.
Limitations
The factors responsible for higher prevalence of underweight, stunting and wasting were not studied in this research which needs to be evaluated.
Funding: No funding sources Conflict of interest: None declared
Ethical approval: The study was approved by the Institutional Ethics Committee
REFERENCES
1. Park K. Park’s Textbook of preventive and social medicine. 22nd ed. Jabalpur: M/s Banarsidas Bhanot publishers; 2013: 508-10, 528-30.
2. Somanwar BN, Phuljhale S. Assessment of nutritional status amongst bihor tribe childrens residing in Dharamjaigarh block of Raigarh district (C.G.), India. Int J Res Med Sci. 2015;3(10):2820-25.
3. National Family Health Survey- 4, 2015-16, International Institute for Population Sciences, Mumbai, Ministry of Health and Family Welfare, Government of India. Available at: http://rchiips.org/NFHS/factsheet_NFHS-4.shtml. Accessed on 4 January 2018.
4. Paul VK, Bagga A. Ghai Essential Pediatrics. 8th ed. New Delhi:CBS Publishers & Distributors Pvt Ltd; 2013: 11-34.
5. Purohit L, Sahu P, Godale LB. Nutritional status of under- five children in a city of Maharashtra: a community based study. Int J Community Med Public Health. 2017;4(4):1171-8.
6. National Family Health Survey- 3, 2005-06, International Institute for Population Sciences, Mumbai, Ministry of Health and Family Welfare, Government of India. Available at: http://rchiips.org/NFHS/factsheet_NFHS-3.shtml 7. Srinivasa SB, Dnyaneshwar B, Ajay U.
Anthropometric Measurement of Weight for Assessment of Nutritional Status of Anganwadi Children in Urban Mangalore - A Cross Sectional Study. Anat Physiol. 2017;7(3):259-63.
8. Patil CR, Thakre SS, Khamgaonkar MB, Thakre S. Prevalence of stunting and wasting among Anganwadi school children of rural and urban area of Central India: A cross-sectional study. Int J Med Sci Public Health. 2017;6(2):413-7.
9. Rao VG, Yadav R, Dolla CK, Kumar S, Bhondeley MK, Ukey M. Undernutrition and childhood morbidities among tribal preschool children. Indian J Med Res. 2005: 43-47.
10. Yadav SS, Yadav ST, Mishra P, Mittal A, Kumar R, Singh J. An Epidemiological Study of Malnutrition Among Under Five Children of Rural and Urban Haryana. J Clin Diagnos Res. 2016;10(2):7-10. 11. UNICEF- India, Child Development and Nutrition,
Women Nutrtion. Available at: http://unicef.in/ Whatwedo/6/Women-Nutrition. Accessed on 4 January 2018.
12. Sharma U, Yadav N, Mishra R, Mishra S, Tiwari P. Status of undernutrition among pre-school children (4-6 years) of Allahabad district. Indian J Prev Soc Med. 2013;44(3-4):196-9.