Balkan countries challenge–Individual Income
taxes effects versus differential value added tax
algorithms on regional government revenues
Todri Ardita1
University of Elbasan (Albania)
Scalera Francesco2* University of Bari (Italy)
Abstract
This study addresses to the individual incomes tax (IIT) effects versus the differential value added tax (VAT) algorithms in Balkan countries government revenues. Therefore initially a fixed effects panel regression model is explored regarding Albania, Kosovo, Macedonia, Serbia, Montenegro and Bosnia-Herzegovina as per 1991-2014 period at 95% confidence level aiming to analyze the impact of some macro-variables that vary over time between the countries with a special regard to the IIT and VAT (which are bias predictors) impact on government tax revenues. Correspondently its results confirm a controversy in terms of VAT effects versus the one of IIT on Balkan countries government revenues. Meanwhile pursuing a linear regression analysis through the neighboring countries the VAT effects prevalence on tax revenues / GDP ratio reveals only in Albania case. Comparatively the additional predictors generally impacting the variable in question in the singular “state-analysis” are: GDP per capita, Agriculture/GDP ratio, inflation rates and external debt. Certainly, this helps in the understanding of the necessary economics policies to be implemented aiming the acceleration of Balkan area economic growth and the European Union accession in the near future.
Key words: individual income tax, value added tax, fiscal competition, economic growth, european integration, balkan countries government revenues.
1. INTRODUCTION
As clearly defined also by the name Balkan region (in Turkish means “a chain of wooded mountains”) it is composed from a mix of ethnicities which live and interact between with a common dream: be part of the big European family. During the pertinence of communist systems in the previous years the regional countries have faced different challenges regarding to the socio-economic transition in search of a major efficiency in the democratic era.
Thus, referring to the latest and almost being conscious of the competitive aspects these countries in a certain way have been boosted to invest in legal and institutional framework development with special regards to: markets liberalization and public finance enhancement. Consequently a new political and economical era began, despite the political restrictions especially after the fall of market barriers by giving the opportunity to some countries to accelerate the steps towards European Union membership (es. Greece which joint it in 1981, Slovenia in 2004, Bulgaria and Romania began member of European Union in 2007, and Croatia in 2013). By this way, the rest of the regional countries while contemporary dealing with monetary policy issues gradually implemented a fiscal policy under the sustainability paradigm.
It should be admitted that in no one of the regional countries wasn’t developed any strategically transitional shift almost when changes in economic environments boosted the countries to cooperate not only under trade but even under financial aspects by promoting the capital movements. For all the above mentioned reasons a special attention was given to fiscal components which could give a support to the regional countries’ fragile public finance such as: personal income tax, small-medium and corporation income tax, custom tariffs, exercise tax and finally the value added tax (VAT). Being that the previous fiscal systems were characterized by:
a. complex administrative procedures;
b. differences in tax charges by means of which the discrimination of certain activities and factors and at the same time favoring some others;
c. non-flexibility and non-simplicity according to Tanzi (2004) and furthermore when some of the characteristics sound true even in the current systems.
d. an unsustainable tax policy; e. non-transparency;
f. inequalities observed in comparison with West European countries; g. no balance between direct and indirect taxes.
1Faculty of Economics University of Elbasan, Albania; Department of Finance and Accounting; “Kozma Naska” Street, Elbasan, Albania;
While considering that a new social and economic model should be implemented aiming to promote the progressive taxation and social protection programs designed to reduce income and wealth inequalities. Properly this can be evidenced in Balkan countries aiming to attract foreign investors by contemporaneously acting under a competitive context within the area.
The individual income tax (IIT) is the object of this study almost considering the effects of value added tax as a European Union pre-requisite membership which was the last tax introduced through the above mentioned regional countries fiscal reforms. Under a commercial context the individual income tax refers to:
1. employment relations;
2. economic activity different from the economic activity as owner; 3. financial investments;
4. renting or other leasing of rights or property for consideration; 5. property rights assessment;
6. other sources, including residents and non-resident individuals.
Considering these circumstances the most interesting research refers to the impact of individual income taxes on regional countries government revenues/GDP ratio.
Correspondently, the empirical analysis explored focuses on the following research questions:
1. Does individual income tax (IIT) has a greater impact on tax revenues /GDP ratio than value added tax (VAT) in Balkan area?
2. The individual income tax differential effects on tax revenues/GDP ratio in the neighboring countries.
Therefore the second part of the study deals with the macro-characteristics of the regional countries fighting toward a sound fiscal competition and economic growth as well as aiming the fulfillment of the requirements regarding the European Union accession.
In addition the third part pursues a more empirical examination line regarding the estimation of individual income tax effects on the above mentioned regional countries tax revenues /GDP ratio with the purpose to demonstrate the progress-state done
2. BALKAN’S ECONOMIC COMPETITION CONTEXT
Being inspired by the EU`s 2020 Strategy adopted by the Ministry of Economy of six South East European economies (Albania, Bosnia and Herzegovina, Kosovo, Montenegro, Serbia and Macedonia) as described by RCC (Balkan Barometer Business Opinion Report 2015) the main goals are the:
a) prosperity and job creation and to underscore; b) the importance of the EU perspective;
c) and the region`s future.
Mostly referring to the following five pillars:
1.
Integrated growth-boosting trade, investments, citizen’s mobility and policy enhancement;2.
Smart growth-promoting the knowledge and innovation as well as the creation of value added in a competitive context;3.
Sustainable growth-by enhancing the entrepreneurship toward a greener and more energy-efficient development;4.
Inclusive growth-skills development programs implementation aiming employment creation and labor market including vulnerable groups and minorities;5.
Governance for growth-by improving the capacity of public administrations to strengthen the rule of law and reduce corruption so as to create a business-friendly environment.In respect of first and third goal the decrease of employment rate and the increase of GDP in the regional countries are synonyms of each other arguing on business performance and governmental role in managing the employment resources while dealing with the trade-off budget expenses and internal-external debts. From the other hand it can be understood the business climate or market efficiency in the area compared with the proactive government role especially in transition and developing economies.
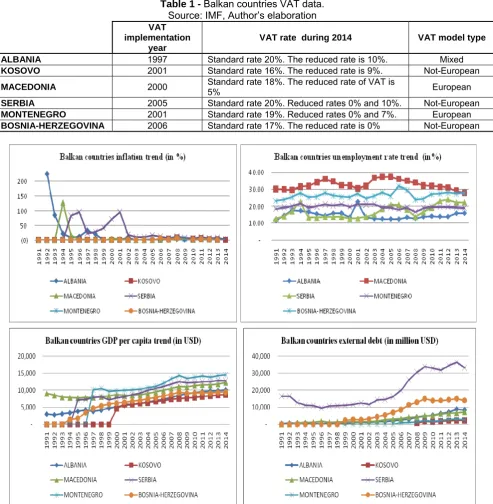
For the above mentioned reasons reveals interesting analyzing the effects of value added tax (VAT) implementation (see Table 1) on regional countries unemployment rate and GDP per capita rate when the inflation rate is significantly reduced during the period taken into consideration (from 1991-2014) while the external debt has maintained a positive trend in the major part of the countries.
Table 1 - Balkan countries VAT data. Source: IMF, Author’s elaboration VAT
implementation year
VAT rate during 2014 VAT model type
ALBANIA 1997 Standard rate 20%. The reduced rate is 10%. Mixed KOSOVO 2001 Standard rate 16%. The reduced rate is 9%. Not-European
MACEDONIA 2000 Standard rate 18%. The reduced rate of VAT is 5% European
SERBIA 2005 Standard rate 20%. Reduced rates 0% and 10%. Not-European MONTENEGRO 2001 Standard rate 19%. Reduced rates 0% and 7%. European BOSNIA-HERZEGOVINA 2006 Standard rate 17%. The reduced rate is 0% Not-European
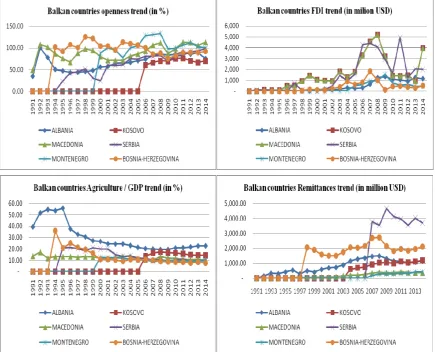
Figure 1 - Balkan countries Inflation, Employment, GDP per capita and External Debt trend.
Source: World Bank, Author’s elaboration
Table 2 - Balkan countries Inflation, Employment, GDP per capita and External Debt growth trend.
Source: World Bank, Author’s elaboration
Inflation rate % GDP per capita % Unemployment rate % External Debt %
Country VAT Implementation year
first 5 years
The rest
first 5 years
The
rest first 5 years
The rest
first 5 years
The rest
ALBANIA -1997 -25% -1.15% 53% 72% -111% 3.41% 129% 441%
KOSOVO -2001 5% -3.93% 18% 25% N/a N/a N/a N/a
MACEDONIA-2000 -6% -3.49% 9% 30% 510% -940% 101% 119%
SERBIA-2005 -10% -4.06% 16% 3% -160% 300% 104% 4%
MONTENEGRO-2001 N/a -3.64% 22% 20% -280% 90% N/a 95%
The latest demonstrates a slight decrease for Macedonia, Serbia and Montenegro and vice versa for Albania and Bosnia-Herzegovina. With special regard to the last year data, the inflation levels noted in the countries refer to -1% to 2%, the unemployment rate instead fluctuated from 16%-28%, the GDP per capita from 8.700$-14.500$ and external debt from 2.2 billion$-33.1 billion$, where the highest correspondingly belong to Serbia, Bosnia-Herzegovina and Macedonia, Montenegro and against Serbia.
However referring to Table 2 summary in the above mentioned countries from VAT implementation period inflation rate has been reduced while the opposite revealed from unemployment rate in the major part of countries. Meanwhile a positive trend is maintained from GDP per capita when the most fluctuant situation refers to countries external debt.
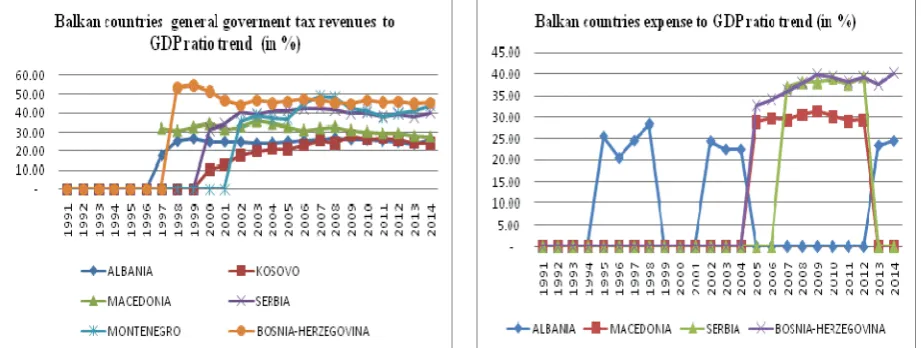
Other relevant aspects regarding the sources of GDP growth rate which contemporaneously represent also the most important above mentioned countries activities are: export–import, agriculture, foreign direct investments and remittances. By this way, the openness ratio has maintained a positive trend in each of the a/m countries especially after the VAT implementation year where the leader seems to be Macedonia followed from the accelerating steps of Montenegro and Bosnia-Herzegovina (see Figure 2). The agriculture/GDP ratio instead has significantly decreased in all the countries during the 2005 as well as after the VAT implementation period but in following it demonstrates a positive growth trend almost in Albania and consecutively in Kosovo.
Being strongly related to global crisis the other two indicators such as: FDI flows and remittances have suffered a shock during 2007 for two consecutive years (their lowest level was marked during 2009). But in following it can be evidenced a sustainable growth especially in remittances. Under this context the striking performance of Macedonia is plausible while continuously increasing exports and attracting more and more foreign investors with a remarkable FDI growth almost after VAT implementation period.
The latest is referred to the fact that the cost of labor is cheap even the same situation persists also in the other countries and during the last year it has strongly competed with Kosovo and Serbia. From the other hand, the biggest benefits of remittances are attributed to Serbia followed from Bosnia-Herzegovina and Kosovo starting from VAT implementation period. In addition may also added that these indicators trend in a certain way testify the efforts made by the governance especially in changing the regulation by admitting that business people aren’t influential on legislative and policy decisions.
Figure 2 - Balkan countries Openness, FDI, Agriculture /GDP and Remittances trend.
Therefore, the question arises: are the general tax revenues and expenses relative to GDP increased after the VAT implementation period in the above mentioned Balkan countries?
Referring to the first indicator the trend evidenced is positive almost after the year 2007 (see Figure 3), which leads to the understanding that in all the countries the VAT implementation has a positive impact in the budget revenues. From the other side the available data pertaining to expenses to GDP ratio in the countries result fluctuant but significant in terms of VAT implementation. Thus, with special regard to the most fluctuant situation which is the Albanian one VAT has given an immediate positive impact during the year 2008 in the expenses to GDP ratio in coherence with the increase of general government tax revenues and external debt ratio.
Furthermore worth mentioned that Bosnia-Herzegovina has increased the expenses disproportionally with general tax revenues during the year 2006 which coincide with VAT implementation period. During the period in question this country has demonstrated the higher rate of tax revenues to GDP in comparison with other ones but in following the general tax revenues after VAT implementation period remained quite constant. This explains external debts decrease of the country by confirming that the expenses increases are supported mainly from internal debts during the last decade.
A more conservative approach instead is implemented from Serbia by maintaining a coherent management of external debts and expenses until 2012 and vice-versa the other two consecutive years. Meanwhile a slight general negative effect is observed in Macedonian budget revenues after VAT implementation while expenses are increased through external debts. Properly aiming the external debt reduction the governance has made the best efforts toward expenses management.
Figure 3 - Balkan general tax revenues and expenses to GDP trend.
Source: World Bank, Author’s elaboration
Anyway it should be admitted that in general terms in all the countries seems that VAT has positively impacted the GDP growth rate especially in countries with high informality rate such as Albania, Macedonia and Kosovo by averagely increasing the Balkan countries GDP per capita with 25% as well as the unemployment rate in Serbia, Montenegro and Bosnia-Herzegovina with respectively 300%, 90% and 30%.
3. THEORETICAL EVIDENCES ON VAT IMPACT ON GOVERNMENT TAX REVENUES
Different empirical studies have demonstrated interlinks between VAT performance of a country and its level of development. Specifically Ebrill et al. (2001), has affirmed that the revenue gains from VAT are likely to be higher in an economy with higher level of GDP per capita income, lower share of agriculture, and higher level of literacy. By this way VAT seems to be an efficient tool for revenue collection by also having a direct impact on fiscal mobilization, macroeconomic stability and development.
According to Heady (2002) among OECD countries is observed a clear, consistent trend for greater use of the VAT to collect sales tax revenues. Correspondently while these countries continue to rely heavily on income tax collection, the VAT revenues have risen steadily in both absolute and relative terms: the general consumption taxes increased sharply from 12 percent of the total tax revenues in 1965 to 18 percent in 2000. Generally the logic of VAT introduction in many developing countries consists in the replacement of turnover tax or some type of single-stage sales tax.
Because referring to McMoran (1995) is indicated that the administration and compliance costs under a single-stage tax and a VAT extended to the same level in the production-distribution chain do not differ significantly. In respect of short-time growth effects instead a large body of empirical research such as in Alesina and Perotti (1996), Alesina and Ardagna (1998), Perotti (1999) primarily for industrial countries, has been devoted to understanding under which conditions fiscal multipliers can be small (and even negative). The latest shows that budgetary consolidations tend to be expansionary even when debt is high or grows rapidly. In addition Von Hagen and Strautch (2001) demonstrated that fiscal adjustments that rely primarily on cuts in transfers as well as on wages tend to last longer and can be expansionary, while those that rely primarily on tax increases and cuts in public investment tend to be constricted and unsustainable. Furthermore, Tanzi and Zee (1996) studied the potential effects of fiscal policy on long-term growth. In the same way other researches in the field of endogenous growth suggest that the fiscal policy can either promote or retard both the economic growth and the investments in human and physical capital.
As explained from Chamley (1986). Barro (1990), King and Rebelo (1990), Barro and Sala-i-Martin (1995), Mendoza et al., (1997) the last ones can be affected by taxes while investments can influence the governmental expenditure and other macro and micro variables which consecutively affect economic growth. Meanwhile another issue arises as argued from Keen (2008) related to the proper degree of reliance on trade taxes as VAT is approximately 20%, more of all tax revenue in many developing countries, so that continuing pressures towards further trade liberalization, combined with pressing revenue needs, raise the question of how reduced trade tax revenue can be replaced from domestic sources. and as explained from Baunsgaard and Keen (2005) in many low income countries are experienced difficulties in achieving such replacement in the past as well as its further management.
Under the same context other studies conducted by Christadl, Fetchenhauer and Hoezl (2011) examine the potential confirmation bias in price perception in consequence to a real-world event and different explanations for such a bias by suggesting that participants reported price increases that were significantly higher than the official price level and in line with an undifferentiated belief in market price increases.
A special attention instead goes to agriculture which is defined as a hard-to-tax sector for numerous technical, social and political issues. Firstly, in developing countries, a large part of the sector is informal.
Furthermore, from the social perspective, agriculture merits certain special tax relief as most of the poor are active in the sector and in following, the sector deals with different political constituents and hence needs to be treated more favorably in taxation.
In practice, the majority of countries opt for a VAT exempt in this sector. Another issues has been posed from Tait (1991) concerning the introduction of VAT, being that the latest is also defined as a broad-based consumption tax, all businesses including exempt firms raise their prices and thereby trigger long-lasting inflation, but the experience of countries adopting VAT shows that this concern is unfounded. Contrariwise, it indicates that the VAT is not inflationary, even though in some countries such as Japan and Denmark, the VAT resulted in once-and-for-all inflationary.
Through the same logic line a recent IMF survey shows that the VAT performs relatively well in small countries and islands (with population of less than 5 million) by underlining that indirect taxes are likely to perform better in countries which rely more on foreign trade in compliance with Prest (1979) which argued that the overall tax capacity of a country is positively correlated with its size of trade. On the other hand, Alesina and Wacziarg (1998) as studied from Ebrill (2001) empirically demonstrated that trade and country size are negatively correlated and this leads to the understanding that when a country relies more on foreign trade, the tax administration may shift its focus to a few check points at the border, thereby the collection cost may be reduced by raising tax revenues.
Furthermore as described from ibid from the collection efficiency perspective it should be admitted that trade taxes may even be superior to other types of consumption taxes including the VAT. From the other side instead, the VAT, being a general tax (imposed on both imports and domestically produced goods), possess some important advantages: it is less distortionary and has more revenue potential than tariff alone.
4. EMPIRICAL ANALYSIS
Under the above mentioned context the rising question is: Does VAT positively impact the government tax revenues in the Balkan countries taken into consideration?
In respect with the above mentioned purpose a fixed effects panel regression model is explored for the six countries taken into consideration regarding the period 1991-2014 at 95% confidence level aiming to analyze the impact of variables that vary over time between the countries almost the VAT (which is a bias) impact on government tax revenues. Obviously, the model implementation was done by previously verifying that the distribution of each country error terms and respective constant are different (as they capture the individual characteristics) and uncorrelated with the others.
tax revenues variance and where 68% of it is attributed to the differences across panels (interclass correlation coefficient rho=0.68).
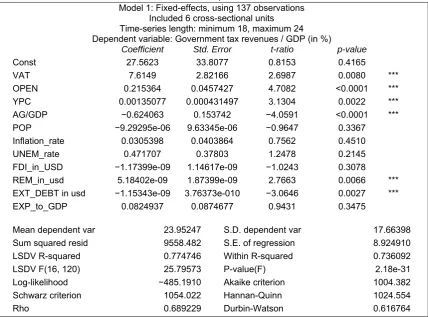
Table 3 - Fixed effects regression model.
Source: World Banka Data, Author’s elaboration Model 1: Fixed-effects, using 137 observations
Included 6 cross-sectional units Time-series length: minimum 18, maximum 24 Dependent variable: Government tax revenues / GDP (in %)
Coefficient Std. Error t-ratio p-value
Const 27.5623 33.8077 0.8153 0.4165
VAT 7.6149 2.82166 2.6987 0.0080 ***
OPEN 0.215364 0.0457427 4.7082 <0.0001 ***
YPC 0.00135077 0.000431497 3.1304 0.0022 ***
AG/GDP −0.624063 0.153742 −4.0591 <0.0001 ***
POP −9.29295e-06 9.63345e-06 −0.9647 0.3367
Inflation_rate 0.0305398 0.0403864 0.7562 0.4510
UNEM_rate 0.471707 0.37803 1.2478 0.2145
FDI_in_USD −1.17399e-09 1.14617e-09 −1.0243 0.3078
REM_in_usd 5.18402e-09 1.87399e-09 2.7663 0.0066 ***
EXT_DEBT in usd −1.15343e-09 3.76373e-010 −3.0646 0.0027 ***
EXP_to_GDP 0.0824937 0.0874677 0.9431 0.3475
Mean dependent var 23.95247 S.D. dependent var 17.66398 Sum squared resid 9558.482 S.E. of regression 8.924910
LSDV R-squared 0.774746 Within R-squared 0.736092
LSDV F(16, 120) 25.79573 P-value(F) 2.18e-31
Log-likelihood −485.1910 Akaike criterion 1004.382
Schwarz criterion 1054.022 Hannan-Quinn 1024.554
Rho 0.689229 Durbin-Watson 0.616764
The second point of the empirical analysis consists in the estimation of VAT impact on government tax revenues/GDP ratio in each of the selected Balkan countries (being that they also represent one of the major trade partners of each other).
Hence an ordinary least square model is built for each of the mentioned countries (see Annex I) where against VAT (being different) is used as a bias and the same variables are taken into consideration. And (refer to Table 4) the only country in which VAT has a statistically significant positive impact on government tax revenues/GDP ratio with 29.6% is Albania, followed from GDP per capita as the most common variable with positive impact on governmental tax revenues/GDP ratio.
Table 4 - OLS regression model using VAT as bias in the Balkan countries results.
Source: World Banka Data, Author’s elaboration
VAT
EXP&I MP/G DP
YPC AGRI/GDP POP INF UN-EM FDI REM DEBT EXT- EXP/GDP
Model R square
ALBANIA + 0.9855
KOSOVO + - + 0.9895
MACEDONIA 0.9051
SERBIA + - - + - 0.9348
MONTENEGRO + + 0.9372
BOSNIA-HERZEGOVINA - + 0.9781
5. CONCLUSIVE REMARKS
In this work is addressed an empirical evaluation of the VAT impact on tax revenues/GDP ratio in Balkan countries being that the fiscal policy is a strong instrument used from public authorities for granting facilities with the aim to influence the economic process, adjust the business cycle by contemporary removing the economic imbalances, boosting the competition, supporting the economic growth and moreover pursuing the European dream.
Consecutively by referring to the fixed effects panel regression model explored regarding Albania, Kosovo, Macedonia, Serbia, Montenegro and Bosnia-Herzegovina as per 1991-2014 period at 95% confidence level and also being that the heteroskedasticity and residuals’ normality test (see Annex II) confirm the normality of error’s distribution and the absence of heteroskedasticity issues in general it can be confirmed that:
in average if VAT in a certain country varies across time by 1% the governmental tax revenues/GDP ratio increases by 7.61%;
in average if Openness ratio in a certain country varies across time by 1% the governmental tax revenues/GDP ratio increases by 0.22%;
in average if Agriculture/GDP ratio in a certain country varies across time by 1% the governmental tax revenues/ GDP ratio decreases by 0.65%;
the GDP per capita, remittances and external debt impact on governmental tax revenues/GDP ratio is lower even statistically significant at 95% confidence level.
In controversy within the Balkan area results the ordinary least squares analysis handled against at 95% confidence level implemented in each neighboring country demonstrated that only in Albania VAT has a positive impact on tax revenues/GDP ratio where it represents the only predictor with a statistical significant effect on it. Dealing with a quantitative summary Serbia is the only country with more predictor statistically significant on the variable in question. In this isolated case the GDP per capita and inflation independent variables have a statistically positive impact on tax revenues/GDP ratio while with a negative one can be evidenced: Agriculture/GDP ratio, Population and External debt. By analogy in Kosovo the analysis shows that the predictors’ impact on tax revenues/GDP ratio is also mixed, the positive ones refer to GDP per capita and FDI while the negative correlation is presented from the inflation ratio. The opposite result instead regarding FDI is evidenced in Bosnia-Herzegovina where only remittances have a positive impact on the tax revenues/GDP ratio. In Montenegro the impact of both predictors on the variable in question is positive such as: GDP per capita and population. Under this context Macedonia is the only neighboring country with no one predictor statistically significant on tax revenues/GDP ratio. Theoretically constrained can be mentioned that the effects of remittances, foreign direct investments and GDP per capita on tax revenues/GDP ratio are always positive, but as can be noted a very limited number of predictors in the analysis in question can confirm their undisputed impact on tax revenues/GDP ratio, here is the case of only GDP per capita. While the fluctuant predictors’ result: the population, inflation rate and FDI.
Arguing on different impacts of predictors in the two models previously analyzed in any case it can be confirmed the positive effect of VAT on tax revenues/GDP ratio within the area and its differentiated effect while dealing with each neighboring country. From the other hand being that VAT has a special plan to promote economic competition a deeper analysis regarding the inconsistency aspect results interesting aiming to explore the dynamic effects of VAT in each neighboring country as a future research target.
REFERENCES
Alesina, A., & Ardagna, S. (1998). “Tales of Fiscal Adjustment”. Economic Policy, vol. 13, no. 27, pp. 487-545.
Alesina, A., & Perotti, R. (1996). “Fiscal Adjustments in OECD Countries–Composition and Macroeconomic Effects”. IMF Working Paper no. 96/70.
Alesina, A. & Wacziarg, R. (1998). “Openess, Country Size and Government. Journal of Public Economics, vol. 69 pp. 305-321.
Barro, R., & Sala-i-Martin, X.I. (1995). Economic Growth. New York: McGraw Hill.
Barro, R. (1990). “Government Spending in a Simple Model of Endogenous Growth”, 1990. Journal of Political Economy, vol. 98, no. 5, pp. S103-S125.
Baunsgaard, T., & Keen, M. (2005). “Tax Revenue and (or?) Trade Liberalization”. IMF Working Paper no. 05/112.
Chamley, C. (1986). “Optimal Taxation of Capital Income Equilibrium with Infinite Lives”. Econometrica, vol. 54, no. 3, pp. 607-622.
Christadl, F., Fetchenhauer, D., Hoezl, E. (2011). “Price Perception and Confirmation Bias in the Context of VAT Increase”. Journal of Economic Psychology. vol. 32, no. 1, pp. 131-141.
Heady, C. (2002). “Tax Policy in Developing Countries: What Can Be Learned from OCED Experience?” Paper presented at the seminar “Taxing Perspectives: A Democratic Approach to Public Finance in Developing Countries,” at the Institute of Development Studies, University of Sussex on 28-29 October, 2002.
IMF World Economic Outlook. (2014). https://www.imf.org/external/pubs/ft/weo/2014/02/pdf/statapp.pdf, Accessed 11 July, 2017.
Keen, M. (2008). “VAT, Tariffs and Withholding: Border Taxes and Informality in Developing Countries”. Journal of Public Economics, vol. 92, no. 10-11, pp. 1892-1906.
King, R.G., & Rebelo, S. (1990). “Public Policy and Economic Growth: Developing Neoclassical Implication”. NBER Working Paper no. 3338, 1990.
McMorran, R. T. (1995). “A comparison Between The Sales Tax and a VAT.” In Parthasarathi Shome, ed., Tax Policy Handbook. Washington D.C.: Fiscal Affairs Department, IMF.
Mendoza, E., Ferretti Milesi, M. & Asea, P. (1997). ‘On the Ineffectiveness of Tax Policy in Altering Long Run Growth. Harberger’s Superneutrality Conjecture’, Journal ofPublic Economics, vol. 66, pp. 99-126.
Perotti, R. (1990). “Fiscal Policy in Good Times and Bad”. Quarterly Journal of Economics, vol. 114, no. 4, pp. 1399-1436. Prest, A. R. (1979). “The Taxable Capacity of a Country.” In J.F. Toye, ed., Taxation and Economic Development, chapter
1. London: Frank Cass.
Tanzi, V., & H Zee, H. (1996). “Fiscal Policy and Long-Run Growth”. IMF Working Papers 96/119. International Monetary Fund.
Tanzi, V. (2004). Globalization and the need for fiscal reform in developing countries. (Occasional Paper SITI= Documento de Divulgación IECI; n. 6) (Vol. 6). BID-INTAL.
Tait, A. (1991). “VAT Policy Issues: Structure, Regressivity, Inflation, and Exports.” In Alan A. Tait, ed., Value-Added Tax: Administrative and Policy Issues. Occasional Paper 88. Washington D.C.: IMF. October.
Von Hagen, J. & Strauch, R. (2001). “Fiscal Consolidations: Quality, Economic Conditions, and Success”. Public Choice, vol. 109, no. 3-4, pp. 327-346.
ANNEX I
Joint test on named regressors
Test statistic: F(11, 120) = 30.4276
with p-value = P(F(11, 120) > 30.4276) = 1.17473e-029
Test for differing group intercepts -
Null hypothesis: The groups have a common intercept Test statistic: F(5, 120) = 0.717617
with p-value = P(F(5, 120) > 0.717617) = 0.611415
Distribution free Wald test for heteroskedasticity -
Null hypothesis: the units have a common error variance Asymptotic test statistic: Chi-square(6) = 4078.82 with p-value = 0
Test for normality of residual -
ANNEX II
ALBANIA
Model 1: OLS, using observations 1992-2014 (T = 23) Dependent variable: Government tax revenues / GDP
Coefficient Std. Error t-ratio p-value
Const −698.343 588.093 −1.1875 0.2601
VAT 29.6317 6.99903 4.2337 0.0014 ***
OPEN 0.0780977 0.108158 0.7221 0.4853
YPC 0.0101329 0.00801773 1.2638 0.2324
AG −0.114268 0.168143 −0.6796 .5108
POP 0.000206287 0.000174721 1.1807 0.2626
Inflation −0.0287624 0.0368093 −0.7814 0.4511 Unemployment_rate 0.333676 0.259275 1.2870 0.2245 FDI_in_USD −
2.98763e-010 2.3906e-09 −0.1250 0.9028 Remittances_in_usd −1.84214e-09 3.8882e-09 −0.4738 0.6449 Total_External_Debt −1.42929e-09 1.15739e-09 −1.2349 0.2426 Expense_to_GDP −0.00228261 0.05078 −0.0450 0.9650
Mean dependent var 19.50035 S.D. dependent var 10.65542 Sum squared resid 36.08042 S.E. of regression 1.811087 R-squared 0 985555 Adjusted R-squared 0.971111
F(11, 11) 68.22963 P-value(F) 1.72e-08
Log-likelihood −37.81353 Akaike criterion 99.62706 Schwarz criterion 113.2530 Hannan-Quinn 103.0539
Rho −0.218624 Durbin-Watson 2.389938
KOSOVO
Model 1: OLS, using observations 1991-2014 (T = 24) Dependent variable: Government tax revenues / GDP
Coefficient Std. Error t-ratio p-value
const 2.5046 10.7442 0.2331 0.8190
VAT 3.82927 2.18116 1.7556 0.1010
OPEN −0.0378057 0.137007 −0.2759 0.7866
YPC 0.002 1185 0.000459965 4.5913 0.0004 ***
AG 0.0168669 0.59127 0.0285 0.9776
POP −1.26499e-06 5.46113e-06 −0.2316 0.8202 Inflation −0.405469 0.192459 −2.1068 0.0537 * FDI_in_USD 1.62322e-08 7.50599e-09 2.1626 0.0484 ** Remittances_in_usd 1.14057e-09 2.391 9e-09 0.4770 0.6407 Total_External_Debt 2.42354e-010 1.14484e-09 0.2117 0.8354
Mean dependent var 13.87292 S.D. dependent var 11.70777 Sum squared resid 32.93602 S.E. of regression 1.533810 R-squared 0.989553 Adjusted R-squared 0.982837
F(9, 14) 147.3429 P-value(F) 2.67e-12
Log-likelihood −37.85268 Akaike criterion 95.70537 Schwarz criterion 107.4859 Hannan-Quinn 98.83075
MACEDONIA
Model 1: OLS, using observations 1997-2014 (T = 18) Dependent variable: Government tax revenues / GDP
Coefficient Std. Error t-ratio p-value
Const 75.6462 124.612 0.6071 0.5661
VAT 6.36954 4.63324 1.3747 0.2183
OPEN 0.0795038 0.0888549 0.8948 0.4054
YPC −0.000100738 0.00223077 −0.0452 0.9654
AG 0.785273 0.535365 1.4668 0.1928
POP −3.12354e-05 6.3 867e-05 −0.4936 0.6392 Inflation −0.268715 0.291366 −0.9223 0.3920 Unemployment_rate 0.0776892 0.26755 0.2904 0.7813 FDI_in_USD −
6.56257e-012 3.35286e-010 −0.0196 0.9850 Remittances_in_usd 9.31447e-09 1.91552e-08 0.4863 0.6440 Total_External_Deb −1.48572e-09 1.36169e-09 −1.0911 0.3171 Expense_to_GDP −0.022654 0.0492494 −0.4600 0.6617
Mean dependent var 31.56733 S.D. dependent var 2.216073 Sum squared resid 7.919647 S.E. of regression 1.148887 R-squared 0.905139 Adjusted R-squared 0.731226
F(11, 6) 5.204569 P-value(F) 0.027452
Log-likelihood −18.15167 Akaike criterion 60.30334 Schwarz criterion 70.98780 Hannan-Quinn 61.77658
Rho −0.257405 Durbin-Watson 2.499570
SERBIA
Model 1: OLS, using observations 1991-2014 (T = 24) Dependent variable: Government tax revenues / GDP
Coefficient Std. Error t-ratio p-value
const 941.776 373.446 2.5219 0.0268 **
VAT −15.6862 10.2292 −1.5335 0.1511
OPEN −0.393361 0.238111 −1.6520 0.1244
YPC 0.0129556 0.00299721 4.3225 0.001 ***
AG −5.92385 1.05343 −5.6234 0.0001 ***
POP −0.000114796 4.67954e-05 −2.4531 0.0304 **
Inflation 0.333794 0.100147 3.3330 0.0060 ***
Unemployment_rate −1.00126 0.617747 −1.6208 0.1310 FDI_in_USD −
6.22807e-011 1.85675e-09 −0.0335 0.9738 Remitta ces_in_usd −1.81688e-09 3.69136e-09 −0.4922 0.6315 Total_External_Debt −3.16498e-09 1.20867e-09 −2.6186 0.0224 ** Expense_to_GDP 0.178375 0.186605 0.9559 0.3580
Mean dependent var 24.52662 S.D. dependent var 19.54953 Sum squared resid 572.5288 S.E. of regression 6.907296 R-squared 0.934868 Adjusted R-squared 0.875163
F(11, 12) 15.65820 P-value(F) 0.000019
Log-likelihood −72.11864 Akaike criterion 168.2373 Schwarz criterion 182.3739 Hannan-Quinn 171.9877
MONTENEGRO
Model 1: OLS, using observations 1991-2014 (T = 24) Dependent variable: Government tax revenues / GDP
Coefficient Std. Error t-ratio p-value
Const −2333.19 628.747 −3.7109 0.0021 ***
VAT 5.89221 9.74684 0.6045 0.5545
OPEN −0.0585327 0.161915 −0.3615 0.7228
YPC 0.00131374 0.000553597 2.3731 0.0314 **
AG 0.701212 1.26104 0.5561 0.5864
POP 0.00382973 0.0010322 3.7103 0.0021 ***
Inflation 1.96844 1.22304 1.6095 0.1284
Remittances_in_usd −3.42292e-08 3.58331e-08 −0. 552 0.3546 Total_External_Debt −6.99256e-09 5.48696e-09 −1.2744 0.2219
Mean dependent var 22.41212 S.D. dependent var 21.29108 Sum squared resid 654.4750 S.E. of regression 6.605427 R-squared 0.937227 Adjusted R-squared 0.903749
F(8, 15 27.99474 P-value(F) 1.15e-07
Log-likelihood −73.72388 Akaike criterion 165.4478 Schwarz criterion 176.0502 Hannan-Quinn 168.2606
Rho −0.088497 Durbin-Watson 2.144789
BOSNIA-HERZEGOVINA
Model 1: OLS, using observations 1991-2014 (T = 24) Dependent variable: Government tax revenues / GDP
Coefficient Std. Error t-ratio p-value
Const −59.6963 79.2397 −0.7534 0.4658
VAT −1.98104 9.18045 −0.2158 0.8328
OPEN 0.126151 0.164662 0.7661 0.4584
YPC 0.000433862 0.00215659 0.2012 0.8439
G −0.513343 0.407301 −1.2604 0.2315
POP 7.40367e-06 1.86573e-05 0.3968 0.6985
Inflation −0.233982 0.691131 −0.3385 0.7408 Unemployment_rate 1.17097 0.750777 1.5597 0.1448 FDI_in_USD −1.49246e-08 4.03249e-09 −3.7011 0.0030 *** Remittances_in_usd 2.45728e-08 3.45134e-09 7.1198 <0.0001 *** Total_External_Debt 2.15806e-012 1.05201e-09 0.0021 0.9984
Expense_to_GDP −0.153356 0.183154 −0.8373 0.4188
Mean dependent var 33.55371 S.D. dependent var 22.13459
Sum squared resid 245.7313 S.E. of reg ession 4.525220 R-squared 0.978193 Adjusted R-squared 0.958204
F(11, 12) 48.93546 P-value(F) 3.12e-08
Log-likelihood −61.96874 Akaike criterion 147.9375 Schwarz criterion 162.0741 Hannan-Quinn 151.6879