NUTRITION AND FOOD SCIENCE
Application of response surface methodology (RSM) in condition
optimization for essential oil production from Citrus latifolia
Quoc Le Pham Tan*, Xinh Nguyen Thi Kieu, Nguyet Huynh Thi Kim and Xuyen Nguyen Thi Hong Institute of Biotechnology and Food Technology, Ho Chi Minh City university of Industry, Ho Chi Minh City - Vietnam
Abstract
This research shows the dependence of distillation time and ratio of water/peel on amount of essential oil after distilling. Researching and optimizing the factors for essential oil production by laboratory – scale distillation and the yield was evaluated using the Response Surface Methodology (RSM) with Central Composite Face-Centered (CCF) model. The regression equation obtained was shown below:
2 2
1 2 1 2
y = 0.997 - 0.015x + 0.04x - 0.107x - 0.042x .
There is the contrast between distillation time and ratio of water/peel with volume of essential oil received. Optimal result is volume of essential oil was 1 ml (y) with quantity of lemon peel/batch of 50g, ratio of water/peel (x1) was 6/1, distillation time (x2) in 20 minutes at temperature at 100oC. The essential oil from the
peel of C. latifolia was analysed by GC-MS method. A lot of compounds were identified of which limonene, β– pinene and γ–terpinenen were major components. Small amounts of trans-caryophyllene, 4-terpineol, α -terpinenen…were also detected.
Key words: CCF, C. latifolia, Essential oil, GC-MS, RSM
Introduction
The advantage of Citrus latifolia was high productivity and large size containing a large amount of water (Baomoi, 2008; Wikipedia, 2011).
C. latifolia was chosen as stable materials in food industry, especially in the field of beverage. However, C. latifolia has been known as fruit containing essential oil source from peel which has not been paid attention properly.
Optimization of conditions for processing is one of the most critical stages in the development of an efficient and economic bioprocess. Statistical methodologies involved used mathematical models for designing fermentation processes and analyzing the process results (Bas et al., 2007). RSM is a powerful mathematical model with a collection of statistical techniques where in, interactions between multiple process variables can be identified with fewer experimental trials. It is widely used to examine and optimize the operational variables for experiment designing, model developing and factors and conditions optimization (Cheynier et al.,
1983).
Therefore, our group carried out researching subject “Application of response surface methodology (RSM) in condition optimization for essential oil production from C. latifolia” to obtain high content of essential oil, contributing to the development of the oil production industry in general and lemon essential oil in particular in Vietnam.
Materials and Methods Sample collection
C. latifolia: large circular fruit, diameter 4.5 – 5cm, 70–100 gram piece of fruit, ratio of water/peel of 6/1, dark green peel and no insects. C. latifolia’s source is from Binh Thanh Hamlet, Binh Phu Commune, Ben Tre Province.
Experimental equipment
The grinding apparatus Philip (Volume of tank: 2000 ml, 500W, 15 000 rounds/minute, China).
The distilling apparatus Clevenger (Volume of boiled container: 500 ml, Germany).
The apparatus Hewlett-Packerd HP 5890 GC/5972 MS (USA) uses for GC-MS method. Samples were subjected to the GC column (Rt×5MS- 29m×250micron, 0.25micro film), at flow rate of 1ml/min at 250°C. Detector temperature was set at 280°C. MS scan mode: full
Received 26 October 2011; Revised 08 December 2011; Accepted 28 December 2011
*Corresponding Author Quoc Le Pham Tan
26 200°C and second programmed at 10°C/min to 300°C then held at this temperature for 5 min.
Methods
Essential oil processing
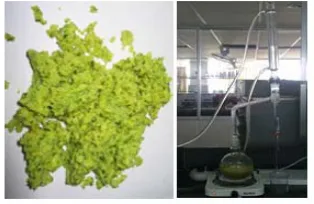
50g of peel was washed with water and ground in 30 seconds at 28±1°C. The ground peel fill by water and it distilled at 100°C in the apparatus Clevenger to obtain essential oil which was then condensed by cold water and measured in the small cylinder that determines the volume. The chemical composition of the essential oil from C.Latifolia
peel was analyzed by using GC-MS methodology.
Figure 1. The ground peel and the apparatus Clevenger.
Experimental design
Response surface methodology (RSM) was used to determine optimum conditions for distilling essential oil process. Two factors including ratio of water/peel (x1) and distillation time (x2) to target
distillation time function (obtained volume of essential oil - y) were determined using optimization method (Canh, 2004). Influence of factors to target function was described according to equation below:
2
1 1
n n n
o i i ii i i j i j
i i i j
y b
b x
b x
b x x
= = <
⎛
⎞
= +
+
⎜
⎟
+
⎝
⎠
∑
∑
∑
(1)In this study, n-value was 2 so equation (1) can be written:
2 2
o 1 1 2 2 12 1 2 11 1 22 2
y = b + b x + b x + b x x + b x + b x
(2)Table 1. Codes and actual levels of the in dependent variables for design of experiment.
Independent variables Symbols Coded levels
-1 0 +1 Ratio of water/peel
Distillation time (minute) XX1 2
5/1
16 6/1 20 7/1 24
Using model in this case is Central Composite Face (CCF). The star points are at the center of each face of the factorial space, so α = ±1. This variety requires 3 levels of each factor. CCF designs provide relatively high quality predictions over the entire design space and do not require using points outside the original factor range. Requires 3 levels for each factor (Mary, 2003; Cheynier et al, 1983). A 23 three level was used to
develop a statistical model for the optimization of process variables such as ratio of water/peel (5/1-7/1, w/w) and distillation time (16-24, minute). The design contains a total of 11 experimental trials with a full factorial design fashion and the replications of the central points.
Statistical analysis
The volume of essential oil was determined by actual response value. The data reported represented its mean. Statistical significance was evaluated using the Analysis of Variance (ANOVA) and p<0.05 was considered as significant (Tuan, 2008). Second-order polynomial regressed equations were established on the basis of the experimental data. Optimum parameters were defined by the software Modde version 5.0.
Results and Discussion
Table 2. Three level factorial composite design and experimental responses of dependent variable y (volume of essential oil, ml).
Run No Coded levels Real values Volume of essential oil (ml)
x1 x2 X1 X2 Observed Predicted(*)
1 2 3 4 5 6 7 8 9 10 11 -1 +1 -1 +1 -1 +1 0 0 0 0 0 -1 -1 +1 +1 0 0 -1 +1 0 0 0 5/1 7/1 5/1 7/1 5/1 7/1 6/1 6/1 6/1 6/1 6/1 16 16 24 24 20 20 16 24 20 20 20 0.83 0.8 0.9 0.87 0.9 0.87 0.9 1 1 1 1 0.8226 0.7926 0.9026 0.8726 0.9047 0.8473 0.9147 0.9947 0.9968 0.9968 0.9968 (*): Running the software Modde version 5.0 to predict obtained model
Based on the RSM method, result of experimental analysis was presented in table 3 and table 4 below.
Table 3. Analysis of variance (ANOVA) for the fitted quadratic polynomial model for essential oil production
y DF SS MS F p SD
Total 11 9.2727 0.842973
Constant 1 9.21863 9.21863
Total Corrected 10 0.05407 0.0054073 0.07353
Regression 5 0.05363 0.0107262 121.308 0.000 0.10357
Residual 5 0.00044 8.84E-05 0.0094
Lack of Fit 3 0.00044 0.0001474 -- -- 0.01214
Pure Error 2 0 0 --
The pvalue was used as a tool to check the
significance of each of the coefficients, which in turn indicated the pattern of the interactions between the variables. The smaller value of p was more significant to the regression. According to the
ANOVA table, the regression model is significant at the considered confidence level (95%) since the regression has pvalue<0.05 and the F value (121.3)
were 6 times more than the F listed value (F(4,2)=19.3).
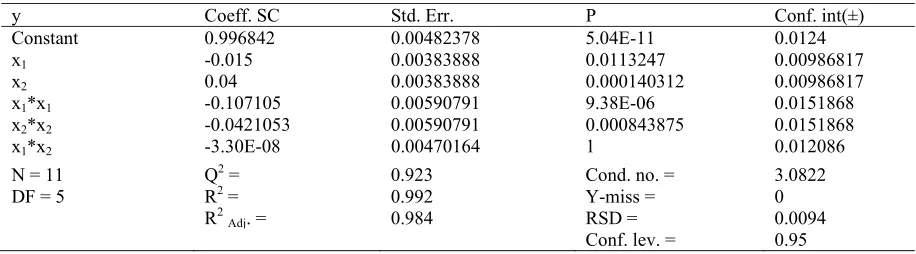
Table 4. Results of regression analysis of second order polynomial model for optimization of essential oil production.
y Coeff. SC Std. Err. P Conf. int(±)
Constant 0.996842 0.00482378 5.04E-11 0.0124
x1 -0.015 0.00383888 0.0113247 0.00986817
x2 0.04 0.00383888 0.000140312 0.00986817
x1*x1 -0.107105 0.00590791 9.38E-06 0.0151868
x2*x2 -0.0421053 0.00590791 0.000843875 0.0151868
x1*x2 -3.30E-08 0.00470164 1 0.012086
N = 11 Q2 = 0.923 Cond. no. = 3.0822
DF = 5 R2 = 0.992 Y-miss = 0
R2
Adj. = 0.984 RSD = 0.0094
Conf. lev. = 0.95
The table shows coefficients in the regression equation. Distillation time and ratio of water/peel are absolutely independence and do not interact together (pvalue>0.05) and have strong influence to
have pvalue<0.05, it means these factors effect on the
28 y = 0.997 – 0.015x1 + 0.04x2 – 0.107x12 –
0.042x22 (3)
Equation (3) showed that the regression coefficients of linear term X1, X2 and all quadratic
coefficients of X1 and X2 were significant at
pvalue<0.05 level and none-interactive coefficient of
X1X2 were significant at pvalue>0.05 level. The
variable with the largest effect on volume of essential oil were the linear term X2 and the quadric
term X12.
Table 4 showed that the experimental yields fitted the second order polynomial equation well as indicated by high R2 (coefficient of determination)
value was 0.992. The R2
adj was 0.984 and the Q2
was 0.923, which indicates that the model is good (for a good statistical model, the R2 value should be
in the range of 0–1.0, and the nearer to 1.0 the value is, the more fit the model is deemed to be; predictive ability of model manifest by Q2 with fail-safety achieved R2).
With first-level coefficients: distillation time was covariant and ratio of water/peel was contravariant when comparing its with obtained content of essential oil (influence level of distillation time is stronger than). With second-level coefficients: both distillation time and ratio of water/peel was contravariant when comparing its with obtained content of essential oil (influence level of ratio of water/peel is stronger than).
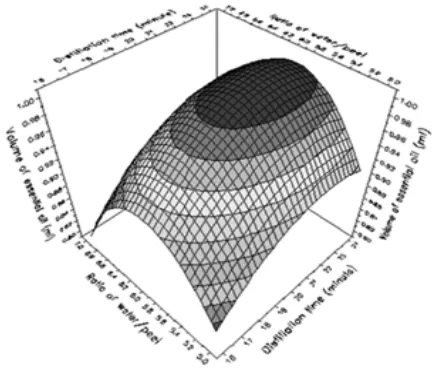
In Figure 2 and 3, the three-dimensional contour plot and response surface graph are displayed according to Equation (3). The graph determined the contribution of the distillation time and ratio of water/peel on volume of essential oil. The contours around the stationary point were elliptical and became elongated more and more along the distillation time axis, which meant that a small change of the response value would require a small movement along the distillation time axis. Figure 3 indicates that the distillation time and ratio of water/peel exerted a slight effect on volume of essential oil. Distillation time range from 21 to 23 minute and ratio of water/peel range from 5.8 to 6.1 was determined as the optimal condition for achieving the maximal volume of essential oil.
Figure 2. Response surface plot of distillation time versus ratio of water/peel.
Figure 3. Isoresponse contour plot of distillation time versus ratio of water/peel.
To carry out optimizing with obtained regression equation and result from the software Modde 5.0 by experimentation.
Table 5. Result of optimum condition.
Result Distillation time (minute) Ratio of water/peel Volume of essential oil Predictive model
Figure 4. Parity plot showing the distribution of experimental versus predicted values by the
mathematical model of the y values.
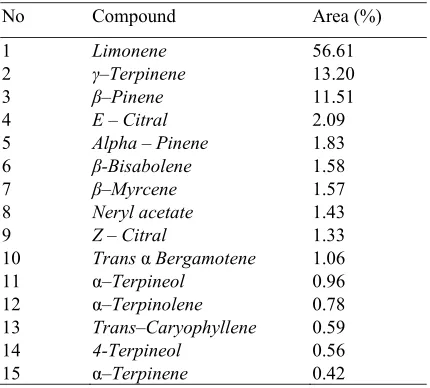
Table 6. Percentage composition of the essential oil from peel of C. latifolia.
No Compound Area (%)
1 Limonene 56.61
2 γ–Terpinene 13.20
3 β–Pinene 11.51
4 E – Citral 2.09
5 Alpha – Pinene 1.83
6 β-Bisabolene 1.58
7 β–Myrcene 1.57
8 Neryl acetate 1.43
9 Z – Citral 1.33
10 Trans α Bergamotene 1.06
11 α–Terpineol 0.96
12 α–Terpinolene 0.78 13 Trans–Caryophyllene 0.59
14 4-Terpineol 0.56
15 α–Terpinene 0.42
Response analysis revealed maximum essential oil volume by distilling peel of C. latifolia could be achieved at the conditions when distillation time was 20 minutes; ratio of water/peel was 6/1. Under these optimum process conditions a maximum essential oil of 1ml (~2%, w/w) was obtained. The matching quality of the data obtained by the model proposed in Equation (3) was evaluated considering the correlation coefficient, R2, between the
experimental and modeled data. The mathematical adjustment of those values generated a R2 = 0.984,
revealing that the model could not explain only 2% of the overall effects, showing that it is a robust statistical model. The parity plot shows a
satisfactory correlation between the experimental and predictive values (Figure 4).
GC-MS methodology used for determining the chemical composition and content of the optimization sample. Results showed in the Table 6.
The highest content in the essential oil are limonene, β–pinene and γ–terpinenen. It has characteristic flavour and light yellow. Density of essential oil is lighter than water and it can dissolve absolutely in the alcohol 960 (Essential
oil/alcohol=1/1, v/v).
Conclusions
From studies quoted above, we come to a conclusion that distillation time and ratio of water/peel have strong influence on revoked frequency of essential oil from C. latifolia peel.
Using the optimal method of target function, we exposed regression equation and this equation can be applied on actual model:
2 2
1 2 1 2
y = 0.997 - 0.015x + 0.04x - 0.107x - 0.042x .
This equation predict optimal result (table 4) with quantity of lemon peel/batch of 50g, however we can accept optimal result according to actual result because between actual result and predictive result have mere error: distillation time of 20 minute, ratio of water/peel of 6/1, optimal content of essential oil 1ml/50g sample with Limonene (56.62%), γ–Terpinene (13.2%), β-Pinene (11.51%). Essential oil after distilling achieves 1ml/50g peel (equivalent 2%, w/w). The productivity is high and we recommended essential oil from C. latifolia as a viable possibility in Vietnam.
References
Bas, D., H. Ismail and J. Boyaci. 2007. Modeling and optimization. Usability of response surface methodology. J. Food Eng. 78:836-845.
Canh Nguyen. 2004. Methods of Optimization. Ho Chi Minh city University of Technology Press. Ho Chi Minh City (Vietnamese version). Cheynier, V., M. Feinberg, C. Chararas and C.
Ducauze. 1983. Application of response surface methodology to evaluation of bioconversion experimental conditions. Appl. Env. Microbiol. 45:634-639.
30 Minh city Press. Ho Chi Minh City (Vietnamese version).
Gamarra, F. M. C., L. S. Sakanaka, E. B. Tambourgi and F. A. Cabral. 2006. Influence on the quality of essential lemon oil by distillation process, Brazillian J. Chem. Eng. 23(1):147-151.
Hoang Nguyen Minh. 2006. Research essential oil from peel of citrus – Rutaceae. Ho Chi Minh city Open University Press. Ho Chi Minh City (Vietnamese version).
Lo Vu Ngoc. 2002. The essential oil plant in Vietnam. Science and Technology Press. Ho Chi Minh City (Vietnamese version).
Ngach Tran Xuan. 2007. Material in food processing. Da Nang University of Technology Press. Da Nang (Vietnamese version).
Nghe Van Đinh. 2000. Natural flavour processing. Science and Technology Press. Ha Noi (Vietnamese version).
Mary Natrella, Carroll Croarkin and Will Guthrie. 2003. Engineering Statistics Handbook, Statistical Engineering Division, NIST2003. Tuan Nguyen Van. 2008. Analyse data and plot by
R. Vietnam National University-Ho Chi Minh city Press. Ho Chi Minh City (Vietnamese version).