IJSRSET1738245 | Received : 01 Dec 2017 | Accepted : 27 Dec 2017 | November-December-2017 [(3) 8 : 878-883]
© 2017 IJSRSET | Volume 3 | Issue 8 | Print ISSN: 2395-1990 | Online ISSN : 2394-4099 Themed Section : Engineering and Technology
878
Comparative Study of Vibration Signal Using Wavelet Transform
Ayubkhan N. Mulani, Sangita N. Gujar
Assistant Professor, P K Technical Campus Chakan, Pune, Maharashtra, India
ABSTRACT
Scientists have developed mathematical methods to imitate the processing performed by our body and extract the frequency information contained in a signal. These mathematical algorithms are called transforms and the most popular among them is the Fourier Transform. The method to analyze non-stationary signals is to first filter different frequency bands, cut these bands into slices in time, and then analyze them. The wavelet transform uses this approach. The wavelet transform or wavelet analysis is probably the most recent solution to overcome the shortcomings of the Fourier transform. In wavelet analysis the use of a fully scalable modulated window solves the signal-cutting problem. The window is shifted along the signal and for every position the spectrum is calculated. Then this process is repeated many times with a slightly shorter (or longer) window for every new cycle.
Keywords : Vibration Analysis, Spectral Analysis, Wavelet Transform Vibration Signal.
I.
INTRODUCTION
To overcome the limitation of FT, Short Time Fourier Transform (STFT) was proposed. There is only a minor difference between STFT and FT. In STFT, the signal is divided into small segments, where these segments (portions) of the signal can be assumed to be stationary. For this purpose, a window function "w" is chosen. The width of this window in time must be equal to the segment of the signal where it is still be considered stationary. By STFT, one can get time-frequency response of a signal simultaneously, which can’t be obtained by FT. The short time Fourier transform for a real continuous signal is defined as:
X (f, t) =
e
dt
t
w
t
x
(
)
(
)
*]
2jft[
Where the length of the window is (t-) in time such that we can shift the window by changing value of t, and by varying the value we get different frequency response of the signal segments.
The basis set of wavelets is generated from the mother or basic wavelet is defined as:
a,b(t) =
a
b
t
a
1
; a, b and a>0 -- (1.1)
The variable ‘a’ (inverse of frequency) reflects the scale (width) of a particular basis function such that its large value gives low frequencies and small value gives high frequencies. The variable ‘b’ specifies its translation along x-axis in time. The term 1/
a
is used for normalization.II.
LITERATURE REVIEW
1-D Discrete wavelet transform
The discrete wavelets transform (DWT), which transforms a discrete time signal to a discrete wavelet representation. The first step is to discretise the wavelet parameters, which reduce the previously continuous basis set of wavelets to a discrete and orthogonal / ortho normal set of basis wavelets.
m,n(t) = 2m/2 (2mt – n) ; m, n such that - < m, n <
--- (2.5)
III.
THE SIMULATION METHOD
Five types of Wavelet Transform Implemented:
1) Haar Wt
2) Coiflet-5 Wt
3) Daubenchies
4) Bior
5) Symlet-5
In wavelet decomposing of an Signal, the decomposition is done row by row and then column by column. For instance, here is the procedure for an N x M image. You filter each row and then down-sample to obtain two N x (M/2) images. Then filter each column and subsample the filter output to obtain four (N/2) x (M/2) images.
A valid signal model is necessary for accurate Vibration detection. Normally, a vibration waveform is represented as a sinusoid and normal distribution white noise (Gaussian noise) as follows:
1 Haar wavelet
The Haar transform is based on the calculations of the averages (approximation co-efficient) and differences (detail co-efficient). Given two adjacent pixels a and b,
the principle is to calculate the average
2 ) (a b
s and
the difference
d
a
b
. If a and b are similar, s will be similar to both and d will be small, i.e., require few bits to represent. This transform is reversible, since2 d s
a and
2 d s
b and it can be written using
matrix notation as
2
/
1
2
/
1
)
,
(
)
,
(
s
d
a
b
1
1
= (a,b)A,
2
/
1
1
)
,
(
)
,
(
a
b
s
d
2
/
1
1
=
(
s
,
d
)
A
1In mathematics, the Haar wavelet is a sequence of rescaled "square-shaped" functions which together form a wavelet family or basis. Wavelet analysis is similar to Fourier analysis in that it allows a target function over an interval to be represented in terms of an orthonormal function basis.
IV.
EXPERIMENT RESULT
Tool Used for analysis is Matlab 8.3
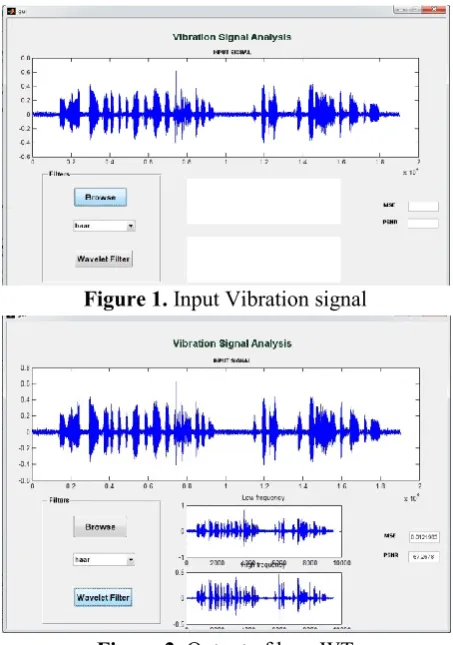
Simulation of the proposed system has been done in Matlab software. Simulation results are shown in fig
Analysis by haar wavelet
Figure 1. Input Vibration signal
Figure 2. Output of haar WT
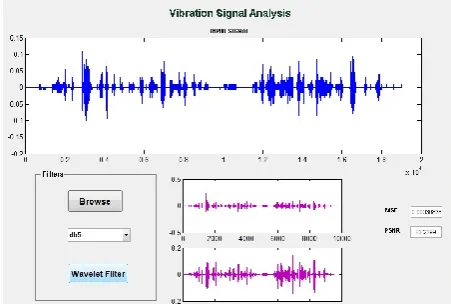
1. Analysis by Coiflet wavelet:
Coiflets are discrete
wavelets
designed byIngrid
Daubechies
, at the request ofRonald Coifman
, to have scaling functions with vanishing moments. The wavelet is near symmetric, their wavelet functions have vanishing moments and scaling functions , and has been used in many applications usingCalderón-Zygmund Operators
2. Coiflet Coefficients
Figure 3. Output Result- Coiflets wavelet
3. Analysis by Daubechies wavelet:
Daubechies wavelet:
The Daubechies wavelets, based on the work of
Ingrid
Daubechies
, are a family oforthogonal wavelets
defining adiscrete wavelet transform
and characterized by a maximal number of vanishingmoments
for some givensupport
. With each wavelet type of this class, there is a scaling function (called the father wavelet) which generates an orthogonal multiresolution analysis.Figure 4. Output: Daubechies wavelets
4. Analysis by Biorthogonal wavelet:
Bior Wavelet
It is well known that bases that span a space do not have to be orthogonal. In order to gain greater flexibility in the construction of wavelet bases, the orthogonality condition is relaxed allowing semi -orthogonal, biorthogonal or non orthogonal wavelet bases. Biorthogonal Wavelets are compactly supported symmetric wavelets. The symmetry of the filter coefficients is often desirable since it results in linear phase of the transfer function . In the biorthogonal case,
rather than having one scaling and wavelet function, there are two scaling functions that may generate different multiresolution analysis, and accordingly two different wavelet functions.The dual scaling and wavelet functions have the following properties:
1. The y are zero outside of a segment.
2. The calculation algorithms are maintained, and thus very simple.
3. The associated filters are symmetrical.
4. The functions used in the calculations are easier to build numerically than those used in the Daubechies wavelets.
Figure 5. Output Result- Bior wavelet
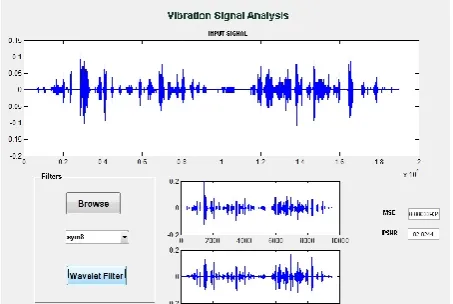
5. Analysis by Symlet wavelet: Symlet wavelet
In applied mathematics, symlet wavelets are a family of wavelets. They are a modified version of Daubechies wavelets with increased symmetry.
Figure 6. Output Result Symlet wavelet
V.
Mathematical Analysis by Wavelet
Transform
Filter bank is the building block of discrete-time wavelet transform
For 1-D signals, two-channel filter bank is depicted below
It converts an input series x0, x1, ..xm, into one
high-pass wavelet coefficient series and one low-high-pass wavelet coefficient series (of lengthn/2 each) given by:
where sm(Z) and tm(Z) are called wavelet filters, K is
the length of the filter, and i=0, ..., [n/2]-1.
Calculation of Peak Signal to Noise Ratio And Mean Square Error:
Where R(row=255) is the maximum fluctuation in the input signal.
Where, M and N are the number of rows and columns in the input signal respectively.
I1(m , n) and I2(m , n) are the two input signal.
Tabular form PSNR:
Tabular form MSE:
VI.
Graphical PSNR comparison
Figure 7. PSNR for band0 signal
62 64 66 68
1 band0
Figure 8. PSNR for band1 signal
Figure 9. PSNR for band2 signal
Figure 10. PSNR for band3 signal
VII.
Graphical MSE comparison
Figure 11. PSNR for band0 signal
Figure 12. PSNR for band1 signal
Figure 13. PSNR for band2 signal
Figure 14. PSNR for band3 signal
VIII.
CONCLUSION
Analysis of vibration signal and the results of the investigation demonstrate the components of signal. The results of testing various popular types of the WT show different values of PSNR and MSE. From the rsult we conclude that,
In this project work, five wavelets are implemented . From result we conclude that Peak signal to noise ratio is better in Haar
wavelet transform as compared to other wavelets
Mean Square Error is also less in Haar wavelet transform
Wavelet Transform method is better to analyze over conventional method .
80 82 84 86
2 band1
2 band1
80 82 84 86
3 band2
3 band2
80 82 84 86
4 band3
4 band3
0 0.02 0.04
1 band0
1 band0
0 0.0002 0.0004
2 band1
2 band1
0.00026 0.00028 0.0003 0.00032 0.00034
4 band3
4 band3
0 0.0002 0.0004
3 band2
IX.
Applications
Fault Detection In Auto-industry
Bearing Fault Detection
Applications In Petrochemical Industry
System Monitoring
Noise Reduction
X.
REFERENCES
[1]. T. Ranchin and L. Wald, "Fusion of high spatial and spectral Resolution images: The arsis concept and its implementation,' Photogramm. Eng. Remote Sensing, vol. 66, pp. 49-61, 2000.
[2]. Soma sekhar. A, Giri Prasad M. N, (2011) 'Novel approach of image fusion on MR and CT images using wavelet transforms' IEEE.
[3]. Ligia Chiorean, Mircea-Florin Vaida, (2009) 'Medical image fusion based on Discrete wavelet transforms using java technology', Proceedings of the ITI 2009 31st Int. Conf. on Information Technology Interfaces, June 22-25, Cavtat, Croatia
[4]. Piotr porwik, Agnieszka lisowska, (2004) 'The Haar-wavelet transform in digital image processing'.
[5]. Susmitha Vekkot, and Pinkham Shukla, (2009) 'A Novel architecture for wavelet based image fusion'World academy of science, engineering and technology.
[6]. Shen, jiachen ma, and Liyong ma Harbin, (2006) 'An Adaptive pixel-weighted image fusion algorithm based on Local priority for CT and MR images, IEEE
[7]. William f. Herrington, Berthoid k.p. Horn, and lchiro masaki, (2005) 'Application of the discrete Haar wavelet transform to image fusion for night-time driving 'IEEE.
[8]. Mohamed I. Mahmud, Moawad I. M. Dessouky, Salah Deyab, and Fatma h. Elfouly, (2007) 'Comparison between haar and daubechies wavelet transforms on FPGA technology 'world academy of science, engineering and technology. [9]. M. Aguilar and A. L. Garrett,
"Neurophysiologically-motivated sensor fusion for visualization and characterization of medical imagery,' presented at the Fusion 2001, Montreal, QC, Canada.