RESEARCH
Derivative-free neural network
for optimizing the scoring functions associated
with dynamic programming of pairwise-profile
alignment
Kazunori D. Yamada
1,2*Abstract
Background: A profile-comparison method with position-specific scoring matrix (PSSM) is among the most accurate alignment methods. Currently, cosine similarity and correlation coefficients are used as scoring functions of dynamic programming to calculate similarity between PSSMs. However, it is unclear whether these functions are optimal for profile alignment methods. By definition, these functions cannot capture nonlinear relationships between profiles. Therefore, we attempted to discover a novel scoring function, which was more suitable for the profile-comparison method than existing functions, using neural networks.
Results: Although neural networks required derivative-of-cost functions, the problem being addressed in this study lacked them. Therefore, we implemented a novel derivative-free neural network by combining a conventional neural network with an evolutionary strategy optimization method used as a solver. Using this novel neural network system, we optimized the scoring function to align remote sequence pairs. Our results showed that the pairwise-profile aligner using the novel scoring function significantly improved both alignment sensitivity and precision relative to aligners using existing functions.
Conclusions: We developed and implemented a novel derivative-free neural network and aligner (Nepal) for optimizing sequence alignments. Nepal improved alignment quality by adapting to remote sequence alignments and increasing the expressiveness of similarity scores. Additionally, this novel scoring function can be realized using a simple matrix operation and easily incorporated into other aligners. Moreover our scoring function could poten-tially improve the performance of homology detection and/or multiple-sequence alignment of remote homologous sequences. The goal of the study was to provide a novel scoring function for profile alignment method and develop a novel learning system capable of addressing derivative-free problems. Our system is capable of optimizing the per-formance of other sophisticated methods and solving problems without derivative-of-cost functions, which do not always exist in practical problems. Our results demonstrated the usefulness of this optimization method for derivative-free problems.
Keywords: Dynamic programming, Profile alignment, Neural network, Evolutionary strategy, Derivative-free optimization
© The Author(s) 2018. This article is distributed under the terms of the Creative Commons Attribution 4.0 International License (http://creativecommons.org/licenses/by/4.0/), which permits unrestricted use, distribution, and reproduction in any medium, provided you give appropriate credit to the original author(s) and the source, provide a link to the Creative Commons license, and indicate if changes were made. The Creative Commons Public Domain Dedication waiver (http://creativecommons.org/ publicdomain/zero/1.0/) applies to the data made available in this article, unless otherwise stated.
Open Access
*Correspondence: [email protected]
1 Graduate School of Information Sciences, Tohoku University, 6-3-09, Aramaki-Aza-Aoba, Aoba-ku, Sendai 980-8579, Japan
Background
The profile-comparison alignment method with a posi-tion-specific scoring matrix (PSSM) [1] is a highly accu-rate alignment method. The PSSM is a two dimensional vector (matrix) that stores sequence lengths, with each element in the vector consisting of a 20-dimensional numerical vector where each value represents the like-lihood of the existence of each amino acid at a site in a biological sequence. Here, we designed the vector inside a PSSM as a position-specific scoring vector (PSSV). In profile alignment, cosine similarity or the correlation coefficient between two PSSVs is generally computed to measure similarity or dissimilarity between the two sites in the sequences of interest using dynamic programming (DP) [2, 3]. Profile alignment methods using these func-tions have long been used successfully [4], and the per-formance of profile alignment has improved in recent decades. As examples, HHalign improved alignment quality using profiles constructed with a hidden Markov model, which provided more information than a PSSM [5], MUSTER incorporated protein-structure informa-tion into a profile [3], and MRFalign utilized Markov ran-dom fields to improve alignment quality [6]. However, although various methods have been devised from differ-ent perspectives, studies to develop the scoring function for PSSV comparison using sophisticated technologies are lacking. Moreover, there remains room for improve-ment in the performance of sequence alignimprove-ment, espe-cially for remote sequence alignment [7–9]; therefore, it is important to continue developing aligners from various perspectives. Although cosine similarity or a correlation coefficient is normally used for comparison of PSSVs, in principle, they are unable to capture nonlinear relation-ships between vectors. However, the similarity between two amino acid positions is not always explained by lin-ear relationship, which is merely one of a particular case of a nonlinear relationships. Because scoring functions are directly related to the quality of biological-sequence alignment, development of a novel function capable of capturing nonlinear relationships reflecting similarity between two sites in sequences is required.
The expression of nonlinear functions can be realized by neural networks. A neural network is a computing system that mimics biological nervous systems. Theo-retically, if a proper activation function is set on middle layer(s) of a network, it can approximate any function including nonlinear functions [10]. Neural networks have attracted interest from various areas of research, includ-ing bioinformatics, due to recent advances in computa-tional technologies and the explosive increase in available biological data. In recent years, these algorithms have been vigorously applied for bioinformatics purposes, including several studies associated with application of
deep neural network models to predict protein–protein interactions [11, 12], protein structure [13, 14], and vari-ous other biological conditions, such as residue-contact maps, backbone angles, and solvent accessibility [15, 16]. These neural networks used backpropagation as a solver, which requires a derivative-of-cost function to search for optimal parameters [17]. However, few studies have implemented derivative-free neural networks.
Since neural networks are capable of implementing nonlinear functions, they are suitable for developing novel scoring functions for PSSV comparison. Therefore, in this study we used a neural network to optimize a non-linear scoring function associated with PSSV compari-son by combining two PSSVs as an input vector. Since we lacked a target vector normally required to imple-ment supervised learning, we calculated the entire DP table for the input sequences, and the difference between the resultant alignment and the correct alignment was used to calculate cost of learning. Due to the nature of the problem, we could not use the backpropagation method as a solver for optimal weight and bias searches, because we lacked the derivative-of-cost function nor-mally required. These issues are common when applying such methods to real-world problems. It is impossible to calculate a derivative for problems where the output vectors are not directly used for computation of cost function such as cross entropy or square error [18]. In this study, the outputs of a neural network were similar-ity score between two PSSVs and not directly used for computation of the cost function but indirectly used for computation of dynamic programming. The possibility of computing neural network inferences without derivatives would be useful for solving such problems.
Methods Dataset
We downloaded the non-redundant subset of SCOP40 (release 1.75) [22], in which sequence identity between any sequence pair is < 40%, from ASTRAL [23]. We selected the remote-sequence subset, because we wanted to improve remote-sequence alignment quality, which is generally a difficult problem for sequence aligners. SCOP is a protein-domain database where sequences are classi-fied in a hierarchical manner by class, fold, superfamily, and family. To guarantee independence between a learn-ing and test dataset, all notations of superfamily in the dataset were sorted in alphabetical order, and all super-families, the ordered numbers of which were multiples of three, were classified into a learning dataset, whereas the others were classified into a test dataset. This proce-dure is often used in existing studies for protein sequence analysis [8, 9], in order to cope with a problem of overfit-ting. We obtained 3726 and 6843 sequences in the learn-ing and test datasets, respectively. We then randomly extracted a maximum of 10 pairs of sequences from each superfamily to negate a bias induced by different vol-umes of each superfamily and used these sequence pairs for subsequence construction of a PSSM. We confirmed that sequences in each pair were from the same family in order to obtain decent reference alignments. We ulti-mately obtained 1721 and 3195 sequence pairs in the learning and test datasets, respectively. These datasets are provided at https://github.com/yamada-kd/nepal. Construction of profiles and reference alignments
We constructed PSSMs for all sequences in the learning and test datasets using DELTA-BLAST version 2.2.30+ with the Conserved Domain Database for DELTA-BLAST version 3.12 [24]. Reference alignments were constructed through structural alignment of protein steric structures, which corresponded to sequences of interest using TM-align [25]. All structure data were also downloaded from ASTRAL [23].
Learning network
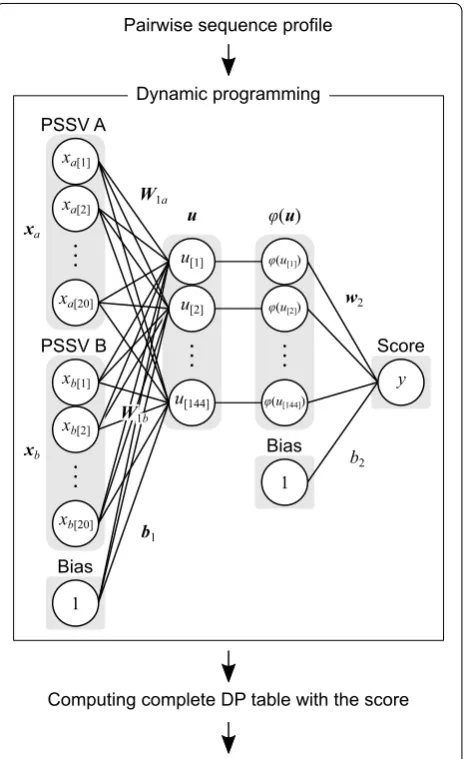
Figure 1 shows the learning network computed in this study. We calculated similarity scores between two PSSVs using the neural network. Initially, the summation of matrix products between xa (PSSV A) and W1a, xb (PSSV B) and W1b, and 1 (bias) and b1 in the neural network were calculated. Here, xa and xb were 20-element vector calculated from a DELTA-BLAST search, where each ele-ment of the vector represented the likelihood of existence of each amino acid, and W1a, W1b, 1, and b1 were weight and bias parameters of the neural network. The resultant vector was transformed by an activating function, φ(u).
The rectified linear unit [26] was utilized as the activation function:
The summation of the dot products between the trans-formed vector, φ(u) and w2, and 1 and b2 was calculated, where u was a vector representing the middle layer, and w2, 1, and b2 were parameters of the neural network. The
(1) ϕ(u)=max(0, u).
PSSV B Score
PSSV A
Bias
xa
xb
w2
b2
(u)
Bias
W1a
b1
1
y
1
W1b
Pairwise sequence profile
Dynamic programming
xa[1]
xa[20]
(u[144]) u[144]
xa[2]
xb[1]
xb[20] xb[2]
(u[2])
(u[1])
u[2] u[1]
u
Computing complete DP table with the score
resultant value was used as the similarity score for the two sites. Namely, the forward calculation was computed by the equation:
where y, a scalar value, is the similarity score.
The complete DP table was calculated using the simi-larity score, and a final pairwise alignment was produced. The pairwise alignment and its corresponding reference alignment were compared to each other, and an align-ment sensitivity score was calculated. Subtraction of the alignment-sensitivity score from 1 was used as the cost for searching the optimal weight using the neural net-work with CMA-ES.
We set the weights W1a and W1b equal to each other (shared weight) in order to apply the same value to the network outputs, even though the input order of the two PSSVs was opposite one another:
The number of units of the middle layer was set to 144. To compute backward calculations for the network, we used CMA-ES. As hyperparameters for CMA-ES, we set σ, λ, and μ to 0.032, 70, and 35, respectively. Here, σ is almost equivalent to the step size (learning rate) of the normal gradient-descent method, and λ and μ indi-cate the number of descendant and survival individuals in the evolutionary process, respectively. We input train-ing datasets into the learntrain-ing system in a batch manner. The maximum number of epochs was set to a relatively small number (150) to accommodate our computational environment. During learning, the performance of the scoring function was evaluated on the validation data-set starting from the 50th epoch to the final epoch in five steps, and a scoring function that maximized the valida-tion score was selected as the final product of the learn-ing process. The initial weight and bias were derived from parameters that mimicked the correlation coefficient. To generate the initial weight, we randomly generated 200,000 PSSV pairs and learned them using multilayer perceptron with hyperparameters (the dimensions of the weight and activating function) identical to those already described. In addition to the parameters, we simultane-ously optimized the open- and extension-gap penalties, the initial values of which were set to − 1.5 and − 0.1, respectively. The source code for our learning method is provided at https://github.com/yamada-kd/nepal.
Alignment algorithm
In this study, we implemented the semi-global alignment method (global alignment with free-end-gaps) [27, 28].
(2)
y=w2ϕ(xaW1a+xbW1b+b1)+b2,
(3)
W1a=W1b.
Metrics of alignment quality
Alignment quality was evaluated using alignment sensi-tivity and precision [9]. The alignment sensitivity was cal-culated by dividing the number of correctly aligned sites by the number of non-gapped sites in a reference align-ment. By contrast, alignment precision was calculated by dividing the number of correctly aligned sites by the number of non-gapped sites in a test alignment.
Calculation of residue interior propensity
The relative accessible surface area (rASA) for residues of all proteins in the learning and test datasets was cal-culated by areaimol in the CCP4 package version 6.5.0 [29]. The residues associated with rASA < 0.25 were counted as interior residues, and the other residues were counted as surface residues based on methods used pre-viously [30]. We divided the ratio of the interior residues by the background probability associated with these resi-dues to calculate the residue interior propensity, which represented the likelihood of a residue existing inside a protein. A propensity > 1 signified that the probability of the residue being inside the protein was higher than expected.
Statistical analysis
Statistical tests, including Wilcoxon signed-rank test with Bonferroni correction and Spearman’s rank correlation, were computed using the functions pairwise.wilcox.test() and cor.test() from R version 2.15.3 ( https://cran.r-pro-ject.org/), respectively.
Results and discussion
Gap optimization of existing functions
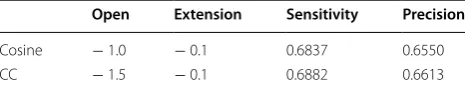
First, we conducted gap-penalty optimization of the existing scoring functions, such as cosine similar-ity and correlation coefficient, on the learning dataset. We computed both alignment sensitivity and precision for aligners using these functions, changing open- and extension-gap penalties by increments of 0.1 from − 2.0 to − 0.6 and from − 0.4 to − 0.1, respectively, with the best alignment sensitivity selected as the optimal combi-nation. As shown in Table 1, the best gap-penalty com-bination for cosine similarity and correlation coefficient was (− 1.0, − 0.1) and (− 1.5, − 0.1), respectively.
Table 1 Gap optimization of the existing scoring function
Open and extension indicate optimized open- and extension-gap penalties, respectively, and cosine and CC represent aligners using cosine similarity and correlation coefficient as scoring functions, respectively
Open Extension Sensitivity Precision
Cosine − 1.0 − 0.1 0.6837 0.6550
Optimization of the scoring function and gap penalties We then optimized the scoring function on the neural network with CMA-ES. During learning, we randomly divided the learning dataset into two subsets (train-ing and validation datasets) and observed train(train-ing and validation curves to confirm overfitting did not occur. The learning and validation dataset included 1536 and 160 pairwise PSSM sets and the corresponding refer-ence alignments as targets, respectively. Because calcu-lation of learning using our parameter settings requires > 100,000 × DP (the size of the training dataset × λ) per epoch, the consumption of computer resources was large, and calculation time was long, even when 24 threads were used with the C++ program. Therefore, we set the maximum limit for epoch to a relatively small number (150). To maximize the learning within the finite learn-ing time, we monitored the performance of intermedi-ate scoring functions on the validation dataset every fifth epoch. According to the validation scores, we ultimately selected a scoring function derived from the 145th epoch, which maximized the validation score, as the final product of learning. In addition to the scoring function, open- and extension-gap penalties are also vital param-eters for DP, which outputs optimal alignments against four parameters, including the pairwise sequences, a scoring function, and open- and extension-gap penalties. We optimized the gap penalties along with other param-eters, and simultaneously optimized gap penalties using a scoring function to obtain final weight and bias matri-ces representing the substance of a novel scoring func-tion and optimal gap-penalty combinafunc-tions, respectively. Our results allowed realization of an optimal combina-tion of open- and extension-gap penalties for the final weight and bias matrices (approximately − 1.7 and − 0.2, respectively).
We implemented a pairwise-profile aligner with the weight and bias matrices as a novel scoring function and named it Neural network Enhanced Profile Align-ment Library (Nepal). Nepal accepts pairwise sequences and their corresponding PSSM as an input and outputs a pairwise alignment for the input sequences. The scor-ing function is performed by a neural network, and the similarity score, y, between two PSSVs (xa and xb) is cal-culated using Eq. 2, with three weight (W1a, W1b, and w2) and two bias (b1 and b2) matrices the final products of learning. Our aligner and scoring function (weight and bias matrices) can be downloaded from https://github. com/yamada-kd/nepal.
Benchmarking of Nepal and other aligners using an existing function on the test dataset
We then conducted a benchmark test of Nepal and other aligners using an existing function on the test dataset. In
addition to profile-comparison methods, we examined the performance of sequence-comparison aligners with different substitution matrices, such as BLOSUM62 [31] and MIQS [32], as references. We used − 10 and − 2 as open- and extension-gap penalties, respectively, based on a previous study [32]. When calculating alignment qual-ity, the test dataset was further categorized into remote and medium subsets depending on the pairwise sequence identity of the reference alignments. The remote and medium subsets included sequence pairs where each sequence identity was not < 0 and < 20% and not < 20 and < 40%, respectively. Generally, a pairwise alignment between sequences of lower identity under the twilight zone is a more difficult problem [7].
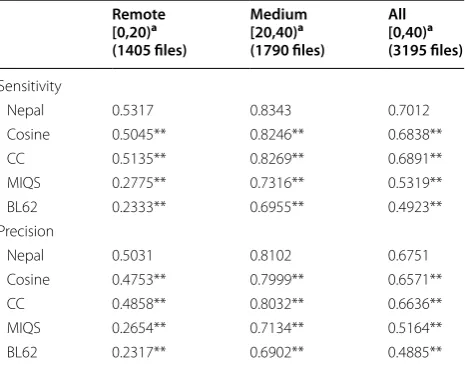
Table 2 shows the alignment-quality scores for each method. Results showed that among the existing meth-ods, including sequence-comparison methmeth-ods, the pro-file-comparison method, which implemented correlation coefficient as a scoring function, performed the best. By contrast, Nepal improved both alignment sensitivity and precision relative to the profile-comparison method. We evaluated the statistical significance between all pairwise combinations of methods individually based on alignment sensitivity or precision on every dataset subset using a Wilcoxon signed rank test with Bonfer-roni correction. The results indicated that the improved results derived from Nepal were statistically significant (α < 0.01), suggesting that the novel derivative-free neural network succeeded in optimizing the scoring function.
Table 2 Comparison of Nepal with other alignment meth-ods
Cosine, CC, MIQS, and BL62, indicate profile comparison methods with cosine similarity and correlation coefficient and sequence comparison methods with MIQS and BLOSUM62
** P < 0.01, Wilcoxon signed rank test with Bonferroni correction
a Sequence identity (%) of each division Remote [0,20)a
(1405 files)
Medium [20,40)a
(1790 files)
All [0,40)a
(3195 files)
Sensitivity
Nepal 0.5317 0.8343 0.7012
Cosine 0.5045** 0.8246** 0.6838**
CC 0.5135** 0.8269** 0.6891**
MIQS 0.2775** 0.7316** 0.5319**
BL62 0.2333** 0.6955** 0.4923**
Precision
Nepal 0.5031 0.8102 0.6751
Cosine 0.4753** 0.7999** 0.6571**
CC 0.4858** 0.8032** 0.6636**
MIQS 0.2654** 0.7134** 0.5164**
Comparison between sequence-based methods with dif-ferent substitution matrices, such as MIQS and BLO-SUM62, showed that the improvement derived from using MIQS as compared with BLOSUM62 was more significant for the remote subset than the medium sub-set. This result was reasonable, because MIQS was origi-nally developed to improve remote homology alignment. This trend was also observed in the relationship between Nepal and the profile aligners using correlation coeffi-cient. Here, Nepal improved both alignment sensitivity and precision by ~ 4 and ~ 1% in the remote and medium subsets, respectively. This indicated that the novel scor-ing function was optimized for remote sequence align-ment rather than alignalign-ment of closer sequences. This was expected, because alignment of sequences with closer identities is easier than those with remote identities. Therefore, during optimization, the novel scoring func-tion would be naturally optimized for remote sequence alignment. These results suggested that the learning sys-tem described in this study represented a scoring func-tion useful for remote sequence alignment. Remote homology detection is the most important problem for sequence-similarity searches [32, 33]. The novel scoring function presented in the present study could be use-ful for improving the performance of existing similarity search methods.
Importance of attributes according to the connection‑weight method
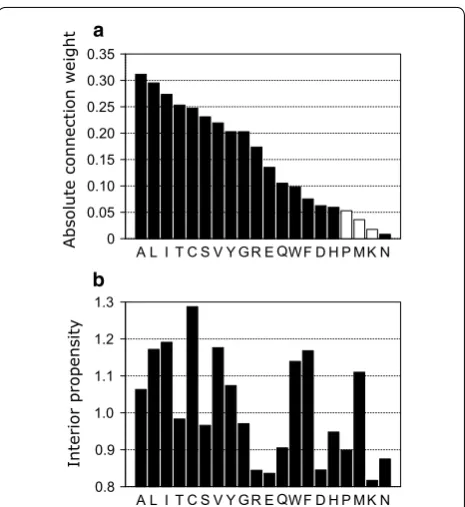
We calculated the importance of 20 attributes of input vectors using the connection-weight method [34], where absolute connection values represent the importance of each amino acid for profile alignment. As shown in Fig. 2a, the connection weights against each attrib-ute (each amino acid) were distribattrib-uted to various val-ues, indicating that the scoring function described here adequately distinguished the importance of an attrib-ute against other attribattrib-utes, depending on the variety of amino acids.
Based on these results, the connection weights of hydrophobic residues, such as Leu, Ile, and Val, were of higher value. These residues are located mostly inside the hydrophobic cores of proteins. Additionally, as shown in Fig. 2b, other residues, which often buried within proteins, such as Ala, Cys, and Tyr, were also of higher importance. By contrast, residues often located on the protein surface, such as Asp, Pro, Lys, and Asn, were of lower importance. The Spearman’s rank correlation coef-ficient between the connection weight and interior pro-pensity was ~ 0.6 (P < 0.05), meaning that the importance of attributes was related to the propensity of residues to be located on the interior of the protein. While resi-dues located at the protein surface are subject to higher
mutation rates, buried residues are less susceptible to mutation [35], because protein structure can be dis-rupted by mutation of residues buried in the core of the protein, which could potentially result in collapse of the hydrophobic core [36]. The scoring function presented in this study was optimized for the alignment of remote homologous sequences. According to a previous study based on substitution matrices [37], residue hydropho-bicity was the dominant property of remote sequence substitution rather than simple mutability. This fact par-tially explains why residues occupying interior locations are considered more meaningful for remote sequence alignment. Because our scoring function was optimized for remote sequence alignment, it considered these amino acids as important attributes. This characteristic of the scoring function represents a superior attribute of our method relative to existing methods.
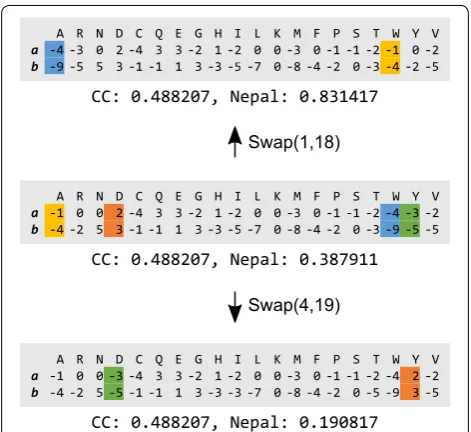
Additionally, although the connection weight con-sisted of various values, it contributed to increases in the expressive power of the novel scoring function. We cal-culated the similarity score between PSSV A (a) and B (b), resulting in 0.488207 and 0.387911 when calculated using the correlation coefficient and Nepal methods, respectively (Fig. 3, middle panel). The scores calculated using the correlation coefficient did not change when the
0.35 0.30 0.25 0.20 0.15 0.10 0.05 0
Absolute connection weight A L I T C S V Y GR E QWF D H P MK N
a
b
1.3
1.2
1.1
1.0
0.9
0.8
Interior propensit
y
1st and 18th sites or the 4th and 19th sites were swapped. These results could be inappropriate, because the con-verted PSSV obtained after swapping was not identical to the original, which could represent a potential draw-back of using unweighted linear functions, such as cosine similarity and correlation coefficient. By contrast, the Nepal scores changed after swapping and varied along with changes in the PSSV. This expressiveness represents a merit of nonlinear functions. There were ~ 290,000 overlaps following the calculation of similarity scores to six decimal places against 1 million randomly generated PSSVs using the correlation coefficient method, whereas there were ~ 180,000 overlaps when Nepal was used. These overlaps would negatively affect DP computation, because higher overlap scores would cause difficulties in determining the correct path, especially during the com-putation of a maximum of three values derived from dif-ferent sides of DP cell. Our results showed that the use of different weights by the connection-weight method and based on amino acid variety is one reason why the Nepal scoring method improved alignment quality as compared with the existing scoring functions.
Conclusions
In this study, we optimized a scoring function for pair-wise-profile alignment using a machine-learning method mimicking a nonlinear function. Our method enabled computational optimization, regardless of whether given
problem involved a derivative-of-cost function, given that this scenario is not always present in real-world problems. In this study, we developed a novel deriva-tive-free neural network with CMA-ES and successfully applied this learning system to optimize a scoring func-tion for pairwise-profile alignment. Nepal significantly improved the alignment quality of profile alignments, especially for alignments based on remote relationships, as compared with existing scoring functions. Moreover, Nepal improved alignment quality based on the adapta-tion to remote sequence alignment and the increasing expressiveness of the similarity score. This method alone is not practical as a standalone pairwise-profile aligner; however, because the novel scoring function involves a simple matrix operation using parameters provided on the website, the performance of distant homology detec-tion or multiple-sequence-alignment methods for remote homologous sequences might be further improved by incorporation of our scoring function. Finally, the goal of the study was not only to provide an alternative align-ment method but also to provide a novel learning system capable of addressing derivative-free problems. Our sys-tem will be useful for optimizing the scoring functions of other sophisticated methods such as similarity search, multiple-sequence alignment and etc.
Abbreviations
CMA-ES: covariance matrix adaptation evolution strategy; DP: dynamic programming; PSSM: position-specific scoring matrix; PSSV: position-specific scoring vector.
Authors’ contributions
The author did everything. The author read and approved the final manuscript.
Author details
1 Graduate School of Information Sciences, Tohoku University, 6-3-09, Aramaki-Aza-Aoba, Aoba-ku, Sendai 980-8579, Japan. 2 Artificial Intelligence Research Center, National Institute of Advanced Industrial Science and Tech-nology (AIST), Tokyo, Japan.
Acknowledgements
We are grateful to Dr. Kentaro Tomii, Dr. Satoshi Omori, and Mr. Tsukasa Naka-mura for constructive discussions. Computations were partially performed on the NIG supercomputer at the ROIS National Institute of Genetics.
Competing interests
The author declares that there is no competing interests.
Availability of data and materials
The source code of the derivative-free neural network, Nepal and the learned parameters are available at GitHub (https://github.com/yamada-kd/nepal).
Ethics approval and consent to participate Not applicable.
Funding
This work was supported in part by the Top Global University Project from the Ministry of Education, Culture, Sports, Science, and Technology of Japan (MEXT) and Platform Project for Supporting in Drug Discovery and Life
A R N D C Q E G H I L K M F P S T W Y V a -1 0 0 2 -4 3 3 -2 1 -2 0 0 -3 0 -1 -1 -2 -4 -3 -2 b -4 -2 5 3 -1 -1 1 3 -3 -5 -7 0 -8 -4 -2 0 -3 -9 -5 -5
CC: 0.488207, Nepal: 0.387911 A R N D C Q E G H I L K M F P S T W Y V a -4 -3 0 2 -4 3 3 -2 1 -2 0 0 -3 0 -1 -1 -2 -1 0 -2 b -9 -5 5 3 -1 -1 1 3 -3 -5 -7 0 -8 -4 -2 0 -3 -4 -2 -5
CC: 0.488207, Nepal: 0.831417
A R N D C Q E G H I L K M F P S T W Y V a -1 0 0 -3 -4 3 3 -2 1 -2 0 0 -3 0 -1 -1 -2 -4 2 -2 b -4 -2 5 -5 -1 -1 1 3 -3 -3 -7 0 -8 -4 -2 0 -5 -9 3 -5
CC: 0.488207, Nepal: 0.190817
Swap(1,18)
Swap(4,19)
• We accept pre-submission inquiries
• Our selector tool helps you to find the most relevant journal
• We provide round the clock customer support
• Convenient online submission
• Thorough peer review
• Inclusion in PubMed and all major indexing services
• Maximum visibility for your research
Submit your manuscript at www.biomedcentral.com/submit
Submit your next manuscript to BioMed Central
and we will help you at every step:
Science Research (Basis for Supporting Innovative Drug Discovery and Life Sci-ence Research (BINDS)) from AMED under Grant Number 17am0101067.
Publisher’s Note
Springer Nature remains neutral with regard to jurisdictional claims in pub-lished maps and institutional affiliations.
Received: 11 August 2017 Accepted: 6 February 2018
References
1. Altschul SF, Madden TL, Schaffer AA, Zhang J, Zhang Z, Miller W, Lipman DJ. Gapped BLAST and PSI-BLAST: a new generation of protein database search programs. Nucleic Acids Res. 1997;25(17):3389–402.
2. Tomii K, Akiyama Y. FORTE: a profile-profile comparison tool for protein fold recognition. Bioinformatics. 2004;20(4):594–5.
3. Wu S, Zhang Y. MUSTER: improving protein sequence profile-profile alignments by using multiple sources of structure information. Proteins. 2008;72(2):547–56.
4. Tomii K, Hirokawa T, Motono C. Protein structure prediction using a variety of profile libraries and 3D verification. Proteins. 2005;61(Suppl 7):114–21.
5. Söding J. Protein homology detection by HMM–HMM comparison. Bioinformatics. 2005;21(7):951–60.
6. Ma J, Wang S, Wang Z, Xu J. MRFalign: protein homology detec-tion through alignment of Markov random fields. PLoS Comput Biol. 2014;10(3):e1003500.
7. Rost B. Twilight zone of protein sequence alignments. Protein Eng. 1999;12(2):85–94.
8. Angermuller C, Biegert A, Soding J. Discriminative modelling of context-specific amino acid substitution probabilities. Bioinformatics. 2012;28(24):3240–7.
9. Biegert A, Soding J. Sequence context-specific profiles for homology searching. Proc Natl Acad Sci USA. 2009;106(10):3770–5.
10. Cybenko G. Approximations by superpositions of sigmoidal functions. Math Control Signal. 1989;2(4):303–14.
11. Sun T, Zhou B, Lai L, Pei J. Sequence-based prediction of protein protein interaction using a deep-learning algorithm. BMC Bioinform. 2017;18(1):277.
12. Du X, Sun S, Hu C, Yao Y, Yan Y, Zhang Y. DeepPPI: boosting prediction of protein–protein interactions with deep neural networks. J Chem Inf Model. 2017;57(6):1499–510.
13. Wang S, Peng J, Ma J, Xu J. Protein secondary structure prediction using deep convolutional neural fields. Sci Rep. 2016;6:18962.
14. Spencer M, Eickholt J, Cheng J. A deep learning network approach to ab initio protein secondary structure prediction. IEEE/ACM Trans Comput Biol Bioinform. 2015;12(1):103–12.
15. Di Lena P, Nagata K, Baldi P. Deep architectures for protein contact map prediction. Bioinformatics. 2012;28(19):2449–57.
16. Heffernan R, Yang Y, Paliwal K, Zhou Y. Capturing non-local interactions by long short term memory bidirectional recurrent neural networks for improving prediction of protein secondary structure, backbone angles, contact numbers, and solvent accessibility. Bioinformatics. 2017;33(18):2842–9.
17. Erb RJ. Introduction to backpropagation neural network computation. Pharm Res. 1993;10(2):165–70.
18. LeCun Y, Bengio Y, Hinton G. Deep learning. Nature. 2015;521(7553):436–44.
19. Hansen M, Ostermeier A. Adapting arbitrary normal mutation distribu-tions in evolution strategies: the covariance matrix adaptation. In: Pro-ceedings of IEEE international conference on evolutionary computation, 20 May 1996. IEEE; 1996. p. 312–7.
20. Beyer H. Toward a theory of evolution strategies: some asymptotical results from the (1,(+) lambda)-theory. Evolut Comput. 1993;1(2):165–88. 21. Nelder JA, Mead R. A simplex-method for function minimization. Comput
J. 1965;7(4):308–13.
22. Andreeva A, Howorth D, Chandonia JM, Brenner SE, Hubbard TJ, Chothia C, Murzin AG. Data growth and its impact on the SCOP database: new developments. Nucleic Acids Res. 2008;36(Database issue):D419–25. 23. Chandonia JM, Hon G, Walker NS, Lo Conte L, Koehl P, Levitt M, Brenner
SE. The ASTRAL compendium in 2004. Nucleic Acids Res. 2004;32(Data-base issue):D189–92.
24. Boratyn GM, Schaffer AA, Agarwala R, Altschul SF, Lipman DJ, Madden TL. Domain enhanced lookup time accelerated BLAST. Biol Direct. 2012;7:12. 25. Zhang Y, Skolnick J. TM-align: a protein structure alignment algorithm
based on the TM-score. Nucleic Acids Res. 2005;33(7):2302–9.
26. Hahnloser RH, Sarpeshkar R, Mahowald MA, Douglas RJ, Seung HS. Digital selection and analogue amplification coexist in a cortex-inspired silicon circuit. Nature. 2000;405(6789):947–51.
27. Gotoh O. An improved algorithm for matching biological sequences. J Mol Biol. 1982;162(3):705–8.
28. Needleman SB, Wunsch CD. A general method applicable to the search for similarities in the amino acid sequence of two proteins. J Mol Biol. 1970;48(3):443–53.
29. Winn MD, Ballard CC, Cowtan KD, Dodson EJ, Emsley P, Evans PR, Keegan RM, Krissinel EB, Leslie AG, McCoy A, et al. Overview of the CCP4 suite and current developments. Acta Crystallogr D Biol Crystallogr. 2011;67(Pt 4):235–42.
30. Levy ED. A simple definition of structural regions in proteins and its use in analyzing interface evolution. J Mol Biol. 2010;403(4):660–70.
31. Henikoff S, Henikoff JG. Amino acid substitution matrices from protein blocks. Proc Natl Acad Sci USA. 1992;89(22):10915–9.
32. Yamada K, Tomii K. Revisiting amino acid substitution matrices for identi-fying distantly related proteins. Bioinformatics. 2014;30(3):317–25. 33. Fariselli P, Rossi I, Capriotti E, Casadio R. The WWWH of remote homolog
detection: the state of the art. Brief Bioinform. 2007;8(2):78–87. 34. Olden JD, Joy MK, Death RG. An accurate comparison of methods for
quantifying variable importance in artificial neural networks using simu-lated data. Ecol Model. 2004;178(3–4):389–97.
35. Zhang J, Yang JR. Determinants of the rate of protein sequence evolution. Nat Rev Genet. 2015;16(7):409–20.
36. Chakravarty S, Varadarajan R. Residue depth: a novel parameter for the analysis of protein structure and stability. Struct Fold Des. 1999;7(7):723–32.