R E S E A R C H
Open Access
A simple data-adaptive probabilistic variant
calling model
Steve Hoffmann
1,2,3*, Peter F Stadler
2,3,4,5,6,7,8and Korbinian Strimmer
9,10Abstract
Background: Several sources of noise obfuscate the identification of single nucleotide variation (SNV) in next generation sequencing data. For instance, errors may be introduced during library construction and sequencing steps. In addition, the reference genome and the algorithms used for the alignment of the reads are further critical factors determining the efficacy of variant calling methods. It is crucial to account for these factors in individual sequencing experiments.
Results: We introduce a simple data-adaptive model for variant calling. This model automatically adjusts to specific factors such as alignment errors. To achieve this, several characteristics are sampled from sites with low mismatch rates, and these are used to estimate empirical log-likelihoods. The likelihoods are then combined to a score that typically gives rise to a mixture distribution. From this we determine a decision threshold to separate potentially variant sites from the noisy background.
Conclusions: In simulations we show that our simple model is competitive with frequently used much more complex SNV calling algorithms in terms of sensitivity and specificity. It performs specifically well in cases with low allele frequencies. The application to next-generation sequencing data reveals stark differences of the score distributions indicating a strong influence of data specific sources of noise. The proposed model is specifically designed to adjust to these differences.
Background
Recent studies report a strikingly low concordance of cur-rently available methods and pipelines for identification of single nucleotide variation (SNV), both somatic and germline, indicating that computational methods as well as sequencing protocols have a major impact on the sen-sitivity and specificity of the variation calling tool [1]. Specifically, the allelic fraction as well as the coverage of the variant allele are crucial determinants for the statisti-cal benchmarks [2,3]. Practistatisti-cal guidelines of SNV statisti-callers such as GATK [4] or SAMtools [5] suggest to apply rig-orous postprocessing filters to reduce the number of false positive calls. Other studies indicate that the applica-tion of these filters lead to a substantial improvement of the concordance of the callers [6]. Nevertheless, applying
*Correspondence: [email protected]
1Junior Research Group Transcriptome Bioinformatics, University Leipzig, Härtelstraße 16-18, Leipzig, Germany
2Interdisciplinary Center for Bioinformatics and Bioinformatics Group, University Leipzig, Härtelstraße 16-18, Leipzig, Germany
Full list of author information is available at the end of the article
stringent thresholds for variables such as the strand bias, the coverage or read start variation bears the risk of losing important information [7]. These authors emphasize that the different algorithmic and statistical components of a variant caller have to be evaluated as a whole and cannot not be meaningfully judged as single components.
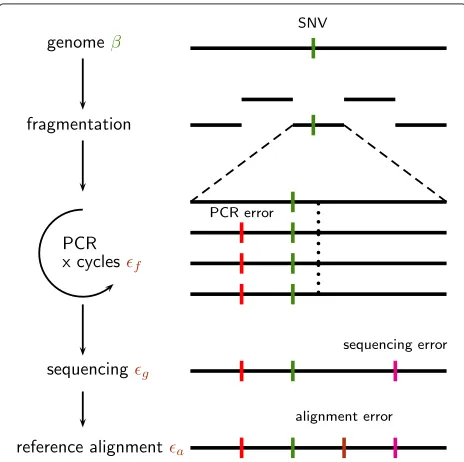
If DNA library preparation protocols and sequencing machines were able to produce error-free and unbiased sequences of sufficient length the task of variant calling would be easy. Due to various error sources and tech-nical limitations of library preparation, sequencing, and alignment, however, a substantial level of noise compli-cates the analysis. Since these factors can not be totally controlled during the experiment it seems reasonable to adjust the thresholds for calling a variant depending on the separability of noise and signal, i.e. the true variants. During amplification incorrect nucleotides are incorpo-rated with some error ratef and during the sequencing step incorrect nucleotides are called with the rateg. After the alignment of the reads to a reference sequence we may observe these errors as mismatches or indels. Additional
mismatches and indels are caused by these reference and alignment errors (a). The mismatch rate of a genomic site can be assumed to be the sumδ =+β, whereβ repre-sents the biological variation andis the compound effect of the technical errorsf,g, anda. Figure 1 summarizes this situation.
The two most commonly used tools for SNV call-ing methods, SAMtools and GATK, employ probabilistic models for variant calling. Specifically, the algorithm used by SAMtools [8] is based on the likelihood of a genotype which is computed as
L(g)= 1 mk
l
j=1
(m−g)ζj+g(1−ζj)
k
j=l+1
(m−g)(1−ζj)+gζj
,
(1)
where g denotes the number of reference alleles,m the ploidy, k the number of reads seen at a site, andζ the error probability delivered by the sequencer. Eq. 1 assumes that the first l bases are identical to the reference, the subsequent bases are not. Subsequently, from this a like-lihood for the allele count L(c) is obtained. Using the
Figure 1Accumulation and sources of errors in next generation sequencing reads.The identification of single nucleotide variations (green dashes) is complicated by various sources of error. PCR errors accumulate during the amplification and sequencing step. After fragmentation single fragments undergo several amplification cycles. Errors are introduced with a rateδf(red dashes). Further errors are accumulated during sequencing (δg). During the alignment to the reference further mismatches and indels are introduced (δa).
observed allele frequency spectrumφcas prior informa-tion a posterior probability
Pr{c} = φcL(c) cφcL(c)
(2)
is computed, and a variant is called if Pr{c>1}exceeds a certain specified threshold.
The GATK pipeline uses a related probabilistic model for calling variants [9]. Similar to SAMtools, the probabil-ity Pr{Dj|A}of observing the baseDjunder the hypothesis thatAis the true base is calculated by
Pr{Dj|A} =
1−ζj Dj=A
ζj Pr{A is true|Djis miscalled} otherwise, (3)
where Pr{A is true|Djis miscalled} is a precomputed, sequencer specific lookup table. Using prior information based on precomputed heterozygosity estimations GATK evaluates the posterior probabilities of a site to be vari-ant. As with SAMtools calls are determined using fixed preselected thresholds.
Here, we propose a simple probabilistic model for vari-ant calling using a data adaptive threshold on the scale of log-odd-ratios computed from empirical distributions of certain site characteristics. Our approach allows to opti-mally separate simulated SNVs from the noisy background without specification of a threshold for posterior proba-bilities. In brief, our model starts out by evaluating the mismatch frequencies δ in a data set. Subsequently, we sample several characteristics of the sites with smallδ to serve as empirical reference model. The fundamental idea used here is that the vast majority of sites is invariant and thus allows to capture the features of the data specific error model. These characteristics are then used to form empirical log-likelihoods that are combined to a log-odds type score. Typically, we observe a mixture distribution of two score populations, which we may then separate by a decision threshold.
Next, we discuss the details of our approach and the proposed data-adaptive variant calling algorithm. Subse-quently, we apply our method to both synthetic and next generation sequencing data from various species. A refer-ence implementation in C99 of our method calledhaarz is available at http://www.bioinf.uni-leipzig.de/software.html.
Methods
Notation
set. We use the indexj∈[1,. . .,|Ci|] to refer to a specific read. The length of readjaligned to siteiis denoted by mij, and the position of a nucleotide in a read is denoted
bykij
1,. . .,mij
. For simplicity, we occasionally leave out the indexiwhen there is no danger of ambiguity.
The nucleotide in a cross section can be partitioned into sets of match (M) and mismatch (M) nucleotides so that Ci = Mi ∪Mi. The variant calling algorithm described below uses the partition {Mi,Mi} at each position i to compute an overall score for this particular site.
Biological versus technical variation
Themismatch rateδi = |Mi|/|Ci|is the observed num-ber of mismatches divided by the coverage. The mismatch rateδi = βi+imay be decomposed into biological and technical variation, wherei denotes the technical error that accumulated during the preparation, sequencing and alignment steps andβi denotes the biological nucleotide variation at sitei.
We aim to distinguish biologically variant positions (βi > 0) from non-variant positions (βi = 0), based on the observed mismatch ratesδi and site characteris-tic scores derived from sequence data or produced during sequencing.
We assume that cross sections with high mismatch rates are indicative of biological variation in the sample, whereas in cross sections with small mismatch rate the mismatches are more likely due to technical errors. Con-versely, in the overwhelming majority of cross sections Ci we may assume that there is no biological variation present, i.e.βi =0, and thus mismatches are only caused by technical errors.
For use in the variant calling score we estimate for each
δi the corresponding empirical quantileq(δi). The moti-vation for using the quantile rather than the actual value is that it implements a simple normalization of the error. The empirical quantile q(δi) is estimated by tabulating the cumulative frequencies ofδi across the genome and then reading off the quantile from the resulting empirical distribution function (ECDF).
To ascertain the probabilities of certain site character-istics, discussed further below, we uniformly sample from sites with 0 < δi < 0.5. Informally, these characteris-tics then reflect “background distributions” of non-variant sites and thus are estimated from sites with less than 50% of mismatches.
The degree of biological variation depends on the type of genome. For heterozygous genomes one expects to find predominantly SNP alleles with βi = 0.5 or βi = 1.0, whereas cancer tissues may show mutations with 0 <
βi ≤ 1 depending on the heterogeneity and cancer cell content of the sample. Similarly, arbitrary values ofβiwill appear in whole population sequencing data. Accordingly,
we expect different values ofβifor mixtures of sequencing data from different individuals. The variant calling algo-rithm introduced in the following makes no assumptions concerning the presence of diploid genomes, knowledge about the ploidy, homo- or heterozygosity.
Site characteristics
In addition to the partitioning of nucleotides at a given site into match and mismatch sets, our algorithm uses the following information, which is typically reported by the sequencer or the read mapper for every siteiand readj:
• the nucleotide qualities (Q), • relative read position (P), • errors in the alignment (R), and • the number of multiple hits (H).
The nucleotide qualities take on values between 0 and 1 and are given as Q = 1− ζ, i.e., as probability of a base being correct, with values close to 1 corresponding to optimally accurate sequencing. We directly use Q in computing the variant calling score.
The relative read position is given byP = kji/mij. For the construction of our variant calling score we employ the probability Pr(M|P) of a match at a given read posi-tion, along with the maximumPM = maxPPr(M|P). The probability of a mismatch is then given by Pr(M|P) = 1 − Pr(M|P), and its maximum PM = maxPPr(M|P). We estimate the probability Pr(M|P) empirically, i.e., by appropriately counting matches and mismatches over all sites and reads.
The number of errors in the alignment is an integer value greater or equal to zero, and denoted here by R. Finally, the number of multiple hitsHdescribes the num-ber of alignments for each read. The multiplicity of an alignment yields information on the repetitiveness of a genomic region. As above for the relative read position, we tabulate the occurrence of matches for each value of Rand andHand correspondingly obtain estimates of the probabilities Pr(M|R)and Pr(M|H).
Scores for distinguishing variant and non-variant sites
We introduce four log-odds ratios to formalize and sum-marize the evidence for a variant over a non-variant based on the above four site characteristics.
Q= 1
|C| x∈M
log Qx 1−Qx
for base qualities,
P = 1
|C| x∈M
log Pr(M|Px) 1−Pr(M|Px) +
logPM PM
for read positions, which are rescaled by their respective maximally attained valuesPMandPM,
R= 1
|C| x∈M
log Pr(M|Rx) 1−Pr(M|Rx)
for read errors, and
H = 1
|C| x∈M
log Pr(M|Hx) 1−Pr(M|Hx)
for multiple matches. Note that only reads with mismatch-ing bases in a cross-section are used for estimation, i.e. match bases are ignored. If there are only match bases in a cross-section , i.e. if|M| =0 then the cross-sectionis not considered in any component of our model.
Variant calling with adaptive threshold
From these log-odds ratios we now construct a total score for variant calling by computing, at any positioni,
Si=Pi+Qi+Ri+Hi+logq(δ i).
This score comprises the four summaries of the site characteristics, as well as the log-quantile of the observed mismatch rateδi, i.e. the observed number of changes at position normalized by coverage. A low quantile for δi thus strongly penalizes the overall score.
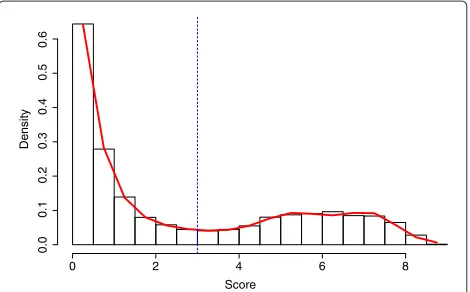
For variant calling we now proceed as follows. We assume that the majority of the sites are non-variant, and only a smaller part is variant, with Si > 0. Thus, the observed distribution of Si will be a mixture distri-bution, consisting of a null distribution corresponding to the invariant sites and an alternative “contamination” component corresponding to the variant sites.
In order to find an optimal adaptive cut-off separat-ing the background from potential variants we estimate the densities by fitting a natural spline using Poisson-regression to the histogram, following the procedure described by [10].
Subsequently, we numerically find the location with the minimum density and use it as threshold for separat-ing the two score populations. Specifically, we fit natural splines to the histogram forSi>0 and numerically deter-mine the local minimum. If there are multiple minima the
leftmost minimum is used. The corresponding threshold is denoted byS∗.
In some cases there is no minimum in the histogram of the empirical scores. In this case we use as fall-back solution the upper 95% quantile as threshold. A missing minimum might indicate that the score model does not suffice to reliably call the variants.
Once the thresholdS∗is established, we declare all sites Si > S∗ to be variant. In Figure 2 this procedure is illustrated using data fromA. thaliana.
We note that by construction of the scoreSiwe assume independence of the site characteristics. However, in prac-tice there will be correlation, and as alternative one may also consider a fully multivariate construction of the score Si. However, this is not without its own drawbacks, as the correlation among site characteristics may be hard to estimate reliably. Moreover, as is well known from classi-fication and “naive Bayes” analysis, independence models are typically rather robust and often even outperform more complex parameter-rich multivariate models.
Results and discussion
Simulation study
To evaluate the reference implementation “haarz” of our adaptive model we compared it with the two frequently used SNV callers GATK [4] and SAMtools [5]. The precise command line settings are summarized in the Appendix.
We simulated next generation sequencing data for the human chromosome 21 using GemSIM (version 1.6) [11] with the default model and coverages ranging from 10, 20, 30, 50, 100, to 200-fold. The simulated content of the variant allele was either 0.2 or 0.5. Simulated read length was 100. For mapping we used the aligners that are recommended for each method. Specifically, we used BWA [12] to generate the alignments for GATK and SAM-tools. For the reference implementation of our model we
Score
Density
0 2 4 6 8
0.0 0.1 0.2 0.3 0.4 0.5 0.6
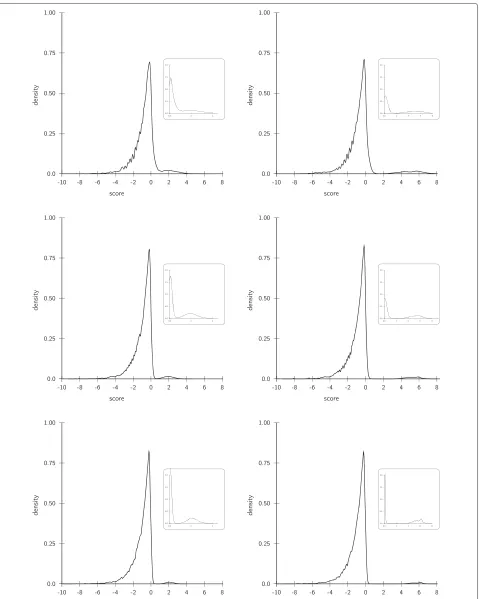
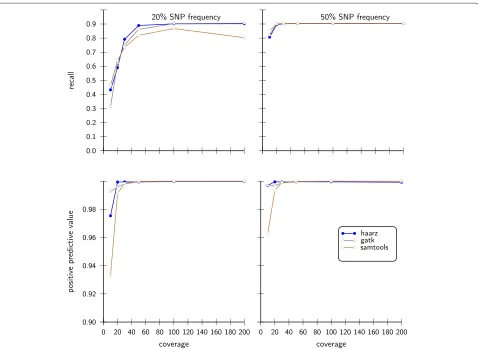
usedsegemehl[13]. After mapping and variant calling we collected for each combination of coverage and vari-ant allele frequencies the number of false positives (FP), true positives (TP), false negatives (FN), and true nega-tives (TN). From this we computed the recall (sensitivity) SENS= TP/(TP+FN)and the positive predictive value PPV = TP/(FP +TP), i.e. the true discovery rate. For the proposed data adaptive model we investigated the score distribution for all 12 experiments (Figure 3). Except for the combination of low coverage (10×) and low vari-ant allele content (20%) we observe the presence of two populations. The separability of these score populations improves with increasing coverage and variant allele con-tent. In each case, the minimum score for variant calls was automatically set to the value where the density of scores > 0 attains its first first local minimum. Subse-quently all positions with a score equal or greater were called as SNV and compared to the other callers.
All of the tested programs show a good recall and pos-itive predictive value in all 12 simulations. For low allele contents in conjunction with low coverages, however, SAMtools attains comparably low positive predictive val-ues. Surprisingly, after reaching a maximum recall for the coverage of 100, the recall drops substantially for coverage 200. For the simulations with 50% allele content, all tools show high recalls and good positive predictive values. Again, SAMtools achieves only a comparably low posi-tive predicposi-tive value for poorly covered SNVs (Figure 4). Except for the lowest coverage, all tools performed well on these data sets.
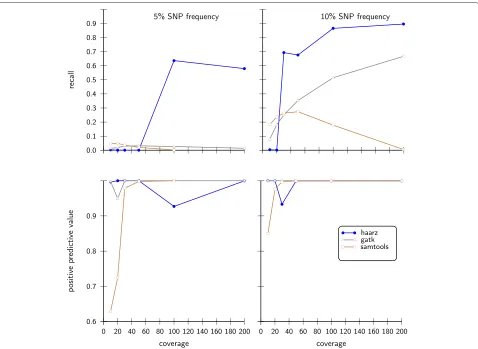
In Figure 5 we show results for the challenging case of small minor allele frequencies of 5% and 10%. Our approach compares well in these rather difficult cases, in contrast to SAMtools and GATK. For the low coverages, our algorithm does not find a clear cutoff and thus resorts to the 95% criteria. Since there are very few sites with high
Figure 5Statistical performance measures on simulated data sets with small variant allele frequency.As in Figure 4 we compare our approach with SAMtools and GATK with 10% and 5% of minor allele frequencies.
scores, i.e.S>0, the recall is low and the positive predic-tive value is high. As soon as higher coverages are reached and a minimum is found, the recall is increases substan-tially. We note that for low SNP frequencies in conjunction with low coverages the sample sizes for sampling site char-acteristics (default sample size: 100000; see Appendix) need to be increased to calculate the distribution of scores S>0.
Application to data sets
The good overlap between the different methods in our simulation study as well as the small number of false positives is in stark contrast to the experience of greatly differing variant calls in real life data (e.g. [1]). We there-fore applied our model to diverse real data from both diploid and haploid organisms.
Paired end next generation sequencing data for
Arabidopsis thaliana (SRR519713), Escherichia coli
(ERR163894) andDrosophila melanogaster(SRR1177123) was downloaded under the respective accession numbers from the Short Read Archive (www.ncbi.nlm.nih.gov/sra).
TheArabidopsisdata was aligned to the reference genome version 10.5. With the data set SRR519713 we obtained a coverage of∼30-fold. TheE. colidata set was aligned to the reference genomeE. coli k12assembly v1.16. With ERR163894 we obtained a coverage of∼60-fold. Finally, SRR1177123 was aligned to theD. melanogasterreference version dm3. The coverage was∼25-fold. For the align-ments, calling and filtering we used standard parameters. Precise settings are given in the Appendix.
The score distributions are shown in first line of Figure 6. In the case of the plant A. thaliana and the procaryoteE. coli, a clear separation of two populations is observable. On the other hand, the separation of the score populations inD. melanogasterdata set is less pro-nounced.
Figure 6Score distributions and congruence of variant calls in next generation sequencing data.While a clear separation of score populations is observable for the diploidA. thalianaand the haploidE. coli, only a shallow minimum can be observed in case ofD. melanogaster. Hence, in the latter case our model automatically adjusts to the data such that the calling appears to be more conservative: less than 4 percent of the calls are not supported by any caller and 92% of its calls are supported both by GATK and SAMtools. On the other hand, our model calls more variants in the other two cases.
and reports fewer variants. Most of these, however, are also found by SAMtools and GATK. About 92% percent of the calls from our model are also supported by both of the other callers and only 4% are not supported by any of the two alternative approaches. From the score distributions forD. melanogasterit is clear that there is a large overlap of the two score populations and hence the choice ofS∗ necessarily depends on the desired specificity and/or sen-sitivity. In the simulated data (Figure 4 and Figure 5) we see that haarzgenerally achieve a high recall (sensitiv-ity), and at the same time offers a high positive predictive value, (PPV) i.e. low false discovery rate. Thus, for theD. melanogaster data many sites may be ambiguous to call, and our tool will err on the conservative side to maintain a high PPV.
Conclusions
most commonly used probabilistic models for SNV calling methods in terms of both sensitivity and specificity.
When applying our model to actual next-generation sequencing data, we observe that the distributions of the scores vary significantly among the different data sets. As expected, the clearest separation of the mixture was obtained for the haploidE. colidata set. In addition, the small size of the genome and the absence of repetitive ele-ments probably improves the separability of the scores. The situation for the two diploid genomesA. thalianaand D. melanogaster is different. While both genomes have comparable sizes, the separability of the score distribu-tions varies strongly among these two data sets. While a clear minimum can be found for the plant, the mixture in D. melanogaster appears to be more complicated. In this case, by construction our model selects a conservative decision threshold. While the number of calls is similar to the other probabilistic SNV callers in the simulations as well as the next-generations data sets of the plant and the bacteria, it is significantly reduced in the fruit fly data set. These differences indicate that the characteristics of next-generation data sets have a strong impact on the suc-cess of variant calling. Furthermore, we observe that, at least for the score proposed here, a significant difference of the separability of the mixture distribution can be found between simulated and real data. Thus, we argue that data adaptive components could help to balance the trade-off between sensitivity and specificity.
Appendix
Read simulation
For the simulation of reads and allele contents we used the program GemSIM (v. 1.6). We simulated reads for the human chromosome 21 (hg19) with different coverages using an Illumina specific error model (ill100v5_s).
python GemReads.py -g simulatedsnps.txt -r chr21.fasta -m ill100v5_s.gzip \ -n <noofreads> -l 100 -q 64 -o
<mysimulatedreads.fq>
Benchmarks and command line parameters
For the benchmarks we have aligned the simulated as well as the real reads with bwa and called the variants with SAMtools and GATK. For our own model the reads were aligned usingsegemehl. The command line parameters and version numbers are given below.
a) BWA v 0.6.2
bwa aln <ref.fa> <reads1.fq> > bwa_PE1.sai bwa aln <ref.fa> <reads2.fq> > bwa_PE2.sai bwa sampe <ref.fa> bwa_PE1 bwa_PE2
<read1.fa> <read2.fa> > my.sam
b) GATK v 2.8.1 (GenomeAnalysisTK-2.8-1-g932cd3a) calling:
java -jar GenomeAnalysisTK.jar -T UnifiedGenotyper -R <ref.fa> \ -I <sorted.bam> -o <calls.vcf>
filtering:
java -jar GenomeAnalysisTK.jar -T VariantFiltration -R <ref.fa> -V <calls.vcf> \
--filterExpression "QD < 2.0 || FS > 60.0 || MQ < 40.0 || HaplotypeScore > 13.0 || \
MQRankSum < -12.5 || ReadPosRankSum < -8.0" --filterName "filter"
-o <calls.filtered.vcf>
c) SAMtools v 0.1.19 calling:
samtools mpileup -uf <ref.fa> <sorted.bam> | bcftools view -bvcg - > <var.raw.bcf> bcftools view var.raw.bcf > <calls.vcf>
filtering:
varFilter -D100 > <calls.filter.vcf>
d) segemehl v 0.1.7
segemehl.x -d <ref.fa> -i <ref.idx> -q SRR519713.fastq -D 0 > mysam.sam
obtaining site characteristics (written to sorted.haarz.idx):
haarz.x -d <ref.fa> -q <sorted.sam.gz> -x <sorted.haarz.idx> -H -Q -M 2000
obtaining site characteristics for low variant allel frequen-cies:
haarz.x -d <ref.fa> -q <sorted.sam.gz> -x <sorted.haarz.idx> -U 0 -X 0 -H -Q -M 2000
calling:
haarz.x -d <ref.fa> -q <sorted.sam.gz> -i <sorted.haarz.idx> -M 2000 -F 0.01 -Q -c > haarz.vcf
Competing interests
The authors declare that they have no competing interests.
Authors’ contributions
Acknowledgements
This research was supported by LIFE (Leipzig Research Center for Civilization Diseases), Leipzig University and theDeutsche Forschungsgemeinschaftunder the auspicies of SPP 1590 “Probabilistic Structures in Evolution”, proj. no. STA 850/14-1. LIFE is funded by the European Union, by the European Regional Development Fund (ERDF), the European Social Fund (ESF) and by the Free State of Saxony within the excellence initiative. We thank the referees for their very helpful comments.
Author details
1Junior Research Group Transcriptome Bioinformatics, University Leipzig,
Härtelstraße 16-18, Leipzig, Germany.2Interdisciplinary Center for
Bioinformatics and Bioinformatics Group, University Leipzig, Härtelstraße 16-18, Leipzig, Germany.3LIFE Research Center for Civilization Diseases,
University Leipzig, Härtelstraße 16-18, Leipzig, Germany.4Department of
Theoretical Chemistry, University Vienna, Währinger Straße 17, Vienna, Austria.
5RNomics Group, Fraunhofer Institute for Cell Therapy and Immunology – IZI,
Perlickstraße 1, Leipzig, Germany.6Max-Planck-Institute for Mathematics in the
Sciences, Inselstraße 22, Leipzig, Germany.7Center for non-coding RNA in
Technology and Health, University of Copenhagen, Grønnegårdsvej 3, Frederiksberg, Denmark.8Santa Fe Institute, 1399 Hyde Park Road, Santa Fe,
USA.9Institute for Medical Informatics, Statistics and Epidemiology, University
of Leipzig, Härtelstraße 16–18, D-04107 Leipzig, Germany.10Department of
Epidemiology and Biostatistics, Imperial College London, Norfolk Place, London W2 1PG, UK.
Received: 21 May 2014 Accepted: 11 January 2015
References
1. O’Rawe J, Jiang T, Sun G, Wu Y, Wang W, Hu J, et al. Low concordance of multiple variant-calling pipelines: practical implications for exome and genome sequencing. Genome Med. 2013;5(3):28.
2. Xu H, DiCarlo J, Satya R, Peng Q, Wang Y. Comparison of somatic mutation calling methods in amplicon and whole exome sequence data. BMC Genomics. 2014;15:244.
3. Yu X, Sun S. Comparing a few SNP calling algorithms using low-coverage sequencing data. BMC Bioinformatics. 2013;14:274.
4. McKenna A, Hanna M, Banks E, Sivachenko A, Cibulskis K, Kernytsky A, et al. The Genome Analysis Toolkit: A MapReduce framework for analyzing next-generation DNA sequencing data. Genome Res. 2010;20:1297–303. 5. Li H, Handsaker B, Wysoker A, Fennell T, Ruan J, Horner N, et al. The
Sequence Alignment/Map format and SAMtools. Bioinformatics. 2009;25: 2078–9.
6. Liu X, Han S, Wang Z, Gelernter J, Yang BZ. Variant Callers for Next-Generation Sequencing Data: A Comparison Study. PLoS ONE. 2013;8(9):e75619+.
7. Pabinger S, Dander A, Fischer M, Snajder R, Sperk M, Efremova M, et al. A survey of tools for variant analysis of next-generation genome sequencing data. Brief Bioinformatics. 2014;15:256–78. 8. Li H. A statistical framework for SNP calling, mutation discovery,
association mapping and population genetical parameter estimation from sequencing data. Bioinformatics. 2011;27(21):2987–93.
9. DePristo MA, Banks E, Poplin R, Garimella KV, Maguire JR, Hartl C, et al. A framework for variation discovery and genotyping using next-generation DNA sequencing data. Nat Genet. 2011;43(5):491–8.
10. Efron B, Tibshirani R. Using specially designed exponential families for density estimation. Ann Stat. 1996;24:2431–61.
11. McElroy KE, Luciani F, Thomas T. GemSIM: general, error-model based simulator of next-generation sequencing data. BMC Genomics. 2012;13:74.
12. Li H, Durbin R. Fast and accurate short read alignment with Burrows-Wheeler transform. Bioinformatics. 2009;25:1754–60. 13. Hoffmann S, Otto C, Kurtz S, Sharma CM, Khaitovich P, Vogel J, et al.
Fast mapping of short sequences with mismatches, insertions and deletions using index structures. PLOS Comp Biol. 2009;5:e1000502.
Submit your next manuscript to BioMed Central and take full advantage of:
• Convenient online submission
• Thorough peer review
• No space constraints or color figure charges
• Immediate publication on acceptance
• Inclusion in PubMed, CAS, Scopus and Google Scholar
• Research which is freely available for redistribution