ISSN (e): 2250-3021, ISSN (p): 2278-8719
Vol. 09, Issue 1 (January. 2019), ||V (III) || PP 32-39
Performance Analysis Based on Axis Tracking of PV System
Deepak Dahiya
1, Rakeshwri Agrawal
2,
Deepak Agrawal
31Research scholar, Department of Electrical and Electronics Engineering, Trinity Institute of Technology &
Research, Bhopal, India
23
Associate Professor at department of Electrical and Electronics Engineering, Trinity Institute of Technology & Research, Bhopal, India
Corresponding Author:Deepak Dahiya
Abstract:
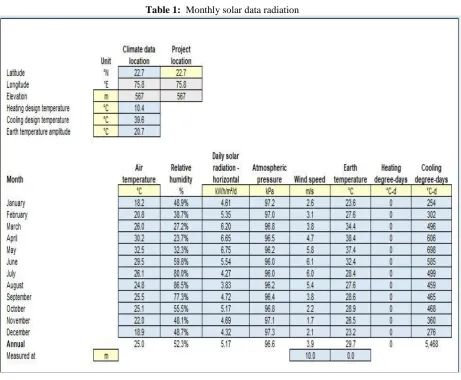
A solar resource assessment done to know the amount of solar radiation available at Indore showed that Indore receives about 5.17kWh/m2/day. The financial analysis carried out using RETScreen through three different tracker axis mode as fixed axis, one axis and dual axis tracker revealed that at a grid connected solar PV dual axis tracker mode has 35% more output power from solar irradiation as compare to fixed axis system.Results of the analysis indicate that, the project when implemented will supply about 35% as compare to fixed axis tracker PV system. The project also stands the chance of saving about 606 tonnes of CO2 which would have been emitted by a crude oil-fired thermal power plant generating the same amount of electricity.Keywords: photovoltaic cell, inverter, Grid system
--- Date of Submission: 07-01-2019 Date of acceptance: 22-01-2019
---I.
Introduction
Grid-connected solar PV systems, though the fastest growing renewable energy technology in the world, have not been fully exploited in India; one of the reasons being the very high initial investment [1]. Prices of solar PV systems have however been on a decline for the past few years due to technological innovations which have led to improvements in cell efficiencies and the economies of scale resulting from increase in production. The main purpose of this paper is to present a technical and economic analysis of grid-connected solar photovoltaic power system for the Indore, Madhya Pradesh, India.
With the prevailing tariff conditions in the country, this project can be considered is not financially viable except with grants and capital subsidies. However, the other non-financial benefits like the greenhouse gas emissions savings can in the long run help mitigate the adverse effects of the climate change problem plaguing the entire earth. Indore currently doesn’t have a feed-in tariff policy making it difficult for renewable energy projects to be implemented. However, there is a Renewable Energy Bill currently in parliament waiting to be passed into a law.
II.
GRID-CONNECTED PV SYSTEM COMPONENTS
The design of grid-connected PV system, necessary components is PV cell, Inverter, load profile. This PV system configuration output power fulfills the required load demand of the design location [10-11].
A. PV System
The design location selected as Indore MP for PV system. This location has great potential of solar radiation.
B. INVERTER
The charged of the inverter trust on the request it is usage for, the nature (waveform) of its output, its output capacity, and other integrated functions such as battery charging or gen set automatic starting. The inverters specification as Efficiency is 98%, Capacity is 15kW, and Miscellaneous losses is 0%. on-grid PV systems, the cost of inverters is in the $750/kW AC to $1,500/kW AC range, where bigger units are on the lower end of this range and smaller units on the higher end. A high-volume purchase of small units may bring the cost in the middle range. Note that some PV module manufacturers are offering "AC PV modules" for grid intertie systems. These modules have a short shape-in inverter. In this action, the user will not conclude an inverter cost here [5], [12].
C. LOAD
Fig.1. The load profile of design location
D. ENERGY MODEL
As part of the RETScreen Clean Energy Project Analysis Software, the Energy Model worksheet is used to evaluate the proposed case system. In this sheet the detail information of PV system components which are used for design a Grid connected system.
III.
RESULTS AND DISCUSSION
The user selects the type of sun tracking device upon which the solar collector is mounted. The options from the drop-down list are: "Fixed," "One-axis," "Two-axis" and "Azimuth." If the solar collector is mounted on a fixed structure the user may select "Fixed." The remaining choices may be selected if the solar collector is mounted on a tracker. A tracker is a device supporting the solar collector which moves the collector in a prescribed way to minimise the angle of incidence of beam radiation on the collector's surface [6]. Hence incident beam radiation (i.e. solar energy collected) is maximized. Solar trackers may be classified as follows:
One-axis trackers track the sun by rotating around an axis located in the plane of the collector. The axis can have any orientation but is usually horizontal east-west, horizontal north-south, or parallel to the earth's axis;
Azimuth trackers have a fixed slope and rotate about a vertical axis; and
Two-axis trackers always position their surface normal to the beams of the sun by rotating about two axes.
In this proposed case three different type of tracker as One-axis trackers, one-axis trackers and Two-axis trackers is used for obtaining maximum power output from solar PV system.
Fig. 2. Type of solar tracker [6]
A. Cumulative cash flow
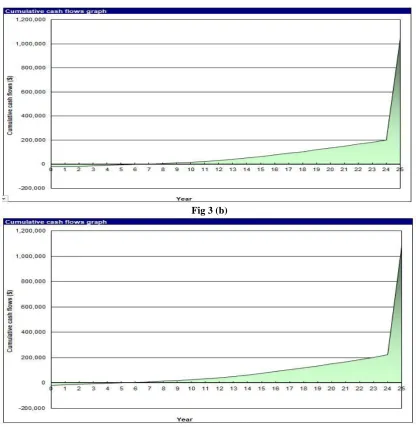
The model calculates the cumulative cash flows, which represent the net pre-tax flows accumulated from year 0. The net pre-tax cash flows are the yearly net flows of cash for the project before income tax. It represents the estimated sum of cash that will be paid or received each year during the entire life of the project. Note that the equity is assumed to occur at the end of year 0 and that year 1 is the first year of operation of the project. Annual costs, savings and income, which reflect amounts valid for year 0, are thus escalated one year in order to determine the actual costs and savings and income incurred during the first year of operation (i.e. year 1). The yearly cash flow and cumulative cash flow of fixed, one axis and two axis is shown in fig. 3 (a), (b), (c) and table .2.
Fig 3 (b)
Fig 3. (c)
Fig 3. (a), (b), (c) cumulative cash flow of fixed, one axis and two axis
B. Yearly Cash Flow
The model calculates the pre-tax internal rate of return (IRR) on assets (%), which represents the true interest yield provided by the project assets over its life before income tax. It is calculated using the pre-tax yearly cash flows and the project life. It is also referred to as the return on assets (ROA). Table 2. show the Yearly Cash Flow of all three-tracking system.
It is calculated by finding the discount rate that causes the net present value of the assets to be equal to zero. Hence, it is not necessary to establish the discount rate of an organisation to use this indicator. An organisation interested in a project can compare the internal rate of return to its required rate of return (often, the cost of capital). The IRR is calculated on a nominal basis, that is including inflation. Table show the camparative yearly cash flow, according to table dual axis tracker system gvies maximum 1080031$ cash flow.
Table 2:
comparative yearly cash flows of all axis
C. Electricity Exported
The model calculates the annual electricity export income. This value is calculated by multiplying the electricity exported to grid by the electricity export rate. The annual value of the electricity export income is escalated at the electricity export escalation rate. All tracker PV system electricity export income is shown in table 3.
D. Total annual savings and income
Total annual savings and income is combination of Electricity export income and Fuel cost - base case. Both are define as:
Electricity export income: The model calculates the electricity export income. This value is calculated by multiplying the electricity exported to grid by the electricity export rate. The annual value of the electricity export income is escalated at the electricity export escalation rate.
Fuel cost - base case: The model calculates the total fuel cost for the base case. The annual value of fuel cost for the base case is escalated at the fuel cost escalation rate. Table 3 shows the comparative analysis of all tracker modes.
E. GHG reduction credit duration
The user enters the GHG reduction credit duration (year). This value typically represents the number of years for which the project receives GHG reduction credits. It is used to determine the GHG reduction income over the project life. For Clean Development Mechanism (CDM) projects, two options are currently available for the length of the crediting period (i) a fixed crediting period of 10 years or (ii) a renewable crediting period of 7 years that can be renewed twice (for a maximum credit duration of 21 years). If a crediting period of 10 years is selected, once the project has been validated and registered, Certified Emission Reductions (CERs) can be certified and issued for the 10 years of the project without revisiting the baseline. However, in the case of a renewable 7-year crediting period, the project will have to be validated after each 7-year period in order to receive CERs for the subsequent 7 years.
Thus in selecting a crediting period, the benefits of the potentially longer crediting period of the renewable crediting period (e.g. up to 21 years) must be weighed against the additional transaction costs of re-validating the project after each 7-year period, and the risk of the project potentially not meeting validation requirements at that time. As shown in table 3.
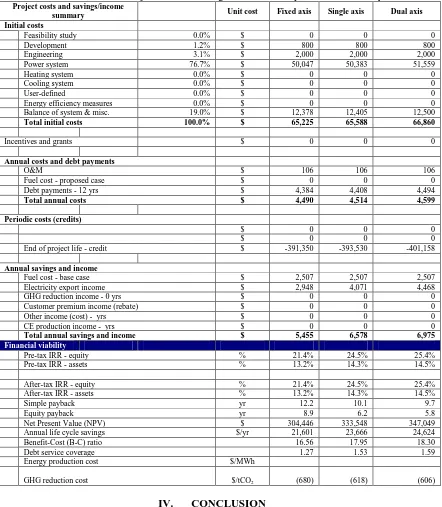
F. Total annual costs
Table 3:Project costs and savings/income summary & financial viability
Project costs and savings/income
summary Unit cost Fixed axis Single axis Dual axis
Initial costs
Feasibility study 0.0% $ 0 0 0
Development 1.2% $ 800 800 800
Engineering 3.1% $ 2,000 2,000 2,000
Power system 76.7% $ 50,047 50,383 51,559
Heating system 0.0% $ 0 0 0
Cooling system 0.0% $ 0 0 0
User-defined 0.0% $ 0 0 0
Energy efficiency measures 0.0% $ 0 0 0
Balance of system & misc. 19.0% $ 12,378 12,405 12,500
Total initial costs 100.0% $ 65,225 65,588 66,860
Incentives and grants $ 0 0 0
Annual costs and debt payments
O&M $ 106 106 106
Fuel cost - proposed case $ 0 0 0
Debt payments - 12 yrs $ 4,384 4,408 4,494
Total annual costs $ 4,490 4,514 4,599
Periodic costs (credits)
$ 0 0 0
$ 0 0 0
End of project life - credit $ -391,350 -393,530 -401,158
Annual savings and income
Fuel cost - base case $ 2,507 2,507 2,507
Electricity export income $ 2,948 4,071 4,468
GHG reduction income - 0 yrs $ 0 0 0
Customer premium income (rebate) $ 0 0 0
Other income (cost) - yrs $ 0 0 0
CE production income - yrs $ 0 0 0
Total annual savings and income $ 5,455 6,578 6,975
Financial viability
Pre-tax IRR - equity % 21.4% 24.5% 25.4%
Pre-tax IRR - assets % 13.2% 14.3% 14.5%
After-tax IRR - equity % 21.4% 24.5% 25.4%
After-tax IRR - assets % 13.2% 14.3% 14.5%
Simple payback yr 12.2 10.1 9.7
Equity payback yr 8.9 6.2 5.8
Net Present Value (NPV) $ 304,446 333,548 347,049
Annual life cycle savings $/yr 21,601 23,666 24,624
Benefit-Cost (B-C) ratio 16.56 17.95 18.30
Debt service coverage 1.27 1.53 1.59
Energy production cost $/MWh
GHG reduction cost $/tCO2
(680) (618) (606)
IV.
CONCLUSION
International organization of Scientific Research
39 | Page
2013.
[4]. Md. Rabiul Islam, Youguang Guo, Jian Guo Zhu and M. G. Rabbani, “Simulation of PV Array Characteristics and Fabrication of Microcontroller Based MPPT”, IEEE International Conference on Electrical and Computer Engineering ICECE, December 2010, pp. 155-158.
[5]. De Wild-Scholten, Mariska (2013). "Energy payback time and carbon footprint of commercial photovoltaic systems".Solar Energy Materials & Solar Cells119: 296– 305.doi:10.1016/j.solmat.2013.08.037
[6]. http://redis.energy.gov.za/wp-content/uploads/2017/07/trackers.jpg
[7]. Sawle, Y., Gupta, S.C. and Bohre, A.K. "Socio-techno-economic design of hybridrenewable energy system using optimization techniques." Renewable Energy 119 (2018):459-472.
[8]. Sawle, Y., Gupta, S.C. "Optimal sizing of photo voltaic/wind hybrid energy system for rural electrification." In Power India International Conference (PIICON), 2014 6th IEEE, pp. 1-4. IEEE, 2014. [9]. Izadyar, Nima, et al. "Investigation of potential hybrid renewable energy at various rural areas in
Malaysia." Journal of cleaner production 139 (2016): 61-73.
[10]. lee, Kyoung-Ho, et al. "Preliminary determination of optimal size for renewable energy resources in buildings using RETScreen." Energy 47.1 (2012): 83-96.
[11]. Shezan, SK A., et al. "Performance analysis of an off-grid wind-PV (photovoltaic)-diesel-battery hybrid energy system feasible for remote areas." Journal of Cleaner Production 125 (2016): 121-132.
[12]. Ullah, Hayat, et al. "Investor focused placement and sizing of photovoltaic grid-connected systems in Pakistan." Renewable Energy 121 (2018): 460-473.