Vol. 05, Issue 10 (October. 2015), ||V2|| PP 51-55
Solving Voltage Dip Problems of An Inter-Connected
Transmission System Using RPBs AND SLFEs
Osita Oputa
Department of Electrical/Electronic Engineering Michael Okpara University of Agriculture.
Abstract: – Electrical devices are design to operate at certain range of voltages, when the voltage input to them goes out of the range, their efficiency is affected. Hence, the need to ensure that the buses in a transmission system run within the certified value (±5% of rated values) cannot be overemphasized. This is because whenever the voltage of a particular bus in the transmission system dips below the stated value of the rated voltage, all substations and equipment in that particular bus runs at reduced efficiency and damages may even result. The first is for the control engineer to notice which bus is experiencing voltage dip (VD); the other is to rectify it. To do this, static load flow equations (SLFEs) will be used to monitor the various bus voltages for any VD. Whenever it occurs in any bus, reactive power banks (RPBs) installed in all the buses will be used in its solutions. These RPBs have the ability to generate reactive power which add up and increase the reactive of the system giving raise to voltage stability of the system. In this paper, a 10-bus system voltage was monitored using Gauss-Seidal iterative method of solving SLFEs by a program written in visual basic (VB). This revealed VD in buses 2, 4, 6 and 7 with 300kV, 298kV, 270kV and 306kV respectively. Further simulation shows that by generating RP of 31.8MVAr, 41.7MVAr, 69.2MVAr and 25.6MVAr respectively, the VD problem shall be rectified.
Key Words: voltage dip power banks equations
NOMENCLATURE
𝑆𝑘∗ Complex Power of „k‟ bus.
𝑃𝑘 Real Power of „k‟ bus.
𝑄𝑘 Reactive Power of „k‟ bus
𝑄𝑛𝑑 Reactive Power needed to aid Voltage Stability in a particular bus.
𝑉𝑖 „i‟ bus voltage.
𝑉𝑘 Voltage of „k‟ bus
𝑉𝑘∗ Conjugate of 𝑉𝑘
𝑌𝑘𝑖 Admittance connecting „k‟ and „I‟ bus n Number of buses in the interconnected
transmission system. k bus under review.
I.
INTRODUUCTION
VD in transmission systems is simply when transmission voltage falls below the recommended range of values. This can be as a result of fault in the line or at a particular bus in an interconnected system, overloading in a particular bus. When this occur in any bus in an interconnected system, all substations and loads in that bus also suffer the effect; hence, the need to monitor and prevent all the buses of the system from experiencing this effect. This paper shall use the Static Load Flow Equations (SLFE) in monitoring various bus voltages in an interconnected transmission system and on noticing any bus where the voltage is out of standard, then it will be assumed that the stability limit of any Reactive Power Bank (RPB) installed at that particular bus (if any) has being exceeded, possible ways of solving the challenge shall then be considered.
Power supply voltage among other factors or variables depends on the reactive power (RP) of the supply. Hence, automating the RP can be used to control the system voltage. This means that generating extra RP to the system by any means can boost voltage thus healing VD.
The synchronous condensers as one of the recent RPBs are essentially synchronous motors with no mechanical output. It takes a small amount of real power from the power supply to generate RP to the power system [2]. They are salient poles designs of 6 to 8 poles and are connected to power bus directly or through transformers. The excitation current of the synchronous condenser is varied automatically to generate the required reactive power. These synchronous condensers can deliver lagging (or absorb leading) vars (KVAr or MVAr) when its excitation is positive, it can also deliver leading (or absorb lagging) vars if the excitation current is negative. The Static Vars Device or Controllers (SVC) tries to solve the problem of the synchronous condensers taking real power form the system as it is a static devices. There are basically two types of SVC, the Fixed Capacitor – Thyristor Controlled Reactor (FC-TCR) and the Thyristor – Switched Capacitor Controlled Reactor (TCR). In any of the two, real power is not taken from the system as they are static devices; however, the TSC-TCR is more flexible and requires smaller rating of reactor and consequently generates fewer harmonic [3]. Other types of RPB include the Static Synchronous Compensator (STATCOM), Static Synchronous Series Compensators (SSSC), e.t.c. These RPBs have another advantage of improving power factor.
II.
MODEL FORMULATION
2.1 MODEL TO MONITOR BUS VOLTAGE OF THE SYSTEM
If there are „n‟ buses in the interconnected transmission system, the complex power of a particular bus k, is
S*k
n i i ki k kk jQ V Y V
P
1 *
(1)
Thus, for a particular real and reactive power of a bus k, the voltage Vk of the bus is given as
n k i i i ki k k k kkk Y V
V jQ P Y V , 1 * 1 (2)
By specifying one of the buses as the slack bus and using the Gauss-Seidel iterative method, a number of iterative computations (may be five) of 𝑉𝑘 can be obtain (or when the difference between two successive calculated values of Vk from two successive iterations is less than 0.00005). The resulted voltage is then
compared with the standard range (i.e, ±5% of the normal or expected voltage value). If it lies between that ranges, then that particular bus voltage is okay; if not, that bus is in a state of voltage dip.
2.2. MODEL TO FORECAST RP TO SOLVE VOLTAGE DIP
If it has been observed that VD exist in a particular bus, then the stability limit of those RPBs installed at those buses have been exceeded (if any). Thus, the control engineer will need to switch on the reserve RPB available. But he has to know the quantity of RP to be generated to solve that particular voltage instability problem. This is very important as per cost effectiveness. This RP can be forecast by the equation given below,
n i i ki k mk I V Y V
Q
1 *
(3)
𝐼𝑚 is the imaginary park of the RHS.
𝑉𝑘∗ is the conjugate of the proposed stability voltage.
If the initial RP available in that bus is Q1, then the RP that should be generated Qnd, is given as
1 Q Q
Qnd k (4)
III.
SYSTEM ANALYSIS
A 10-bus, 330kV transmission system representing the southern Nigeria region with the admittance characteristics shown in the table below shall be analyzed.
TABLE 1: TRANSMISSION LINE PARAMETERS
Line G B
3-5 1.061503 -3.021124 3-7 1.641236 -2.137604 4-5 1.756023 -0.961326 4-6 0.851297 -1.223107 5-7 1.021301 -3.420070 6-8 0.582187 -1.572981 6-9 0.983551 -1.737255 9-10 1.109431 -2.020735 The circuit diagram for the transmission network is given below.
FIG 1: Southern Nigeria 330kV Transmission System Network (Source: Power Holding Company of Nigeria; Afam, Rivers State Nigeria)
At a particular time of a day, the bus power specifications were collected and recorded as found in the table below with a common base voltage and power of 330KV, and 100MVA respectively.
Bus PG(MW) QG(MW) PD(MW) QD(MW) V 1 0.550 0.300 0.460 0.245 ….
2 0.000 0.000 0.644 0.240 1.02⎳0
3 0.90 0.25 0.00 0.00 1.04⎳0
4 0.00 0.00 0.527 0.345 1.00⎳0
5 0.50 0.20 0.000 0.000 1.00⎳0
6 0.00 0.00 0.835 0.300 1.00⎳0
7 0.00 0.00 0.668 0.450 1.01⎳0
8 0.85 0.50 0.000 0.000 1.02⎳0
9 0.95 0.50 0.000 0.000 1.02⎳0
10 0.00 0.00 0.526 3.120 1.00⎳0 BUS 7
BUS 5
BUS 1
BUS 4
BUS 3
BUS 2
BUS 8
BUS 6
BUS 10
TABLBE 2: BUS POWER SPECIFICATIONS The bus specifications are given below
Bus Bus specification 1 Slack bus 2 PQ bus 3 PV bus 4 PQ bus 5 PV bus 6 PQ bus 7 PQ bus 8 PV bus 9 PQ bus 10 PQ bus
Monitoring of the bus voltage is archive by Gauss-Seidal iterative computations method with bus 1 used as the slack bus and using five iterations with a computer aided computation by a program written in Visual Basic (VB), the following results were obtained.
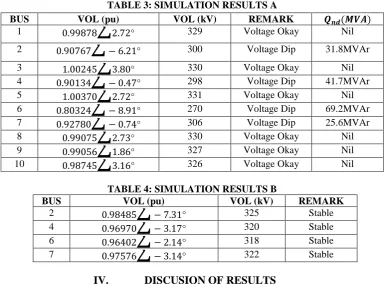
TABLE 3: SIMULATION RESULTS A
TABLE 4: SIMULATION RESULTS B
BUS VOL (pu) VOL (kV) REMARK
2 0.98485⎳ − 7.31° 325 Stable
4 0.96970⎳ − 3.17° 320 Stable
6 0.96402⎳ − 2.14° 318 Stable
7 0.97576⎳ − 3.14° 322 Stable
IV.
DISCUSION OF RESULTS
The results of simulation A on table 3 gave the respective bus voltages and show that buses two, four six and seven are experiencing VD as indicated by the remark because their voltages differ from the rated voltage of 330kV by less than 5% of the rated voltage of 330kV (which is about 313.5kV). It also gave an estimated minimum quantity of RP to be generated in those buses to aid voltage stability. RPBs of the estimated capacity are then switched on that the respective buses, another simulation is then made to check if after switching on the RPBs, the VD experienced in the affected buses have been rectified and the results are given in simulation B of table 4. It shows that all the buses have started enjoying standard voltage as a result of that action.
V.
CONCLUSION
It has been proven that voltage of a power supply can be controlled by the RP component of the power. Hence, when there is a dip in voltage of the supply, it can be corrected if the RP component can be increased. RPBs have been used to generate these RP into the transmission system network. However, these RPBs have some stability limits, thus, when their limits have been exceeded, other banks should be switched on to aid voltage stability. SLFEs have been used in this research to monitor various bus voltages in the system analyzed.
BUS VOL (pu) VOL (kV) REMARK 𝑸𝒏𝒅(𝑴𝑽𝑨)
1 0.99878⎳2.72° 329 Voltage Okay Nil
2 0.90767⎳ − 6.21° 300 Voltage Dip 31.8MVAr
3 1.00245⎳3.80° 330 Voltage Okay Nil
4 0.90134⎳ − 0.47° 298 Voltage Dip 41.7MVAr
5 1.00370⎳2.72° 331 Voltage Okay Nil
6 0.80324⎳ − 8.91° 270 Voltage Dip 69.2MVAr
7 0.92780⎳ − 0.74° 306 Voltage Dip 25.6MVAr
8 0.99075⎳2.73° 330 Voltage Okay Nil
9 0.99056⎳1.86° 327 Voltage Okay Nil
SLFEs also predicted the values of the respective RPBs that will aid voltage improvement in the affected buses. After the banks have been switched on, the results of simulation B shows that the buses and the entire system bus voltages are within the standard limit.
REFERENCES
[1] Jabbar, R. A., Al-Dabbagh, M., Akmal, M. and Latif, K. (2002): “Reducing voltage dip on switching on heavy duty loads on power system”. IEEE Transaction on Energy Conversion Vol. 3, no. 3, pp. 147-152. [2] Kundur Praha (1994): “Power system stability and control‖”. Tata McGraw-Hill publishing company
lomited, pp 629-990.
[3] Padiyar K. R. (2009): “Fact Controllers in Power Transmission and Distribution.” New Age International (P) Limited, Publishers, New Delhi, India.
[4] Abido, M. A. (2009). “Power systems stability enhancement using FACTS” the Arabian Journal for Science and Engineering, Vol 34, no 2B, pp 154-173.
[5] Donde, V. and Hiskens, A. I. (2002). “Voltage stability and control using tap changing transformer” International Journal of Electric Power and Energy Systems, vol. 8, no. 2, pp. 81–97.
[6] Gupta, B. R. (2005). “Power system analysis and design”. 4th edition, Schand and company limited, pp 581-585.
[7] Gupta, J. B. (2005). “A course in power systems”. 10th edition, Saneev Kumar Kataria limited, pp 413-436 (part III).
[8] Jignesh, M. S. (2003). “Voltage stability and control” Ph.D. Seminar, Indian Institute of Technology, Bombay, India.
[9] Moran, L., Pastorini, I., Wallace, R. and Dixon, J. (2000). “Simultaneous voltage imbalance and current harmonic compensation using series active power filter” Proceedings of IEE/PESC (2000), pp 12221-1228
[10] Pastrascu, C., Popescu, D. and Iacob, A. (1999). “Electrical power quality improvement using controlled reactive power filters” IEEE Transactions on Power Systems, vol. 6, no. 2, pp. 118-126.
[11] Ruduck, H., Gomez E. and Rios S. (2000). “Modeling of excitation systems of generators‟ AVR systems”. International conference on power system monitoring and control.
[12] Thukaram, D., Parthasarathy, K., Khincha, H. P., Narendranath Udupa, and Bansilal, A. (1997). “Voltage stability improvement: case studies of Indian power networks”. Electric Power Energy Syst. Vol 18, issue 7, pp 161–168.
[13] Tor, O. B., Karaagas, U. and Benlier, E. (2001). “Step-Response Test of a Unit at Ataturk Hydro Plant and Investigation of the Simple Representation of Unit control System” Proceedings of the 40th IEEE Conference on Decision and Control, Orlando.