Vol. 05, Issue 08 (August. 2015), ||V2|| PP 38-43
A Study on Seismic Inversion Method for Identification of Sand
DU Xinyang
1, LIU Jiyu
1, CHEN Yuchao
2, LIU fan
21(Northeast Petroleum University, Heilongjiang Daqing 163000,China) 2
(The Fourth Oil Production Plant of Daqing Oilfield, Heilongjiang Daqing 163000,China)
Abstract: -With the continuous improvement of exploration technology and the increasing degree of energy
resource exploration, it becomes more and more demanding of looking for new oil and gas. Seismic inversion is
an important method for seismic exploration and oil-gas identification. It is a process of eliminating interfering
wavelet from the synthetic seismogram. By retaining the reflection coefficient sequence, thus the wave impedance
can be computed. First we should make the inspection, splicing and standardized processing on all logging curves,
then use statistical method to predict the relationship between the known properties and the forecasting curves,
and at last determine the four parameters of geostatistical inversion: the S/N ratio of seismic data, seismic
sampling rate, variogram and the ratio of total thickness of sandstone and the thickness of strata. Take Yong 56-96
block of the eighth oil recovery factory of Daqing oil field as the study area, and adopt the joint inversion method
of pseudo-acoustic and geostatistics for identification of sand. As a result, its profile form is more natural, its
vertical resolution and transversal extensibility are better, and its coincidence rate of the well is much higher as
well.
Keywords: - seismic inversion, wave impedance, pseudo-acoustic, identification of sand
I.
INTRODUCTION
Seismic inversion is a process of mapping on the spatial structure and physical properties of the
underground reservoir combined with the data of logging, drilling and geological characteristics on the basis of
the observed seismic data of land surface [1]. Judging the characteristics of wave impedance and the distribution
of velocity of underground reservoir by the seismic inversion method, and estimating the reservoir parameters,
we can predict the lithology of the reservoir and describe the reservoir characteristics, and then provide accurate
basic data for oil and gas exploration.
II.
THE INVERSION PRINCIPLE OF SEISMIC IMPEDANCE
Seismic record is the convolution of wavelet and reflection coefficient sequence, as is shown in formula (1).
t
W
t
R
t
N
n
S
(1) In which, S(t) is the synthetic seismic record, W(t) is the seismic wavelet, R(t) is the reflection coefficientsequence, N(n) is the noise series.
Assuming that the seismic incident ray is perpendicular to the rock interface, then the expression of reflection
coefficient sequence of the normal incidence is:
1 -i 1 -i i i
1 -i 1 -i i i i
v
v
v
-v
R
(2)In the formula, Ri is the ith reflection coefficient sequence of the reflection interface, Vi is the speed of the ith
layer, ρi is the density of the ith layer.
relationship of the inverse wavelet in time domain can be obtained as follows:
t
a
t
t
w
(3)In the formula, a(t) is the inverse wavelet, δ(t) is the unit impulse function.
Making the inverse wavelet a(t) be in convolution with the seismic trace s(t), thus we can get the reflection
coefficient sequence R(t) as the following:
t
s
t
a
t
R
(4)Finally, recursively calculate the reflection coefficient sequence R(t), after that the wave impedance values of
each layer can be obtained:
i i i i i i i i i i
R R Z R R v v
Z
1 1 1
1 1
1
1
(5)Thus we can realize the conversion of the reflection profile of interface type and the stratigraphic section [2].
III.
KEY STEPS OF THE SEISMIC INVERSION
3.1 The pretreatment of the logging curve
3.1.1 The choice of the standard layer
If the target bed of the work area changes little in buried depth, then we first choose the standard well, and
afterwards choose the standard layer, by taking the logging reaction of the standard layer segment of the
standard well as the standard of the whole zone, and eventually we can implement the standardization of the
well logging curve.
3.1.2 Method of the standardization of logging curves
①The mean correction technology
In order to determine the normalization, we compare the average logging curve of the standard layer of
each well with that of all wells on the basis of the environmental correction of mud invasion.
②The histogram correction technology
After a series of environmental correction, we adopt the method of statistical analysis to make statistics
on a certain curve of the standard layer, and obtain the frequency distribution histogram, then take it as the
analytical calibration standard of the normalization of the logging curves, and then make statistics on the
corresponding curve of the standard layer of each well, after that compare the frequency distribution with the
standard well, and at last determine the normalized correction.
③Normalization of the curve of DT, DEN and GR
The curve of DT and DEN can be normalized in view of the target bed by using the histogram
correction method. After the correction, we discovered that the acoustic wave changed little before and after
correction, which indicates that the formation in this area is stable, and the quality of the acoustic wave is better.
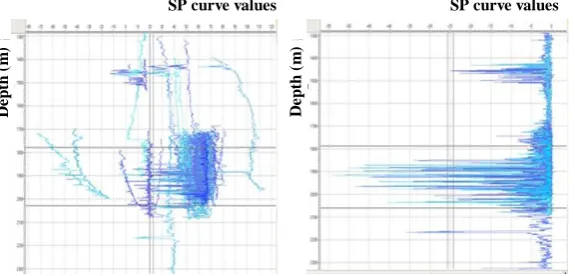
④Standardization of SP curve
SP is highly influenced by depth within short distances, and the SP curve is inclined. Because the value
of SP curve is relative to the limit value, first of all, we have to delimit the baseline of SP curve, and then make
use of the baseline to make correction of the SP curve (Fig 1), the SP curve is dispersed before the drift of the
standardization of the SP curve in the study area.
D
e
p
th
(
m
)
SP curve values
D
e
p
th
(
m
)
SP curve values
D
e
p
th
(
m
)
SP curve values
D
e
p
th
(
m
)
SP curve values
Fig 1 the before (left) and after (right) effect drawing of the drift of the baseline
⑤Standardization of resistivity curve
The resistivity curve is merely the characterization of the oiliness of reservoir, it does not represent the real
value of formation, so using formula to complete standardization of the curve.
R
R
R
R
'
0 0 std
log
log
In which, Rstd is the resistivity after standardization; R is the original resistivity; R´0 is the baseline value; R0 is
the standard baseline value.
3.2 Prediction of density curve
3.2.1 The loading of logging curves
When loading curves participating in prediction, we should as much as possible choose the curves with all wells,
and make use of the curves to calculate various kinds of attributes as the characteristic curve.
3.2.2 The relationship between statistical attribution and objective curve
In most cases, the objective curve and other curves are usually not necessarily linear relationships, however, the
relationships between the objective curves and the deformation of attributes(such as square, reciprocal,
logarithm) are more apparent, so we must give full consideration to the deformation of various attributes in the
multiple attribute prediction. Comparing the correlation of the deformation of various attributes of the measured
objective curve, and sorting them according to the correlation coefficient, thus we can obtain the multiple
attribute lists.
3.2.3 Determine the length of the convolution factors
Because the logging curve has a certain trend of background, if merely utilizing the weight sum method to
calculate density, it may not be able to correctly reflect the background. By judging the length of the
convolution factors, we can remove the possibility of producing incorrect background.
3.3 Key parameters of seismic inversion
There are four critical parameters in seismic inversion, the S/N ratio of seismic data, seismic sampling rate,
variation function and the ratio of total thickness of sandstone and the thickness of strata. The appropriate
foundation for the application of inversion technique.
3.3.1 Well-seismic calibration and extraction of seismic wavelet
In the process of the research, we had made the wavelet estimation on the whole superposition data. After
standardization of the wells in the work area, we used the conventional well-seismic calibration method to
extract wavelet.
3.3.2 The S/N ratio of seismic data
The higher the S/N ratio is in the process of inversion, the greater the proportion of the seismic is in the
inversion result, and the smaller the proportion of the wells is. On the contrary, the lower the S/N ratio is, the
smaller the proportion of the seismic is in the inversion result, and the greater the proportion of the wells is.
3.3.3 Seismic data resampling
The purpose of seismic data resampling is the improvement of the matching degree of borehole-side seismic
trace and logging data in the longitudinal direction, retain more high frequency logging information, thus further
enhance the vertical resolution of the seismic [3].
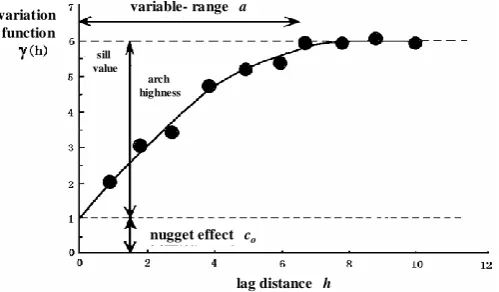
3.3.4 The variation function
Variation function is a kind of statistical function. It is used to describe the relationship between data in space
data field [4]. But the variation function figure is obtained by taking the lag distance h of the experimental variation function as abscissa and γ(x, h) as ordinate(Fig 2).
variation function
lag distance h variable- range a
arch highness
nugget effect co
sill value
variation function
lag distance h variable- range a
arch highness
nugget effect co
sill value
Fig 2 the schematic diagram of theoretical model of the variation function
3.3.5 The ratio of total thickness of sandstone and the thickness of strata
The value of the ratio of total thickness of sandstone and the thickness of strata has a great influence on the
prediction accuracy of the inversion. The greater the value is, the more sand prediction there are, whereas the
less.
IV.
SAND PREDICTION AND EFFECT ANALYSIS
Taking Yong 56-96 block of the eighth oil recovery factory of Daqing oil field as the study area, after
completing the optimization of inversion parameter of this area, we conducted the inversion of the whole work
area, and began to carry out the sand prediction work. Before prediction, we had first made statistical analysis
cannot distinguish the sand-shale in other layers, therefore, directly using the original curve to conduct
geostatistical inversion can't solve the problem of reservoir prediction in this area.
Fig 3 the histogram of the relationship between sand-shale and wave impedance in Putaohua oil layer
So we have to find the relationship between other curves and sand-shale. Looking from the figure 4 (Fig 4), the
relationship of GR curve and sand-shale is the closest, for this reason, so we apply GR curve for the fitting of
wave impedance, and make use of the fitting wave impedance inversion to distinguish sand-shale.
acoustic curve density curve
Longitudinal wave impedance curve
SP curve GR curve resistivity curve
acoustic curve density curve
Longitudinal wave impedance curve
SP curve GR curve resistivity curve
Fig 4 the histogram of sand-shale and logging curve
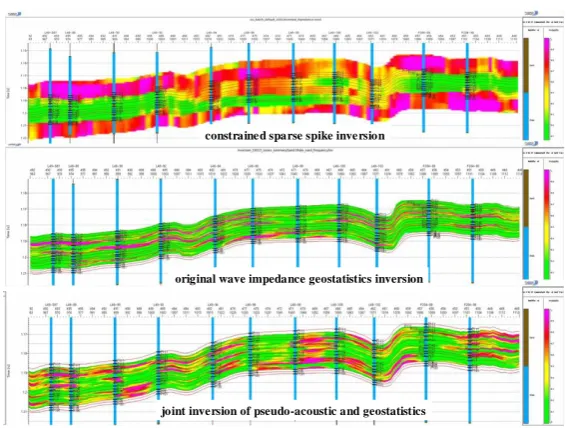
We have applied the yong48-S87-fang204-90 connected wells' profile to carry out contrast experiment on the
joint inversion method of pseudo-acoustic and geostatistics (Fig 5), the results show that the resolution of
constrained sparse spike inversion is too low, the well coincidence rate of the original wave impedance
constrained sparse spike inversion
original wave impedance geostatistics inversion
joint inversion of pseudo-acoustic and geostatistics constrained sparse spike inversion
original wave impedance geostatistics inversion
joint inversion of pseudo-acoustic and geostatistics
Fig 5 the contrast diagram of the joint inversion method of the fitting wave impedance and geostatistics
V.
CONCLUSION
In this seismic inversion, we have used the fitting wave impedance inversion combined with statistical
inversion method to carry out sand prediction, this method combines the advantage of pseudo-acoustic and
geostatistics inversion, which not only ensured the vertical resolution, but also accurately identified sand. At the
same time, by adopting the joint inversion method of pseudo-acoustic and geostatistics for identification of sand
in this study, its profile form is more natural, its vertical resolution and transversal extensibility are better, and
its well coincidence rate is much higher too.
REFERENCE
[1] LU Baokun, SHI ge, Research Summary of Logging Data and Seismic Attribute, Journal of Beijing
university (natural science edition), 41(1), 2005, 154-160.
[2] MA Jingfeng, XU Shenghui, WANG Guishui, GAO Le, Confronting problems and progress of Seismic
trace inversion, Oil & Gas Geology, 23(4), 2002, 321-325.
[3] CHEN Yaxin, WEI Fenyun, GAO Lifeng, Application of Reservoir prediction technique in pyroclastic
rock in Ying 2 Segment, Yingtai fault depression, songliao basin, China Petroleum Exploration, 18(3),
2013, 50-56.
[4] WANG Xiaoping, SHANG Jianlin, WANG Linsheng, Application of Geostatistical inversion in Mabei