Experiment of Suspended Load with
Hyperconcentration in Rectangle Open Channel
Changjun Zhu
College of Urban Construction , Hebei University of Engineering , handan, 056038, P.R.China Email: [email protected]
Zhenchun Hao
State Key Laboratory of Hydrology-Water Resources and Hydraulic Engineering, Hohai University ,Nanjing, China
Abstract—In view of the abnormal phenomenon that a flood peak increased in August 2004 and July 2005 along the lower Yellow River, the experiments of this abnormal phenomenon is studied. It is found that the flood increase was due to the decrease the channel roughness in the propagation of high concentrated flood carrying the extra fine sediment which was discharged from xiaolangdi reservoir. Experiments with hyper-concentration flowing over the rough beds prove that the resistance of the flow may be considerably reduced by suspended sediment. Especially in hyper-concentration, the phenomenon of drag-reducing is more obvious when the sediment contents exceed the flocculation sediment contents. It has the significant value for the flood control and flood prediction of hyper-concentration. It is found that the location of the maximum velocity appears below free surface by a series of experiments on velocity distribution and the distribution of sediment concentration in open channel flows. The classic log law and exponential law can not meet the command of experiment. Because the vertical distribution of sediment concentration is dependent on the velocity distribution, based on the diffusion theory, the deriving equation about the distribution of sediment concentration is got according the corrected the equation of velocity distribution. The results indicate that the deriving equation in this paper is well coincident with those observed data in open channel. The equation has important application value.
Index Terms—suspended load; distribution of sediment concentration; velocity distribution; open channel
I. INTRODUCTION
When river water sediment transport, pollutant dispersion, channel scouring, and bank protection works are studied, it is necessary to estimate the velocity accurately. It is hydraulic basic problem to study velocity distribution in open channel, because of the existence of free water, it is more difficult in the theoretical analysis and experimental study on open channel flow than in a pressure pipe flow, as well as boundary layer flow. In the past, for the velocity distribution of open channel flow, most of the theory is based on Prandtle law. According to the Mixed-doped length assumption , the velocity distribution is in accordance with Logarithmic and exponential expression
The current research work has been found that the interaction of sediment to the water flow affect the flow. structure, including the vertical distribution of velocity.
Thus, sediment-laden flow velocity distribution of the river has become an important topic in dynamics and has been a great concern in academic circles.
Resistance with hyper-concentration of the homogeneous fluid in the channel as well as the pipeline of, especially in turbulent conditions, “Drag Reduction Problem” has attracted wide attention, and a large number of experimental have been developed. However, the results are inconsistent. Some think “in the same velocity energy loss of smooth and turbulent flow with hyper-concentration is greater than water”, some consider
hydraulic gradient of turbulent flow( ) is less than the
hydraulic gradient of clean water( ), higher sediment
concentration is , is smaller than , which shows the hyper-concentration turbulent drag reduction phenomenon. The reasons for different conclusions is the different understanding of “drag reduction”. Followed by the experimental conditions of strict control, result in resistance more difficult. Since 1999, Xiaolangdi reservoir plays an important role in flood control, irrigation and repair and maintenance of the healthy life of Yellow River. At the same time, process which the water and sediment flow into the downstream has been changed by the regulation of reservoir and trigger a number of new phenomenon. The abnormal phenomenon that a flood peak increased in August 2004, July 2005, August 2006, August 2007 along the lower Yellow River occurred after the density current is poured. After analysis, the reason triggering the abnormal phenomenon can be considered as the drag reduction in the course. The factors affecting roughness coefficient includes Median grain size of bed load, sediment concentration, median grain size of suspended load, Froude number
m
i
0
i
m
i
i
0Since the 80s in the last century, people have carried out large amount of research on sediment-laden flow velocity distribution of the vertical and achieved fruitful results. Most scholars believe that the law of obedience to the logarithmic distribution, and can be divided into the
following three modes: First, change mode, the second is to maintain the constant to increase in the value of the end of stream function and the third is taking into account the values and wake velocity distribution of the items on the rationalization of the amendment. In this paper, indoor open channel glass flume experiment are studied
to analyze vertical distribution with sediment-laden flow, analyzing the velocity distribution under interaction the sediment and water. Sediments, especially suspended load in natural channel, are the main part of sediment kinetics research and attracting much attention at home and abroad, which are the main reason of channel changes. Scholars have done a series of experiments from different perspectives. Turbulent diffusion theory is widely used, in which coefficient of turbulent diffusion plays an important role in vertical distribution of sediment concentration and different methods lead to different results. Generally,
ε
sy corresponds tocoefficient of turbulent diffusion and the later corresponds to coefficient of momentum exchange, so
2
0
(1
) /
x x
sy m
du
y
du
l
dy
h
dy
ε
=
ε
=
ρ
=
τ
−
ρ
It can be seen from the equation that expression of
m
ε
is due to option of .Based on the data from author and predecessors, we find that when the ratio of width and depth is small ,the location of the maximum velocity appears not at surface but below free surface in open channel because of second eddy. Though now there are many expressions of velocity distribution such as log velocity distribution, Wang Zhide velocity distribution and Zhang Hongwu velocity distribution, the accuracy of results is poor. According to the equation of velocity distribution which the maximum velocity does not locate at free surface, distribution of sediment concentration equation is derivated.( )
x
u y
II. EXPERIMENT METHOD
A. Experiment Instructment
The experiment is done in steel glass channel in Yellow
River Institute of Hydraulic Research with rectangle profile,
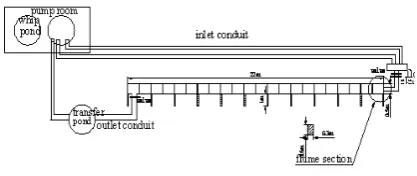
length of 22 meter , width of B=0.3m, height of H=0.5m,and roughness of n=0.010,slope of river bed of i=1/1000 and 3.8/1000. To ensure stability and uniformity, 10 meter at center is selected as experimental paragraph, electromagnetic flow meter is used to measure flow and rotor current meter is used to measure velocity. The channel test system can be seen in figure1.
Figure 1. Sketch of flume
B. Test Conditions
In test, water depth is strictly controlled to make uniform flow in order to compare roughness coefficients in conditions of different sediment concentration.
TABLE I. EXPERIMENT PARAMETERS
d/mm
s
γ
Scope Medium radius
J (%)
S /(kg.m
-3) Q /(L.s
-1) H /cm B/h
2.65
0.0001-0.1 0.0080
0.1-0.38 2.5-402 20-30
9.5-20 1.5-3.15
0 20 40 60 80 100 120
0.001 0.01
0.1 1
R/mm
p
e
rc
e
n
t /%
d50=0.0077mm d50=0.0190mm d50=0.0114mm
Figure 2. Gradation curve
C. Procedure of experiment
To compare the backdrop of different sediment particle size, sediment concentration, flow conditions, the flow velocity distribution and sediment concentration along the vertical distribution, in accordance with the following steps to test.
(1) Open circulatory system to regulate the flow, water depth, to make uniform flow;
(2) Ensure that the cycle long enough time to allow more uniform blending of water and sediment, with flow meter for measuring sediment-laden flow velocity, while sampling, measurement of sediment concentration and sediment particle size distribution;
(3) Changes in sediment concentration or changing the flow rate or water depth, repeat steps (2)
(4) The group after the end of the experiment, washing sink and the circulatory system, and change the sediment on to the next set of experiments
III. VELOCITY DISTRIBUTION IN RECTANGLE OPEN -CHANNEL
Vertical velocity distribution is often determined by log law and exponential law. But in fact because of equation defect and side wall effect, vertical velocity distribution meets log law only in center area while deviation is large at free surface and near bed.
From previous researches and channel experiment, it is indicated that the location of the maximum velocity appears below free surface. There is high accuracy below the maximum velocity using log low and exponential law while accuracy is low at free surface and near bed.
For steady uniform rectangle channel, Reynolds equation is as follows:
(uv xy/ ) (uw xz/ ) gS
y z
τ
ρ
τ
ρ
∂ − +∂ − =
By experiments Tracy(1965) show that in the vertical
direction
y
∂
∂
is larger than in the horizontal directionand
z
∂
∂
can be neglected near bed . Reynolds equationnear bed is expressed as following forms:
_____ 2 * ( )b z
u v
′ ′
u
gyS
uv
−
=
−
+
(2)Where
u
* ( )b z=
τ
b z( )/
ρ
τ
b z( ) is shear stress on bed.When generalized frictional velocity is introduced, Eq (2) changes into the following equations:
*
u
_____ 1 2 2 * *(1
)
u v
y
y
uv
c
u
h
α
h
u
′ ′
−
= −
−
+
+
1 (3)Where 2 * 1 2 *
ghS
u
u
α
=
−
, 2 2 * * 1 2 * bu
u
c
u
−
=
The third part in Eq (3) is calculated using empirical formula as follows:
2 2
*
uv
y
u
≈ −
α
h
(4)2 *
1
u v
u
−−−−−−′ ′
−
≈
when
y
0
h
≈
,soc
1 can be neglected. Reynolds shear stress in rectangle can be approximately determined by below equation:
_____
2 *
(1
)
u v
y
y
u
h
α
h
′ ′
−
= −
−
(5)Reynolds shear stress is determined by below
equation:
u v
tdu
dy
ν
′ ′
−
=
————
(6)
Yalin(1977) has obtained an empirical formula based on observed datas.
*
(1
/ )
t
ku y
y h
ν
=
−
(7) Take Eq (6) and Eq (7) into Eq (5) , equation can be given as: * *[
1
u
u
du
kh
]
y
dy
ky
h
α
=
−
−
(8)
Then integral the above equation when
y
=
y
0,u
=
0
0
* 0
(1
)
1
ln(
)
ln[
]
(1
)
y
u
y
h
y
u
k
y
k
h
α
−
=
+
−
Where 0
*
y
cu
ν
=
Because
y
0/
h
<<
1
,the result is as follows:*
*
1
ln(
cu y
)
ln(1
)
u
y
u
k
k
h
α
ν
=
+
−
(9)To the smooth wall,
*
*
1
ln(
u y
)
sln(1
)
u
y
B
u
k
k
H
α
ν
=
+
+
−
To the rough wall, equation (9) can be expressed as
*
1
ln(
)
fln(1
)
s
u
y
B
u
k
k
k
H
y
α
=
+
+
−
(10)Where
K
sbed roughness; to some flume,*
u
k
is constant under the same flow condition. in order to analyze easily, equation(10) can be expressed as*
1
1
ln(
)
(
ln(
))
ln(1
)
s
u
y
H
kB
u
k
H
k
k
k
H
y
α
=
+
+
+
−
(11)*
ln(
)
ln(1
)
u
y
A
C
A
u
=
H
+ +
α
−
y
H
(12)k
can be calculated by equation (13)1 2 1 1
* 2 2
/
1
1
ln(
)
ln(
)
/
1
u
u
y
H
y
H
u
k
y
H
k
y
H
/
/
α
−
=
+
−
−
(13)Where is the velocity in ; is the velocity in
;
1
u
y
1u
22
y
α
can be calculated by max1
1
y
h
=
+
α
IV. THE EQUATION OF SUSPENDED LOAD CONCENTRATION DISTRIBUTION
A. Determination of coefficient of diffusion
ε
syDetermination of coefficient of diffusion
ε
sy is the most important, complex to the distribution of sediment concentration and different methods lead to different results. There are three kinds of methods as follows:(1)
ε
sy is constant. Once Lane and Kalinske hadadvised
ε
sy equates toku h
*/ 6
,wherek
is von karmans constant,h
is water depth, is frictional velocity. At home when Liu Jianjun did research on water flow of high sediment concentration, he has adapted*
u
*
sy
u hA
(2) To give
ε
sy as a function of special location . But based on current experiment level ,this function relation is difficultly determined, so it is thought thatε
sy equatesto
ε
m. It is known that:2 / 0(1 / )
/
x m
d u y h
l
d u d y d u d y
d y τ τ ρ ε
ρ
−
= = =
Where is Prandtl mixing length,
l
τ
0is shear forceon bed,
ρ
is water density. It is seen that expression ofm
ε
is due to option ofu y
x( )
.(3)
ε ε
sy≠
m .ε
sy is got by varies of methods and theories. Liu Dayou has pointed out the application scope and drawback of Fick law and diffusion law and compared the results calculated under the two theories. Cao zhixian and Liu Xingnian get the expression ofε
sy in view of turbulent burst. Shao xuejun make use of random process. All these works have close contact with diffusion law, however, they have their own characteristics.Although
ε
sy approximately equates toε
m. Thesecond method is widely used in practice.
B. Derivation of distribution of sediment concentration At first ,the equation of sediment diffusion is given as
follows:
sy
ds
s
0
dy
ε
+
ω
=
(14)Where
ε
syis coefficient of sediment exchange,ω
issediment velocity.(
cm s
/
)In order to find the solution of this differential equation, we assumed
ε
sy=
ε
m, whereε
mis coefficient of momentum exchange and mdu
dy
τ
ε
ρ
=
.The equation of velocity distribution is as follows:
* 0
1
ln
ln(1
)
u
y
u
k
y
k
h
y
α
=
+
−
Then velocity gradient is defined as follows:
* 0
1
ln
ln(1
)
u
y
u
k
y
k
h
y
α
=
+
−
So coefficient of sediment exchange is as:
0
*
* *
(1 / )
/ ( )
(1 )
1 1
/
sy m
y h y y y h
ku
u u
du dy h y h y
k y k y h
τ τ ρ
ε ε α
α
− −
= = = = − ⋅
− + +
−
(15) Take Eq (4) into Eq (2), result is as:
*
1
1
1
sy
ds
dy
y
y
h
y
s
ku
h
α
ω
ε
+
−
= −
= −
−
(16)
Then integral the above equation,
* *
1
1
1
ln
ln
(
)
1
a
h
s
y
h
h
s
ku
ku y h a h
a
ω
−
αω
=
−
−
−
−
−
(17)
At last, the equation of sediment concentration is given as:
*
*
1 1 / 1
exp[ ( )] ( )
1 / 1 / / 1
ku a
s h
s ku y h a h h a
y ω
αω −
= ⋅ − ⋅
− − − (18)
When the ratio of width and depth is large and
0
α
=
, equation(7) is Traditional Rouse equation, wherethrough max
1
1
y
h
=
+
α
,α
can be solved. V. EXPERIMENT RESULTSA. The Regularity of Roughness Coefficient
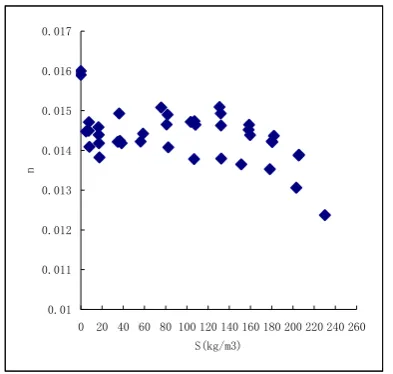
Fig.3 shows as sediment concentration increases, roughness coefficient decreases. When sediment concentration is larger than 60 to 100 kg/m3, roughness coefficient has little changes. But when sediment concentration is larger than 100 kg/m3, roughness coefficient decreases obviously. The writer believes the reason is that sediment-bearing water changes from Newtonian fluid into Bingham fluid. In view of Bingham fluid’s large viscosity, resistance and high energy loss, the drag reduction phenomenon is caused by slip velocity at the intermediate layer between solid and fluid.
0.01 0.011 0.012 0.013 0.014 0.015 0.016 0.017
0 20 40 60 80 10 0
12 0
14 0
16 0
18 0
20 0
22 0
24 0
26 0
28 0 S(kg/m3)
n
0.01 0.011 0.012 0.013 0.014 0.015 0.016 0.017
0 20 40 60 80 100 120 140 160 180 200 220 240 260
S(kg/m3)
n
Figure 3. The relationship between roughness and sediment concentration
B. Critical concentration
Drag reduction with hyper-concentration is due to floc network structure formed by viscous sediment. therefore, flocculation structure formation and development of viscous fluid in suspended particle content. According to formers’ researches, critical concentration is calculated and shown in table2.
When , stiffness of floc network
increase with concentration, Concentrated floc Net can not only support their self-respect in order to avoid deformation, and because of floc Net enrichment, the limits to not participate in the formation of coarse floc sinking Nets.
cr
C
C
v>
(
v)
These sands, at low concentration, turbulent flow can be required to make sediment suspended .As a result, although the increase viscous in a way because of the concentration increase, because of savings of energy flow, so as to achieve a drag reduction and re-value-added performance.
So as to achieve a drag reduction and re-value-added performance.
TABLE II. CRITICAL CONCENTRATION UNDER DIFFERENT SCOLARS
Author
d
50∑
Δ
i i
d
p
Critical volume concentrationCritical qualityconcentration
(kg/m3)
Song —— —— 0.03 79.5
0.0077 200.51 0.041544 110.0918 0.0114 166.42 0.050054 132.6433 Fei
0.019 126.91 0.065637 173.9382
0.0077 200.51
0.0396-0.0434 105-115 Yang
0.0114 166.42 0.046-0.0528 122-140
C. Velocity distribution
Vertical distribution of time average velocity measured under different flow and different sediment concentration
and
ln(
y
)
H
plotted Figure 2, Figure 3s=15
0.00 5.00 10.00 15.00 20.00 25.00 30.00
0.1 1
u/u*
y/h
实测值 计算值 经典对数值
(A) s=15
s=21
0. 00 5. 00 1 0. 00 1 5. 00 2 0. 00 2 5. 00 3 0. 00
0. 01 0. 1 1
u/u*
y/h
实测值 计算值
经典对数值
(B) S=21
s=30
0.00 2.00 4.00 6.00 8.00 10.00 12.00 14.00 16.00 18.00
0.01 0.1 1
y/h
u/u*
实测值 计算值
s=85
0.00 5.00 10.00 15.00 20.00 25.00
0.01 0.1 1
y/h
u/u*
实测值
计算值
(d) s=86
s=100
0.00 2.00 4.00 6.00 8.00 10.00 12.00 14.00 16.00 18.00 20.00
0.01 0.1 1
y/h
u/u*
实测值 计算值
(E) s=100
s=135
0.0 2.0 4.0 6.0 8.0 10.0 12.0 14.0 16.0 18.0 20.0
0.01 0.1 1
y/h
u/u*
实测值 计算值
(F) s=136
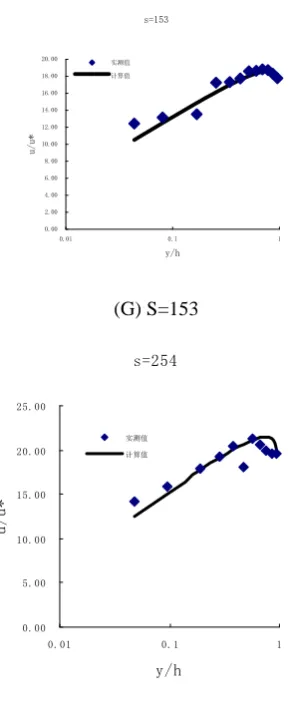
s=153
0.00 2.00 4.00 6.00 8.00 10.00 12.00 14.00 16.00 18.00 20.00
0.01 0.1 1
y/h
u/u*
实测值
计算值
(G) S=153
s=254
0.00 5.00 10.00 15.00 20.00 25.00
0.01 0.1 1
y/h
u/u*
实测值 计算值
(H) S=254
Figure 4. Distribution of velocity
Seen from fig.4, velocity distribution measured is located at both sides of the calculation of value or
calculated value in the formula (11) .
*
u
u
andln( )
y
h
has good correlation, correlation coefficient exceeds 0.95.Seen from fig.4, with the sediment concentration increasing, Carmen constant decreases and velocity increases. Because at the end of the same slope, a larger flow means smaller resistance, which indicate that with the increase of sediment, there is a clear role in drag reduction when the sand is fine sand
TABLE III. THE FITTING COEFFICIENT AND CORRELATION COEFFICIENT IN DIFFERENT VERTICAL VELOCITY DISTRIBUTION
CONCENTRATION VERTICAL
NUMBER 2CM 5CM 10CM 15CM
A 2.7645 3.6037 3.8358 4.1073 C 19.624 21.502 23.559 24.502
α
0.46 0.29 0.28 0.220
Correlation
efficient 0.95 0.96 0.95 0.99 A 2.1857 3.7247 3.754 4.0636 C 18.476 21.674 22.064 24.243
α
0.44 0.25 0.22 0.1815
Correlation
A 2.147 3.1027 3.7027 4.041 C 18.452 20.746 22.203 22.345
α
0.44 0.25 0.21 0.1910
Correlation
efficient 0.96 0.95 0.99 0.99
D. Vertical disribution of sediment concentration
1) Comparison with Rouse equation
0 0.1 0.2 0.3 0.4 0.5 0.6 0.7 0.8 0.9 1
0 0.1 0.2 0.3 0.4 0.5 0.6 0.7 0.8 0.9 1
S/Sa
y
/h
α=0 α=0.01 α=0.02 α=0.04 α=0.08 α=0.16
Figure 5. The vertical distribution of sediment concentration and
α
relationshipIt is seen from figure5,relative sediment concentration is larger than the result of Rouse equation near water surface, but there is less deviation in the below part of channel. Moreover, as parameter
α
increases, that is to say the ratio of width and depth is smaller and the location of the maximum velocity is farer from surface, sediment concentration is larger near surface.E. verification of observed datas
The experiment on the velocity measure of sediment-laden water is done in glass channel indoor with rectangle profile(fig.2), length of 22 meter , width of B=0.3m, height of H=0.5m,and roughness of n=0.010,slope of river bed of i=1/1000 and 3.8/1000.To ensure stability and uniformity, 10 meter at center is selected as experimental paragraph, electromagnetic flow-meter is used to measure flow and rotor current meter is used to measure velocity. Then Eq (18) is verificated by observed data, where setting velocity is defined as follows:
3.5 0
50
[(1 ) (1 1.25 )]
2.25
v
s v
S
S d
ω
=ω
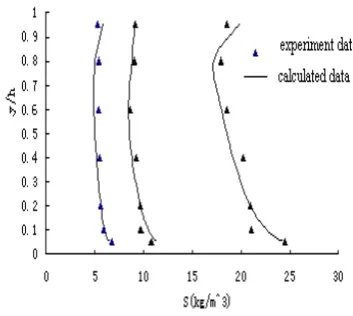
− − (19)From figure 6 ,we can see that results calculated from Eq(18) and observed data are consistent and the both match well when sediment concentration is small.
Figure 6. Compairion between results calculted from Eq(15) and observed datas
So it is known that Eq(18) applies to open channel where the ratio of width and depth and sediment concentration are small.
VI. CONCLUSIONS
We can get conclusions by this paper:
(1) Because the location of the maximum velocity appears not at free surface, log low is not applied for all water depth in open channel when the ratio of width and depth is small.
(2) In this paper, equation of distribution of sediment concentration is capable of simulating distribution of sediment concentration in open channel. The equation apply to open channel with both large and small ratio of width and depth. However, ROUSE equation is used when the ratio of width and depth is large and sediment concentration is small.
(3) The above equation is well used only when there are accurate observed data of velocity distribution and location of the max velocity, so there is limitation to use the equation and we have to go on further research.
(4) Drag reduction phenomenon occur when hyper-concentration flows coursing bed, roughness decrease.
(5) Hyper-concentration flow with extra fine sediment can be considered as Bingham fluid. The reason for drag reduction is floc network. When the Nets floc formed, the viscous drag increasing by resistance and compliance can be ignored in comparison, the sand slurry will drag reduction higher results. (6) This study has an important reference value to
sediment-laden flow, as well as flood forecasting and flood control
ACKNOWLEDGMENTS
National Natural Science Foundation of China (Grant No. 40830639, 50879016, 50979022 and 50679018), the program for Changjiang Scholars and Innovative Research Team in University (IRT0717) and the Special Fund of State Key Laboratory of Hydrology-Water Resources and Hydraulic Engineering (1069-50985512, 1069-50986312)
REFERENCES
[1] Qian Ning. Hyper-concentrated Flow [M].Beijing:
Tsinghua University Press,1989.
[2] Yang,S.-Q,Tan S.-K.,and Lim S.-Y.(2004).Velocity
Distribution and Dip-Phenomenon in Smooth Uniform Open Channel Flows. J.Hydraul. Eng., 130(12):1179-1186.
[3] Chiu C.-L., Jin W.-x., and Chen Y.-C. (2000).
Mathematical Models of Distribution of Sediment Concentration. J.Hydraul. Eng.,126(1):16-23.
[4] Chiu C.-L.(1989) Velocity Distribution in Open Channel
Flow. J. Hydraul. Eng,115(5):576-594.
[5] Liu C.J.,Li D.S.,Wang X.-K.(2005). Experimental study on
friction velocity and velocity profile of open channel flow. J.Hydraul. Eng.,36(8):950-955.(in Chinese)
[6] Fei Xiangjun. Resistance of Homogeneous Flow with
Hyperconcentration and Problem of “Resistance Reduction” in Turbulent Regime[J].Journal of Sediment Research,1985(1):13-21.
[7] Lian Jijian, Hong Roujia. Turbulence Characteristics of
Drag-reducing flows with muddy meds [J]. Journal of Hydraulic Engineering,1995,(9):13-21.
[8] Wang Zhaoyin, Song Zhenqi. The Phenomenon of Drag
Reduction in Flows of Clay Suspensions[J]. Acta Mechanica Sinica,1996,28(5):522-531.
[9] Shu Anping, Liu Qingquan,Fei Xiangjun. Unified Laws of
velocity Distribution for sediment laden flow with high and low concentration[J].Journal of Hydraulic Engineering,2006,37(6)1175-1180.(in Chinese)
[10]Zhang Dao-cheng. Preliminary Study on the Rheological
Parameters of Bingham Fluid in Laminar and Uniform Open Channel Flow[J]. Journal of Chengdu University of Science and Technology,1990(1):89-96.(in Chinese)
[11]Xia Dehong, Zhou jun, Wu jie. The Drag Reduction
Mechanism and Measures for Pipe Flow of Bingham fluid [J]. Energy for Metallurgical Industry, 2002,21(1):31-34. (in Chinese)
[12]Qian Ning. Hyper-concentrated Flow[M].Beijing:
Tsinghua University Press,1989.
[13]Jiang enhui, Zhao Lianjun, Wei zhilin. Mechanism of
Flood Peak increase along the lower Yellow River and its
Verification [J]. Journal of Hydraulic Engineering, 2006,37(12):1454-1459.(in Chinese)
Changjun Zhu received his B.S. in China University of Petroleum in 1999 and M.S. in the Chinese Academy of science, in 2002. Since then, he is the lecturer of Hebei University of Engineering from 2002 to present. Now he has received Ph.D. in the College of Hydrology and Water Resources, Hohai University in Nanjing, China, His main research interests are in numerical environment modeling