Optimizing Overlap Reductions of Feature Regions for
Image Registration
Hong Zhu, Huiwen Ren*, Jianhui Chang, Yueming Hu
Institute of Mechanical Electronic and Information Engineering, China University of Mining & Technology, Beijing, Ding No.11 Xueyuan Road, Haidian District, Beijing China.
* Corresponding author. Tel.: +86 13051889177; email: [email protected] Manuscript submitted August 5, 2018; accepted September 20, 2018. doi: 10.17706/jcp.13.12.1357-1365
Abstract: Due to the similarity in non-homonymy regions in images, the process of image registration based on featured regions may lead to matching errors. To reduce the occurrence of errors, we propose an algorithm that optimizes overlap reductions of featured regions. By reducing similar non-homonymy regions in images, the distinction between feature regions and the matching accuracy can be effectively improved.
Key words: Feature region, image feature extraction, image registration, overlap reductions optimization.
1.
Introduction
With the advancement of spatial data acquisition and image processing technologies such as remote sensing images, the demand for image registration has also increased. Image registration method based on featured regions is widely used for its good performance. Currently, better performing regional extraction algorithms include: Harris-affine [1], Hessian-affine [1], MSER [2], Kadir-Brady saliency detector [3], EBR [4] and IBR [5]. The MSER algorithm proposed by J. Matas obtains a relatively stable affine invariant region based on the relative change between the threshold and the area of extremum region in the neighboring threshold binary image. The Hessian-Affine algorithm and the Harris-Affine algorithm proposed by Mikolajczyk are used to detect the corner points and normalize them by using the Hessian matrix in multi-scale space and Harris operator in Gaussian space respectively. Furthermore, Mikolajczyk analyzes the performance of various image registration algorithms, of [6] which the MSER algorithm performs best, followed by the Hessian-Affine, Harris-Affine algorithms and so on.
These algorithms mainly optimize the stability of homonymy region extraction. In addition, there are
researchers like Cheng et al. [7] combining MSER and SIFT methods. This is done by utilizing the removal
feature of low information entropy and poor spatial distribution from the detection results of MSER featured regions with the SIFT method of feature description and registration, which improves affine
invariant registration robustness. Van Gool et al. [5], [8] proposed two methods for affine invariant region
extraction successively, yet both produce poor results for images with small overlapping regions. Nevertheless, there still exist problems in the invariant description of feature region.
cause confusion in non-homonymy regions.
Based on the fact mentioned above, this paper proposes a method optimizing the overlap reductions of feature region to reduce similar non-homonymy regions caused by region overlap.
Sectioned into three parts, this paper will first define the relevant parameters for measuring the coverage and distinguishability of featured regions. Next, we will touch upon the optimization algorithm of overlap reductions. Finally, the specific experimental verification and the overall evaluation of the algorithm are given.
2.
The Coverage and Distinguishability Measure of Feature Regions
2.1.
The Coverage of Feature Regions
To measure the degree of region overlap, we first define the overlap rate of the two feature regions
and as:
𝑅𝑄𝑖𝑄𝑗=
|𝑄𝑖⋂ 𝑄𝑗|
min (|𝑄𝑖|,|𝑄𝑗|) (1)
where ∩ denotes the intersection of two regions, | | denotes the potential of the region. The larger
𝑅𝑄𝑖𝑄𝑗 is, the higher the overlap degree is between and .
To measure the overlap degree of the entire image, the featured regions’ average overlap rate of the entire image is obtained via:
𝑅𝐴𝐿𝐿
̅̅̅̅̅̅ =∑ ∑ 𝑅𝑄𝑖,𝑄𝑗 𝑛
𝑗=𝑖+1 𝑛−1 𝑖=1
∑𝑛−1𝑖=1∑𝑛𝑗=𝑖+1𝐷𝑄𝑖,𝑄𝑗 (2)
where n is the number of all feature regions in the image. 𝑄𝑖,𝑄𝑗 indicates whether and overlap:
𝑄𝑖,𝑄𝑗= {
0, | ∩ | = 0
1, | ∩ | ≠ 0 (3)
2.2.
The Distinguishability of Feature Regions
The separation degree is used as an evaluation index to measure the distinguishability of feature regions and indicate the difference between the region and other feature regions in the image. High degree of separation indicates high distinguishability of the region. Such index can be obtained by the following:
𝑖𝑠𝑐𝑄𝑖∗=
𝑚 𝑛𝑖=1,𝑖≠𝑖∗𝑛 𝑑(𝑇(𝑄𝑖∗),𝑇(𝑄𝑖))
𝑚𝑎𝑥𝑖=1𝑛 |𝑇(𝑄
𝑖)|−𝑚 𝑛𝑖=1𝑛 |𝑇(𝑄𝑖)| (4)
where ( ) is the feature descriptor of the feature region , is the Euclidean distance between the
features, and denotes the total number of image feature regions. The average separation degree of image
is denoted as 𝑠𝑐̅̅̅̅̅̅.
The value of 𝑠𝑐̅̅̅̅̅̅ reflects the distinguishability of the overall feature region in the image. The value corresponds directly to the influence of the confusion of non-homonymy regions in the image feature region matching process, and indirectly with matching accuracy.
𝐻𝑄= − ∑255 =0𝑃𝑄(𝑖) log2𝑃𝑄(𝑖) (5)
where 𝑃𝑄(𝑖) represents the probability that the gray value appears in the region Q. The higher the value
of 𝐻𝑄, the greater the amount of information carried in the region, the richer the detailed information used
for feature description, and the more distinguishable the region is from other regions.
3.
The Optimization Method of Overlap Reductions
3.1.
The Optimization Method
The main purpose of optimizing overlap reductions is to remove regions with high overlap and low discriminability.
There exists a valid region , which satisfies the following condition:
(𝑅𝑄𝑖,𝑄𝑗 0) (𝐻𝑄𝑖 𝐻𝑄𝑗) (6)
Then any valid feature region should be removed from the valid regions. In the formula, 0
represents the threshold of overlap rate and its value is in the range of [0,1]. The probability of removing increases as 0 reaches 1.
Utilizing the method above, if region overlaps with other regions, and carries less information,
then region should be removed.
Utilizing the above method, the available information in the feature region can be well preserved. However, the initial sequences of featured regions will affect the stability of the optimization results by rendering the optimization of the featured regions between the reference image and registered image out of synchronization. Thereby, reducing the consistency of optimized feature regions.
3.2.
The Initial Sorting of Feature Regions
A reasonable initial sorting of the feature regions can enhance the stability of the culling and thus becomes a necessity. The initial sorting strategy is related to the regional optimization effect.
The initial sorting is mainly based on the number of coverage layers from the largest to the smallest. The
number of coverage layers of the region Q* is defined as 𝑄∗:
𝑄∗= ∑ 𝑄∗,𝑄 𝑖
𝑛
= (7) where,
𝑄𝑖,𝑄𝑗 = {
1, |𝑄|𝑄𝑖∩𝑄𝑗|
𝑗| 0∩ (𝑖 ≠ )
0,
(8)
With identical coverage layer parameters, this paper proposes three culling strategies, based on the area of feature region: large region first, small region first, and mixed strategy:
a) Large Region First
Feature regions with large overlap areas are removed as we process region areas by descending size.
b) Small Region First
Feature regions with large overlap areas are removed as we process region areas by ascending size.
c) Mixed Strategy
Due to the fact that front region in the sequence is more likely to be culled; it is necessary to preserve regions with high entropy. To do so, the regions with both the same area and same overlap area under above three strategies are sorted according to the value of two-dimensional entropy from small to large.
4.
Experiment Results
4.1.
The Experiment Method
We choose 8 normal images and their affine transformation images whose ordinates are in the range of [5°,40°] with a gradient of 5°, and abscissas with a gradient of 5°, are selected as experimental dataset and used to carry out the experiment.
The original images for the experiment are shown as follows:
(a) Bay (b) City Vision (c) Port
(d) Close city view (e) Farmland (f) Mountain
(g) Snowfield (h) Building
Fig. 1. Original images for the experiment (may not exact proportions).
The experiments conducted by Mikolajczyk K et al. [1] have confirmed that MSER is the most suitable
algorithm for the geometric deformation caused by scene and acquisition perspective changes. Thus, MSER is chosen as an example algorithm in this experiment.
optimize the overlap reduction for all image feature regions, and extract the parameter values of 𝑅̅̅̅̅̅̅𝐴𝐿𝐿 and
𝑠𝑐
̅̅̅̅̅̅. The reference images before and after optimization and their affine transformation images are
respectively feature matched by 2 nearest neighbors, then we compare matching performance. The
threshold 0of the overlap rate is taken to be 0.5 here.
4.2.
The Evaluation Indicators
To measure algorithm performance, the false match rate is defined as following:
𝑅 = 𝑖
100 (9)
represents the removed pairs of points and 𝐴 represents the total number of pairs before
removing false matches through RANSAC. 𝑅 can be used to directly reflect the matching accuracy of
the above matching algorithm.
4.3.
The Experiment Result
The performance of port images in the feature matching optimization experiment is shown as follows:
(a) Matching without optimization. (b)Matching without optimization (RANSAC).
(c) Matching with optimization. (d)Matching with optimization (RANSAC). Fig. 2. Feature matching of port region.
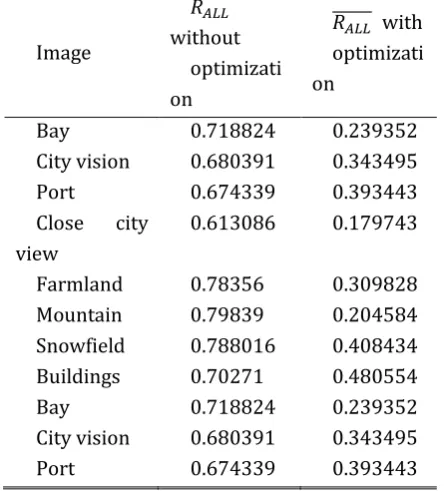
The experimental results of the overlap rate obtained before and after optimizing MSER feature matching for the original images are shown in Table 1.
Table 1 clearly indicates that the optimization algorithm can significantly reduce the overlap of feature areas.
Table 1. Average Overlap Ratio of Images before and after Optimization Image 𝑅̅̅̅̅̅̅𝐴𝐿𝐿 without optimizati on 𝑅𝐴𝐿𝐿
̅̅̅̅̅̅ with
optimizati on
Bay 0.718824 0.239352
City vision 0.680391 0.343495
Port 0.674339 0.393443
Close city
view
0.613086 0.179743
Farmland 0.78356 0.309828
Mountain 0.79839 0.204584
Snowfield 0.788016 0.408434
Buildings 0.70271 0.480554
Bay 0.718824 0.239352
City vision 0.680391 0.343495
Port 0.674339 0.393443
Table 2. Distinguishability Average Value of Images’ Feature Area before and after Optimization
Image 𝑠𝑐 ̅̅̅̅̅̅ without optimizati on 𝑠𝑐 ̅̅̅̅̅̅ with
optimizati on
Bay 0.402693 0.732842
City vision 0.478299 0.882743
Port 0.294784 0.793473
Close city
view
0.598234 0.769287
Farmland 0.546735 0.782374
Mountain 0.428471 0.934841
Snowfield 0.210849 0.804234
Buildings 0.448390 0.842390
Bay 0.402693 0.732842
City vision 0.478299 0.882743
Port 0.294784 0.793473
Table 2 indicates that after the optimization, the average values of distinguishability of the feature regions have improved significantly. The results prove that the optimization method effectively increases distinguishability between feature regions of images while removing overlapping areas.
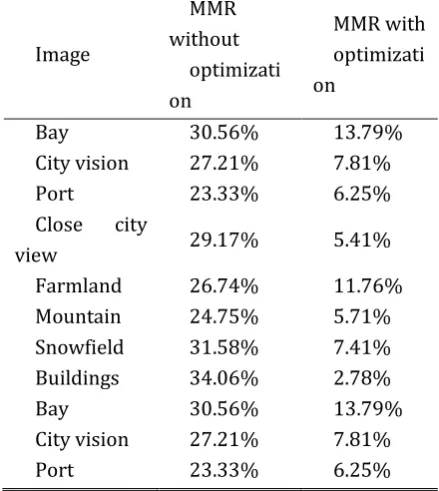
The experimental results of the mismatching rate before and after optimizing MSER feature matching
between the original images and the images with a gradient angle of 5° both in abscissa and ordinate are
shown in Table 3:
Table 3. The Feature Region Mismatch Rates before and after Optimization
Image
MMR without
optimizati on
MMR with optimizati on
Bay 30.56% 13.79%
City vision 27.21% 7.81%
Port 23.33% 6.25%
Close city
view 29.17% 5.41%
Farmland 26.74% 11.76%
Mountain 24.75% 5.71%
Snowfield 31.58% 7.41%
Buildings 34.06% 2.78%
Bay 30.56% 13.79%
City vision 27.21% 7.81%
Port 23.33% 6.25%
The experimental results of the mismatching rate before and after optimizing MSER feature regions matching between the original images and their affine transformation images are recorded in Table 4.
Table 4. Average Erroneous Matching Rate of Feature Regions in Different Affine Transformation Images Image
Sets 𝑅̅̅̅̅̅̅̅
Image
Sets 𝑅̅̅̅̅̅̅̅
5-5 27.4
3%
5-10 29.9
3%
5-15 28.6
5%
5-20 29.1
4%
5-25 30.6
6%
5-30 30.6
7%
5-35 31.7
6%
5-40 32.8
2%
5-5 27.4
5-10 29.9 3%
5-15 28.6
5%
Naming of image sets: [the gradient angle in abscissa]-[the gradient angle in ordinate], where abscissas is with a fixed gradient of 5°.
Our results indicate that our algorithm demonstrates good adaptability and stability for image feature region matching under affine transformation.
5.
Conclusion
In this paper, we proposed an optimization algorithm for overlap reduction of similar feature regions. The algorithm helps by reducing the degree of feature regions, improving the distinguishability of feature regions, and effectively reducing the mismatch rate of feature regions. The algorithm not only performs well in remote sensing image processing, but also generally applicable to most algorithms that register in units of feature regions.
In this algorithm, the way we choose parameters for the determination and elimination of overlapping regions is still under a very basic strategy. In the future, we may improve the effect of overlapping region culling strategy by adding adaptive parameter selection or using machine learning methods to further improve the accuracy of image registration.
References
[1] Mikolajczyk, K., & Cordelia, S. (2002). An affine invariant interest point detector. Proceeding of the European Conference on Computer Vision (pp. 128-142).
[2] Matas, J. (2004). Robust wide-baseline stereo from maximally stable extremal regions. Image and
Vision Computing, 22(10), 761-767.
[3] Kadir, T., Andrew, Z., & Michael, B. (2004). An affine invariant salient region detector. Proceeding of the
European Conference on Computer Vision (pp. 228-241).
[4] Tuytelaars, T., & Luc, V. G. (1999). Content-based image retrieval based on local affinely invariant
regions. Lecture Notes in Computer Science, 493-500.
[5] Tuytelaars, T., & Luc, V. G. (2000). Wide baseline stereo matching based on local, affinely invariant
regions. Proceeding of the British Machine Vision Conference(pp. 1-14).
[6] Mikolajczyk, K. (2005). A comparison of affine region detectors. International Journal of Computer
Vision (pp. 43-72).
[7] Cheng, L. (2008). Robust affine invariant feature extraction for image matching. IEEE Geoscience and
Remote Sensing Letters, 5(2), 246-250.
[8] Goedeme, T., Tinne, T., & Van G. L. (2004). Fast wide baseline matching for visual navigation. Computer
Vision and Pattern Recognition, 24-29.
Huiwen Ren has been a college student in major of computer science and technology in China University of Mining and Technology (Beijing) since September 2015.
He followed Hong Zhu to learn about image matching algorithm and now major in video encoding and image processing. He has been studying China Audio and Video Coding Standard (AVS) since December 2017 and involved in the open-source work of AVS2 since 2018. He is now a contributor of ffmpeg and applying to be a maintainer.
Jianhui Chang was born in Hebei Province, China on September 1st, 1996. She has been a college student in major of computer science and technology in China University of Mining and Technology (Beijing) since September 2015.
Her research interests include multimedia search and recommendation, 3D face modeling, and artificial intelligence. She involves the study of human facial expression capture as college student innovation project. She won the first price in application development competition for Android in November 2017.