Object Detection, Extraction and Classification
using Image Processing Technique
Ms. Payal Bose Prof. Samir Kumar Bandyopadhyay
M.Tech Student Professor
Department of Computer Science & Engineering Department of Computer Science & Engineering
University of Calcutta University of Calcutta
Abstract
Extraction of object components from image has been a continuous area of research since very long time. Extracting each focused object from the image is the main task in many different areas i.e. Medical disease detection, satellite object extraction, image retrieval, objects recognition etc. Normally in image object extraction techniques first detect different related objects in images and in second step extract the related objects from the original image. This paper proposed a method for extraction of objects present in an image using, edge detection, segmentation, object extraction and object detection.
Keywords: Edge Detection, segmentation, classification, Object extraction and Object Detection
_______________________________________________________________________________________________________
I. INTRODUCTION
Object extraction is a challenging area in the image processing. In object extraction the technique of extracting objects from the pre-processed image is done in such a way that similarity class within image is made into a number of clusters for isolating segmented images from the original image. The nontrivial contents, usually in the form of interesting objects, are sufficient to represent the semantic meanings in most cases and consequently play an important role in many image applications such as content-based retrieval. Therefore, many methods have been proposed to automatically extract interesting objects. Image Object extraction techniques are very useful for disease detection, object localization and object tracking. The method used for still image object extraction can also use for 3D image and video frames for the same purpose. Object Extraction is a closely related issue with the segmentation process. Image Segmentation is a process of dividing an image into sub partition based on some characteristics like color, intensity etc.
The main goal of object extraction is to change the representation of an image into something more meaningful. To extract an object from the image first we have to segment the entire image. User select the region as background and foreground by using the markers and then the algorithm will segment the image and the foreground region will be extracted from the image. Image segmentation is a fundamental step in many areas of computer vision including object recognition, video surveillance, face recognition, fingerprint recognition etc. It provides additional information about the contents of an image by identifying edges and regions of similar color and texture. Although a first step in high level computer vision tasks, there are many challenges to ideal image segmentation. Segmentation subdivides an object into its constituent regions or objects. The level of detail to which the subdivision is carried on depends on the problem being solved. That is the segmentation should stop when regions or objects of interest have been detected. For example, if an image consists of a tree, the segmentation algorithm may either stop after detecting the entire tree or further divide the tree into trunk and leaves.
Interactive image segmentation is a way to extract foreground objects in complex scenes using simple user interaction. The key to success in interactive image segmentation is to preserve characteristics of the user’s interactive information and maintain global data effectively.
II. REVIEW WORKS
results are obtained using Marker Watershed algorithm. The performance parameters that are taken into consideration by the author in this paper are Mean Square Error and PSNR [5-9]. In this paper the process of image segmentation is defined as the technique via which we segment a given photograph into several parts in order that we can further analyzed every of these components present in the photo. The author states that it is possible to extract some records via analyzing them and this statistics is useful for excessive-stage gadget vision software. There are numerous techniques of photograph segmentation to be had in literature. In this paper, analysis is done to examine the discontinuity-primarily based approach for photo segmentation. The discontinuity-based totally segmentation may be categorised into 3 techniques: factor detection, line detection, and aspect detection. The result of these numerous strategies is analyzed in MATLAB the use of IPT. The author additionally enforce the unique part operators inclusive of Prewitt, Roberts, LoG, Canny and the consequences of these operators can be shown on diverse pics[10-13]. In this paper the author offers a new method to picture segmentation the usage of Pillar okay-approach set of rules and the algorithm defined using that set of rules is known as Pillar k-mean s algorithm. This segmentation method includes a new mechanism for grouping the factors of high resolution pictures so that you can improve accuracy and decrease the computation time. The system uses k-way for image segmentation optimized by means of the set of rules after Pillar. The Pillar algorithm considers the location of pillars must be located as a long way from every other to face up to the pressure distribution of a roof, as equal as the range of centroids between the information distribution. This set of rules is able to optimize the k-mean clustering for photo segmentation in the aspects of accuracy and computation time. This set of rules distributes all initial centroids in line with the most cumulative distance metric. In this paper a new technique for image segmentation is developed that compares the results of K-mean algorithm with Gaussian aggregate model [4]. Experimental consequences make clear the effectiveness of our approach to improve the segmentation satisfactory and accuracy factors of computing time . In this paper a new histogram thresholding fuzzy C-method hybrid (HTFCM) approach is presented that would find distinct software in sample popularity in addition to in laptop imaginative and prescient, particularly in shade photo segmentation. The histogram thresholding approach that is proposed in the paper is employed to acquire all feasible uniform regions within the coloration photograph. Then, the bushy C-manner algorithm is applied in the uniform regions while cluster formation and that will enhance the compactness of formed clusters. Experimental outcomes have confirmed that the low complexity of the proposed HTFCM technique should acquire better result[5].
III. PROPOSED METHOD
In this paper image processing using MATLAB commands are used to implement edge detection, segmentation, object detection and object extraction of an image. For this problem, MATLAB graphical interface is used. Our aim is to accept an image from user, then show its pixel value, convert it into grayscale and binary (black and white) image, also showing the pixel value of grayscale image. Then enhancing the image. After that detect the edge of that image and based on it segment the image. After segmentation detect the objects in the image and finally extract the objects from the image. These applications are also applicable for medical images.
The stages in the methodology are shown below:
The steps involve in this methodology are describe below:
Accept Image (From User):
Converting into Greyscale:
Grayscale images consists of color grey, which consists different shades between black and white. After accepting input image then converting it into greyscale represented a luminance image. It also creates the three matrices of red, green and blue channels using linear intensity encoding by gamma expansion.
Converting into Binary:
Binary Image means an image only contains black and white color, it only assign two-pixel intensity value 0 and 1. It also called monochromatic color. When an input image is converting into binary images, then it creates an image, which only consists of black and white color. The value of three matrices corresponding red, green, and blue color is 0 (for black) and 1 (for white).
Image Enhancing:
There are two kinds of techniques used here for enhancing the image 1) Contrast stretching & 2) Histogram equalization. For applying this method must convert the input image into grey image. The above techniques are only works on grey images. In contrast stretching technique the intensity of an image is span to a desired range of values.
In histogram equalization technique the intensity of the image is adjust in such a way that it enhance the image contrast.
Edge Detection:
In edge detection technique, it finds the edges of the image based on the local maxima. First, convert the original RGB image into greyscale image. Then filtering the all three color channel and resize the image. Then extracting the histogram values of the filtering and try to find the local maxima based of the light reflection of the greyscale image pixel by pixel. After that finding the local maxima, sort them and eliminate maxima value of certain range. Then using method multithresh(A,N) which returns thresh a 1-by-N vector containing N threshold values using Otsu's method and use an input argument to imquantize to convert image into an image with N + 1 discrete levels. After that, we get the edges of the whole image without any noise.
Segmentation:
Segmentation is an operation that partitioned an image into its component or it separate the objects. For segmentation edge detection and thresholding is very important. After accepting, the input image from user must convert it into the greyscale image and then for thresholding first consider a certain value in between 0 to 1 of each color channel (red, green and blue). Then convert each channel into binary image and take the sum of three channel. Then complement the sum channel. Complement means it convert the white space into black and vice versa, if there have any small holes then fill it with Ifill command.
Object Detection:
Object detection means determine how many objects are present in an image. So for this after segmented the input image find the morphological structure of the input image, and then open the morphological image in greyscale mode. After that, find the area and eccentricity of the all segmented areas and label them as well as bounded the all-region based on the connectivity with a colourful bound box. After bounding all the objects count how many objects are in the input image.
Object Extraction:
Object Extraction means after segmentation and object detection just extracted all the objects from the images and show them all individually. For this, after bounded all the regions label them. After labelling all the regions, find how many regions are present in the images. After that using a loop for collecting or retrieving the objects from images. Here all the object images are in greyscale mode.
For Medical Image:
Medical images are special images, they are RGB image but it’s not color image. Therefore, for thresholding it has not needed to thresholding each color channel. Here consider a certain thresholding value, check the grey value of the image is greater than the threshold value or not. Then take complement it, segment it, give boundary of the objects, and extract them.
IV. RESULTS
Accept Image (From User):
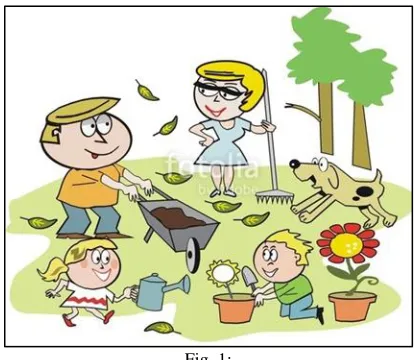
Fig. 1:
Here user chooses their input image. (Fig-1)
Converting into Greyscale:
Converting the input image (Fig-1) into greyscale (Fig-2a) and shown the histogram of greyscale image (Fig-2b).
Fig. 2a: Fig. 2b:
Converting into Binary:
Converting the input image (Fig-1) into greyscale (Fig-3)
Image Enhancing:
Image Enhancing did by two ways 1) Contrast Stretching and 2) Histogram Equalization. Contrast stretching:
The result of this technique is shown below: (Fig – 4a & 4b)
Fig. 4a: Fig. 4b:
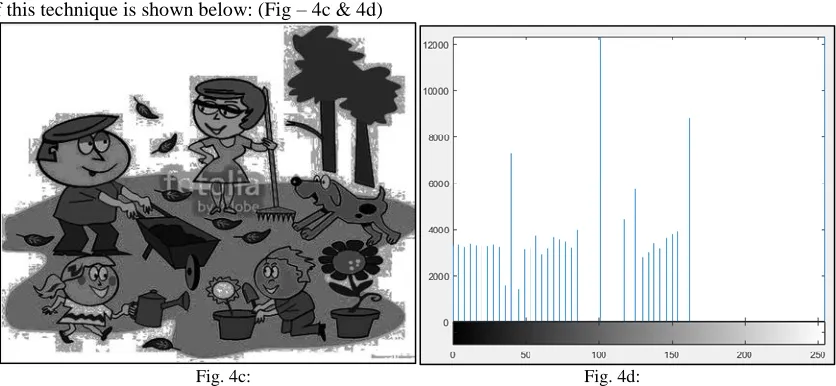
Histogram Equalization:
The result of this technique is shown below: (Fig – 4c & 4d)
Fig. 4c: Fig. 4d:
Edge Detection:
In this technique our aim to find the boundary of all the objects in the input image (Fig – 1). The result figure (Fig – 5) shown below.
Segmentation:
In this technique our aim is to separate the objects of input image (Fig-1). The segmented image shown in (Fig- 6).
Fig. 1: Fig. 6:
Object Detection:
In this technique, our aim is to identify all the objects in the input image (Fig – 1) and bounded the objects. The resultant image shown in (Fig – 7).
Fig. 1: Fig. 7:
Object Extraction:
In this technique, our aim to separate all the images from the input image (Fig -1) and display them separately. The resultant images are shown below (Fig -8). Same kind of images is not shown below.
For Medical Image:
The result of medical image after all operations is given below:
Fig. 9: Original Image Fig. 10: Binary image
V. ALGORITHM
The algorithms of the above methodology given below:
Algorithm for accepting image, various conversion, color channel analysis and image enhancing method
1) Accepting an input RGB image from user (File format is .jpg); 2) Display the input image;
3) Convert the image into greyscale; 4) Display the greyscale image;
5) Display the histogram image of the greyscale image; 6) Convert the input image into binary image(black and white) 7) Display the binary image
8) imR = read input image file
make imR(:,:,2,3) = 0 ; // it only show the red channel of RGB image, green and blue channel is zero
9) imG = read the input image file;
make imG(:,:,1:2:3) = 0; //only show the green channel, red and blue channel = 0 display green channel image;
10) imB = read input image file
make imB(:,:,1:2) = 0; //only show the blue channel, red and green channel = 0 display blue channel image;
//Contrast Stretching
11) Adjust the contrast of the greyscale image of input image 12) Display it;
13) Display the histogram image of adjusting image; //Histogram Equalization
14) Adjust the histogram of the greyscale image of input image 15) Display it;
16) Display the histogram image of adjusting image;
Algorithm for Edge Detection
1) Display it;
2) Display the histogram image of adjusting image; //Histogram Equalization
3) Adjust the histogram of the greyscale image of input image 4) Display it;
5) Display the histogram image of adjusting image; Algorithm for Edge Detection
1) Accept input from user 2) Convert it into greyscale image
3) K = filter the image by creating a filter array 4) Length_k, breath_k = size(k)
5) for index 1 to 255
Counts(index+1,1) = 0 end
// extracting histogram image
6) [Counts, X] = find the histogram image of image k 7) Calculate, total = length_k × breath_k
8) for index 1 to 255
calculate, p(index,1) = counts(index+1,1)/total end
9) a_index = 0 //initialize
10) for index 1 to 254 // skip 1st and last element
11) check , if counts(index,1)<counts(index+1,1) and counts(index+2,2)<counts(index+1,1) then, a_index = a_index+1;
a(a_index,1) = index;
a(a_index,2) = counts(index+1,1); end
end
12) a_size = size(a);
// find the maxima of maxima freq 13) fmax = 0; //initialize 14) for index 1to 255
15) Check, if a(index,2) >fmax
then, fmax = a(index,2); end
end
// finding maxima that is within 0.01 of frequency maxima and store then into array b
check, if a(index,2) >= 0.01 × fmax then, b_index = b_index+1; end
end
// eliminating maxima within intensity range of 20 and storing in array c 18) c_index = 0; //initialization
19) c_int = b(1,1); 20) c_freq = b(1,2); 21) Index = 1
22) While index<b_index
While b(index+1,1) – c_int <=20 Check, if b(index+1,2) > c_freq then, c_int = b(index+1,1); c_freq = b(index+1,2); end
again check, if(index+1)<b_index then, index = index+1; else
break; end end
Calculate,
c_index = c_index+1; c(c_index,1) = c_int;
c(c_index,2) = c_freq; index = index+1; c_int = b(index,1); c_freq = b(index,2);
end
23) thresh = calculate thresh-value of matrix c_index 24) L1 = quantized the thresh value
25) for len 1 to length_k
for breath 1 to breath_k check, if L1(len,breath) ==1
then, L(len,breath) = threash value of 1st value of matrix L
else
if L1(len,breath) = c_index then, L(len,breath) = 255 else
L(len,breath) = calculate thresh value of L(L1(len,breath)) end
end end
26) Img_edge = evaluate the edge of L matrix 27) Display Img_edge;
Algorithm for Segmentation, Object Detection and Object Extraction
1) Accept input image from user
2) Convert the input image into greyscale image // Thresholding
3) I = input image
4) rmat = I(:,:,1);gmat = I(:,:,2);bmat = I(:,:,3); // divide each color channel matrix 5) set a threshold value of each color channel;
6) convert each channel into binary image 7) take sum of each channel
Segmentation Technique
//Complement the binary channel and fill the holes 9) Take complement of the binary channel
10) Fill each small holes in the complement binary image 11) Display the final complement channel as Segmented Image Object Detection
12) Create morphological structure of grey image 13) Open the morphological image
14) Measure the area and eccentricity of grey image objects 15) Label each object using connectivity method
16) Status = measure area and eccentricity of the labelled image 17) Calculate area;
18) Calculate eccentricity;
//using feature analysis count objects
19) index_obj = Find the eccentricity of the objects 20) Make a list of all values of eccentricities 21) Display it;
22) for index 1 to length(index_obj)
h = draw rectangular box around the objects set the color of the bounding boxes end
23) if index>0
then, calculate the number of objects in the image and display it end
Object Extraction
24) After complementing the sum of binary channel, fill the all small holes and label all the objects in the image 25) Find the maximum value of the labelling object
26) For j 1 to max value of label
Find the row and column value corresponding j value len = max(row) - min(row) + 2;
breath = max(col) - min(col) + 2; find, target = zeros([len breath])); sy = min(col) - 1;
sx = min(row) - 1; for i = 1:size(row,1), x = row(i,1) - sx; y = col(i,1) - sy;
target(x,y) = calculate the row and column value of each object end
Display each image ; end
Algorithm for Medical images
1) Accept input image from user
2) Convert the input image into greyscale image 3) Convert the input image into binary image 4) Display the binary image
5) Finding the edge of the input image by ‘canny edge detector’ method 6) Display the edge of the image
Thresholding and segmentation
7) Accepting a threshold value of grey image. Check if the value of grey image greater than the threshold value or not. 8) Take the complement of the threshold image.
9) Fill the holes in the complement image. 10) Display it as Segmented image Object Detection
13) Measure the area and eccentricity of grey image objects 14) Label each object using connectivity method
15) Status = measure area and eccentricity of the labelled image 16) Calculate area;
17) Calculate eccentricity;
//using feature analysis count objects
18) index_obj = Find the eccentricity of the objects 19) Make a list of all values of eccentricities 20) Display it;
21) for index 1 to length(index_obj)
h = draw rectangular box around the objects set the color of the bounding boxes end
22) if index>0
then, calculate the number of objects in the image and display it end
Object Extraction
23) After complementing the sum of binary channel, fill the all small holes and label all the objects in the image 24) Find the maximum value of the labelling object
25) For j 1 to max value of label
Find the row and column value corresponding j value len = max(row) - min(row) + 2;
breath = max(col) - min(col) + 2; find, target = zeros([len breath])); sy = min(col) - 1;
sx = min(row) - 1; for i = 1:size(row,1), x = row(i,1) - sx; y = col(i,1) - sy;
target(x,y) = calculate the row and column value of each object end
Display each image ; end
VI. CONCLUSIONS
In this paper, we have presented Image object extraction techniques. The general process of the Image object extraction has been described. The Image object extraction techniques have been classified and discussed in detail.
REFERENCES
[1] F.Ciontault, D.Gurin, J-P.Guillemin, B.Chopinet, “Infield Triticum aestivum ear counting using color-texture image analysis”, New Zealand Journal of crop and horticultural Science, pp.117-130,2008.
[2] Hakeem AejazAslam ,“A New Approach to Image Segmentation for Brain Tumor detection using Pillar K-means Algorithm”, IJARCCE, pp 1429-1436,2013.
[3] C.Sriramakrishnan, “Performance Analysis of Advanced Image Segmentation Techniques”, International Journal of Computer Applications, pp 13-18, 2012.
[4] Khang Siang Tan ,“Color image segmentation using histogram thresholding – Fuzzy C-means hybrid approach”, ELSEVIER, pp 1-15, 2011. [5] Alzate, C, “Image Segmentation using a Weighted Kernel PCA Approach to Spectral Clustering”, IEEE, CIISP 2007, pp 208-2013, 2007.
[6] Rafika Harrabi , “Color image segmentation using multi-level thresholding approach and data fusion techniques: application in the breast cancer cells images ”, Springer, pp 1-12, 2012.
[7] DibyaJyoti Bora, “A Novel Approach Towards Clustering Based Image Segmentation”, IJESE, pp 6-10, 2014. [8] Mei Yeen Choong “An Image Segmentation using Normalised Cuts in Multistage Approach” IJSSST, pp 10-16, 2016. [9] Rajiv Kumar , “Image Segmentation using Discontinuity-Based Approach”, IJMIP, pp 72-78,2011.
[10] Amanpreet Kaur , “A Review Paper on Image Segmentation and its Various Techniques in Image Processing”, IJSR, pp 12-14, 2014.
[11] Muhammad Waseem Khan et al, “A Survey: Image Segmentation Techniques”, International Journal of Future Computer and Communication, pp 89-93, 2014.